
|
市場調査レポート
商品コード
1684833
蒸気バリア市場の機会、成長促進要因、産業動向分析、2025年~2034年の予測Vapor Barriers Market Opportunity, Growth Drivers, Industry Trend Analysis, and Forecast 2025 - 2034 |
||||||
カスタマイズ可能
|
|||||||
| 蒸気バリア市場の機会、成長促進要因、産業動向分析、2025年~2034年の予測 |
|
出版日: 2025年01月08日
発行: Global Market Insights Inc.
ページ情報: 英文 310 Pages
納期: 2~3営業日
|

全表示
- 概要
- 目次
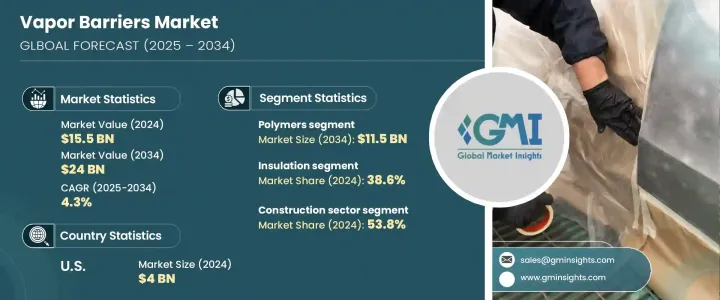
世界の蒸気バリア市場は2024年に155億米ドルに達し、2025年から2034年にかけてCAGR 4.3%で拡大すると予測されています。
この上昇軌道は、エネルギー効率の高い建設、持続可能性、高度な建築技術への注目の高まりが後押ししています。産業界や住宅所有者が湿気対策、省エネルギー、室内空気の質を優先するにつれて、蒸気バリアの需要は住宅、商業、工業の各用途で急増し続けています。特に気候の厳しい地域では、水分の浸入を防ぐことが構造的完全性を維持し、カビによる健康被害を防ぐために極めて重要です。
急速な都市化と工業化も市場を前進させる主な要因です。高度な断熱ソリューションを取り入れる建設プロジェクトが増えるにつれ、熱損失と湿気の蓄積を防ぐ蒸気バリアの役割はさらに不可欠になっています。さらに、グリーンビルディングへの取り組みが普及しつつあることで、エネルギー効率を高める高性能材料の使用が奨励されています。環境に優しい建築慣行を促進することを目的とした政府の奨励金やリベートはさらに市場拡大に寄与しており、蒸気バリアは現代の建築設計に不可欠な要素となっています。ナノテクノロジーや自己修復コーティングを含むバリア材料の技術的進歩は、製品の効率を向上させ、今後10年間のさらなる成長を促進すると予想されます。
| 市場範囲 | |
|---|---|
| 開始年 | 2024 |
| 予測年 | 2025-2034 |
| 開始金額 | 155億米ドル |
| 予測金額 | 240億米ドル |
| CAGR | 4.3% |
市場は、ポリマー、ガラス、金属、乾式壁、その他を含む材料タイプ別に分類されます。ポリマーがこのセグメントを支配しており、2024年には76億米ドルを生み出し、2034年には115億米ドルに達すると予測されています。ポリマーが広く好まれているのは、費用対効果、耐久性、優れた耐湿性に起因します。特にポリエチレンとポリプロピレンは、その柔軟性、設置の容易さ、長期的な性能から人気のある選択肢となっています。また、これらの材料は紫外線暴露などの環境要因に対する耐性も強化されており、様々な建設用途において長寿命と信頼性を保証しています。
用途別では、市場は防水、耐腐食、断熱、その他に区分されます。断熱材セグメントは2024年に市場シェアの38.6%を占めるが、これはエネルギー効率の最適化と湿気のコントロールにおける重要な役割を反映しています。断熱材に一体化された蒸気バリアは、安定した室内温度を維持し、エネルギー消費を削減し、特に極端な気象条件の地域でカビ関連の問題を防ぐのに役立ちます。建築業者や不動産所有者は、進化する規制要件を満たしながら熱効率を高める材料を求めているため、持続可能で高性能な断熱ソリューションに対する需要の高まりが、このセグメントの成長を牽引し続けています。
米国の蒸気バリア市場は2024年に40億米ドルと評価され、エネルギー効率の高い持続可能な建設ソリューションの採用が増加しているため、依然としてトップランナーです。防湿に対する意識の高まりと、それが断熱や省エネに与える影響が、引き続き需要を後押ししています。さらに、国際省エネルギー基準(IECC)やASHRAEなどの組織による厳しい規制が、住宅や商業建築プロジェクトにおける蒸気バリアの普及を後押ししています。建設業者や開発業者が長期的な耐久性、エネルギー効率、進化する建築基準への準拠を優先しているため、蒸気バリアの需要は今後も堅調に推移すると予想されます。
目次
第1章 調査手法と調査範囲
- 市場範囲と定義
- 基本推定と計算
- 予測計算
- データソース
- 1次データ
- 二次資料
- 有料情報源
- 公的情報源
第2章 エグゼクティブサマリー
第3章 業界洞察
- エコシステム分析
- バリューチェーンに影響を与える要因
- 利益率分析
- 破壊
- 将来の展望
- メーカー
- 流通業者
- サプライヤーの状況
- 利益率分析
- 主要ニュース
- 規制状況
- 影響要因
- 促進要因
- 省エネルギーと持続可能な建物に対する意識の高まり
- 建設プロジェクトにおけるエネルギー効率と湿気対策に関する政府の規制
- グリーンビルディング認証(LEEDなど)による、環境基準を満たすために蒸気バリアのような材料の採用を奨励
- 業界の潜在的リスク&課題
- 水蒸気バリアは、様々な建材との適合性を考慮して慎重に選択する必要があります。
- 蒸気バリアの設置にかかる初期費用は、特に高品質の材料の場合、高額になる可能性があります。
- 促進要因
- 成長可能性分析
- ポーター分析
- PESTEL分析
第4章 競合情勢
- イントロダクション
- 企業シェア分析
- 競合のポジショニング・マトリックス
- 戦略展望マトリックス
第5章 市場規模・予測:材料別、2021年~2034年
- 主要動向
- ポリマー
- ポリエチレン
- ポリプロピレン
- ポリ塩化ビニル
- その他
- ガラス
- 金属
- 乾式壁
- その他
第6章 市場規模・予測:用途別、2021年~2034年
- 主要動向
- 断熱
- 防水
- 耐食性
- その他
第7章 市場規模・予測:施工別、2021年~2034年
- 主要動向
- メンブレン
- コーティング
- セメント系防水
- 積層・充填
第8章 市場規模・予測:最終用途別、2021年~2034年
- 主要動向
- 建設
- 包装
- 自動車
- その他
第9章 市場規模・予測:地域別、2021年~2034年
- 主要動向
- 北米
- 米国
- カナダ
- 欧州
- 英国
- ドイツ
- フランス
- イタリア
- スペイン
- ロシア
- アジア太平洋
- 中国
- インド
- 日本
- 韓国
- オーストラリア
- ラテンアメリカ
- ブラジル
- メキシコ
- 中東・アフリカ
- 南アフリカ
- サウジアラビア
- アラブ首長国連邦
第10章 企業プロファイル
- BASF
- Carlisle Companies
- CertainTeed Corporation
- Dow Chemical Company
- DuPont de Nemours
- Firestone Building Products
- GAF Materials Corporation
- GCP Applied Technologies
- Honeywell
- Johns Manville
- Sika
- Soprema Group
The Global Vapor Barriers Market reached USD 15.5 billion in 2024 and is projected to expand at a CAGR of 4.3% between 2025 and 2034. This upward trajectory is fueled by the increasing focus on energy-efficient construction, sustainability, and advanced building technologies. As industries and homeowners prioritize moisture control, energy conservation, and indoor air quality, the demand for vapor barriers continues to surge across residential, commercial, and industrial applications. The adoption of these barriers is further reinforced by stringent building codes, especially in regions with extreme climates, where protection against moisture infiltration is crucial for maintaining structural integrity and preventing mold-related health hazards.
Rapid urbanization and industrialization are also key drivers propelling the market forward. As more construction projects incorporate advanced insulation solutions, the role of vapor barriers in preventing heat loss and moisture accumulation has become even more essential. Additionally, the increasing prevalence of green building initiatives is encouraging the use of high-performance materials that enhance energy efficiency. Government incentives and rebates aimed at promoting eco-friendly construction practices further contribute to market expansion, making vapor barriers an integral component of modern building design. Technological advancements in barrier materials, including nanotechnology and self-healing coatings, are expected to improve product efficiency, fostering further growth over the next decade.
| Market Scope | |
|---|---|
| Start Year | 2024 |
| Forecast Year | 2025-2034 |
| Start Value | $15.5 Billion |
| Forecast Value | $24 Billion |
| CAGR | 4.3% |
The market is categorized by material type, including polymers, glass, metal, drywall, and others. Polymers dominate the segment, generating USD 7.6 billion in 2024, and is projected to reach USD 11.5 billion by 2034. Their widespread preference stems from their cost-effectiveness, durability, and superior moisture resistance. Polyethylene and polypropylene, in particular, are popular choices due to their flexibility, ease of installation, and long-term performance. These materials also offer enhanced resistance to environmental factors such as UV exposure, ensuring extended lifespan and reliability in various construction applications.
By application, the market is segmented into waterproofing, corrosion resistance, insulation, and others. The insulation segment accounts for 38.6% of the market share in 2024, reflecting its critical role in optimizing energy efficiency and controlling moisture. Integrated vapor barriers in insulation materials help maintain stable indoor temperatures, reduce energy consumption, and prevent mold-related issues, particularly in regions with extreme weather conditions. The growing demand for sustainable and high-performance insulation solutions continues to drive this segment's growth as builders and property owners seek materials that enhance thermal efficiency while meeting evolving regulatory requirements.
The U.S. vapor barriers market, valued at USD 4 billion in 2024, remains a frontrunner due to the growing adoption of energy-efficient and sustainable construction solutions. Increased awareness of moisture control and its impact on insulation and energy savings continues to fuel demand. Additionally, strict regulations from organizations such as the International Energy Conservation Code (IECC) and ASHRAE are driving the widespread use of vapor barriers in residential and commercial construction projects. As builders and developers prioritize long-term durability, energy efficiency, and compliance with evolving building standards, the demand for vapor barriers is expected to remain strong in the coming years.
Table of Contents
Chapter 1 Methodology & Scope
- 1.1 Market scope & definition
- 1.2 Base estimates & calculations
- 1.3 Forecast calculation
- 1.4 Data sources
- 1.4.1 Primary
- 1.4.2 Secondary
- 1.4.2.1 Paid sources
- 1.4.2.2 Public sources
Chapter 2 Executive Summary
- 2.1 Industry synopsis, 2021-2034
Chapter 3 Industry Insights
- 3.1 Industry ecosystem analysis
- 3.1.1 Factor affecting the value chain
- 3.1.2 Profit margin analysis
- 3.1.3 Disruptions
- 3.1.4 Future outlook
- 3.1.5 Manufacturers
- 3.1.6 Distributors
- 3.2 Supplier landscape
- 3.3 Profit margin analysis
- 3.4 Key news & initiatives
- 3.5 Regulatory landscape
- 3.6 Impact forces
- 3.6.1 Growth drivers
- 3.6.1.1 Increasing awareness of energy conservation and sustainable building
- 3.6.1.2 Government regulations on energy efficiency and moisture control in construction projects
- 3.6.1.3 Green building certifications (e.g., LEED) are encouraging the adoption of materials like vapor barriers to meet environmental standards.
- 3.6.2 Industry pitfalls & challenges
- 3.6.2.1 Vapor barriers must be carefully selected for compatibility with various construction materials
- 3.6.2.2 The initial cost of installing vapor barriers can be high, especially for high-quality materials.
- 3.6.1 Growth drivers
- 3.7 Growth potential analysis
- 3.8 Porter’s analysis
- 3.9 PESTEL analysis
Chapter 4 Competitive Landscape, 2024
- 4.1 Introduction
- 4.2 Company market share analysis
- 4.3 Competitive positioning matrix
- 4.4 Strategic outlook matrix
Chapter 5 Market Size and Forecast, By Material, 2021-2034 (USD Billion) (SqM)
- 5.1 Key trends
- 5.2 Polymers
- 5.2.1 Polyethylene
- 5.2.2 Polypropylene
- 5.2.3 Polyvinyl chloride
- 5.2.4 Others
- 5.3 Glass
- 5.4 Metal
- 5.5 Drywall
- 5.6 Others
Chapter 6 Market Size and Forecast, By Application, 2021-2034 (USD Billion) (SqM)
- 6.1 Key trends
- 6.2 Insulation
- 6.3 Waterproofing
- 6.4 Corrosion resistance
- 6.5 Others
Chapter 7 Market Size and Forecast, By Installation, 2021-2034 (USD Billion) (SqM)
- 7.1 Key trends
- 7.2 Membranes
- 7.3 Coatings
- 7.4 Cementitious waterproofing
- 7.5 Stacking and filling
Chapter 8 Market Size and Forecast, By End Use, 2021-2034 (USD Billion) (SqM)
- 8.1 Key trends
- 8.2 Construction
- 8.3 Packaging
- 8.4 Automotive
- 8.5 Others
Chapter 9 Market Size and Forecast, By Region, 2021-2034 (USD Billion) (SqM)
- 9.1 Key trends
- 9.2 North America
- 9.2.1 U.S.
- 9.2.2 Canada
- 9.3 Europe
- 9.3.1 UK
- 9.3.2 Germany
- 9.3.3 France
- 9.3.4 Italy
- 9.3.5 Spain
- 9.3.6 Russia
- 9.4 Asia Pacific
- 9.4.1 China
- 9.4.2 India
- 9.4.3 Japan
- 9.4.4 South Korea
- 9.4.5 Australia
- 9.5 Latin America
- 9.5.1 Brazil
- 9.5.2 Mexico
- 9.6 MEA
- 9.6.1 South Africa
- 9.6.2 Saudi Arabia
- 9.6.3 UAE
Chapter 10 Company Profiles
- 10.1 BASF
- 10.2 Carlisle Companies
- 10.3 CertainTeed Corporation
- 10.4 Dow Chemical Company
- 10.5 DuPont de Nemours
- 10.6 Firestone Building Products
- 10.7 GAF Materials Corporation
- 10.8 GCP Applied Technologies
- 10.9 Honeywell
- 10.10 Johns Manville
- 10.11 Sika
- 10.12 Soprema Group

