
|
市場調査レポート
商品コード
1892848
コールドチェーン監視市場の機会、成長要因、業界動向分析、および2026年から2035年までの予測Cold Chain Monitoring Market Opportunity, Growth Drivers, Industry Trend Analysis, and Forecast 2026 - 2035 |
||||||
カスタマイズ可能
|
|||||||
| コールドチェーン監視市場の機会、成長要因、業界動向分析、および2026年から2035年までの予測 |
|
出版日: 2025年12月08日
発行: Global Market Insights Inc.
ページ情報: 英文 210 Pages
納期: 2~3営業日
|

概要
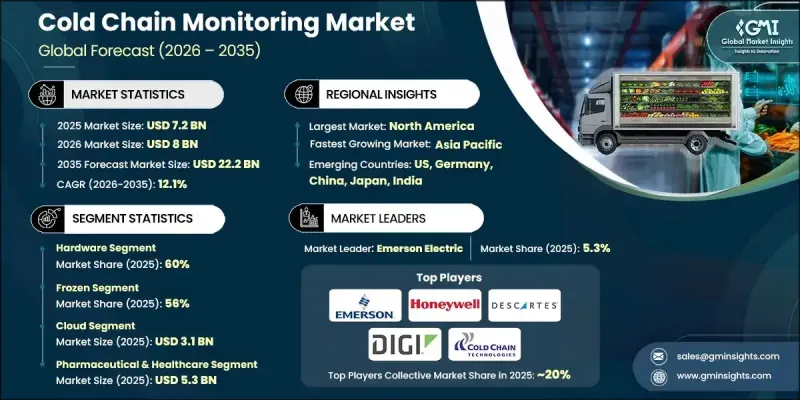
世界のコールドチェーン監視市場は、2025年に72億米ドルと評価され、2035年までにCAGR12.1%で成長し、222億米ドルに達すると予測されています。
生鮮食品、肉類、魚介類、乳製品、冷凍食品、即席食品などの生鮮食品の消費増加に伴い、サプライチェーン全体における精密な温度管理の需要が高まっています。配送サイクルの短縮化と流通ネットワークの拡大に伴い、企業は製品の損傷防止と品質維持に対するプレッシャーが増大しています。特に生鮮食品の国際取引が拡大する中、現在ではすべての輸送において完全なトレーサビリティと厳格な温度管理が求められています。廃棄物の削減と鮮度保持、さらに安全性や品質の一貫性に対する高まる期待に応えるため、コールドチェーン監視は不可欠となっています。正確な温度監視の必要性は、生物学的製剤、ワクチン、特殊治療薬が厳格に管理された温度範囲に依存する製薬分野において、さらに重要性を増しています。温度に敏感な治療法の採用が増加する中、製造業者や流通業者は、アラート機能と監査対応データを提供するリアルタイムで検証済みの監視ツールに大きく依存しています。公衆衛生上の緊急事態におけるデジタルシステムの導入加速は、製薬業界においてリアルタイムのコールドチェーン監視を最優先事項としてさらに確固たるものとしています。
| 市場範囲 | |
|---|---|
| 開始年 | 2025年 |
| 予測年度 | 2026-2035 |
| 開始時価値 | 72億米ドル |
| 予測金額 | 222億米ドル |
| CAGR | 12.1% |
ハードウェアセグメントは2025年に60%のシェアを占め、2026年から2035年にかけてCAGR12.4%で成長すると予測されています。コールドチェーン業務では、倉庫、冷蔵輸送車両、コンテナ、ラストマイル設備に設置される物理的監視装置、温度プローブ、GPSユニット、データロガー、湿度センサー、テレマティクスツール、ドア状態検知器など、大量のハードウェアに依存しています。すべてのパレット、出荷品、保管ポイントで継続的な追跡が必要なため、ハードウェア需要はソフトウェア導入よりも急速に拡大し、市場における主導的地位を確固たるものにしています。
冷凍セグメントは2025年に56%のシェアを占め、2035年までCAGR12.4%で成長すると予測されています。特定の医薬品、生物製剤、温度に敏感な食品など、冷凍温度で保管される製品は、厳密に管理された環境下で維持されなければなりません。わずかな温度変動でも安全性と有効性が損なわれる可能性があるため、企業はサプライチェーン全体における継続的モニタリング、高精度センサー、信頼性の高いリアルタイム報告システムへの投資を進めています。
米国のコールドチェーン監視市場は2025年に23億米ドル規模に達しました。同国に広がる冷蔵保管施設と温度管理輸送網が監視システムの普及を促進しています。生鮮食品、加工食品、冷凍品、生物学的製剤、高度医薬品に対する厳格な要件に加え、生鮮食品流通の規模の大きさがリアルタイム可視化の必要性をさらに高めています。製品の多様性、長距離輸送、小売業者のパフォーマンス基準の高さが相まって、正確なコールドチェーン追跡技術への需要は継続的に高まっています。
世界のコールドチェーンモニタリング市場で活動する企業には、テスツォ、コントロールアント、コールドチェーンテクノロジーズ、デジインターナショナル、センシテック、ゼブラテクノロジーズ、デカルトシステムズ、エマーソンエレクトリック、ハネウェルインターナショナル、オーアールビーコムなどがございます。コールドチェーンモニタリング市場で競合する企業は、ハードウェアポートフォリオの拡充、センサー精度の向上、先進的な接続機能の製品ラインへの統合を通じて、自社の地位を強化しております。多くの企業は、温度追跡、位置情報、自動アラートを組み合わせたリアルタイムプラットフォームの開発に注力し、規制順守の支援と廃棄リスクの低減を図っています。物流事業者や製薬メーカーとの戦略的提携により、ベンダーは監視ソリューションをサプライチェーンのより深い層に組み込むことが可能となります。
よくあるご質問
目次
第1章 調査手法と範囲
第2章 エグゼクティブサマリー
第3章 業界考察
- エコシステム分析
- サプライヤーの情勢
- センサー及びハードウェアメーカー
- 接続性とIoTネットワークプロバイダー
- ソフトウェア/プラットフォーム提供事業者
- コールドチェーン包装・断熱コンテナ
- 冷凍機器メーカー
- 冷蔵倉庫事業者様及び倉庫インフラ
- コスト構造
- 利益率
- 各段階における付加価値
- サプライチェーンに影響を与える要因
- ディスラプター
- サプライヤーの情勢
- 影響要因
- 促進要因
- クラウドコンピューティングの急速な成長とハイパースケール拡張
- AI、機械学習、および高性能コンピューティング(HPC)の爆発的普及
- 業界横断的なデータ生成量の増加
- 低遅延アプリケーション向けエッジコンピューティングの成長
- 業界の潜在的リスク&課題
- 電力と冷却の制約により、高密度サーバーの導入が制限されます
- エネルギーコストの上昇が総所有コスト(TCO)とサーバー更新の判断に圧力をかけています
- サプライチェーンの変動性と半導体不足により、サーバー出荷が遅延しております
- 市場機会
- AI最適化およびGPU加速サーバーの導入加速
- エッジコンピューティングの成長が新たなサーバー展開の足跡を開拓します
- 液体冷却への移行は、ハードウェアのアップグレードサイクルを生み出します
- ARMベースサーバーおよび代替アーキテクチャの台頭
- 促進要因
- 成長可能性分析
- 規制情勢
- 北米
- 欧州
- アジア太平洋地域
- ラテンアメリカ
- 中東・アフリカ
- ポーター分析
- PESTEL分析
- 技術動向とイノベーションエコシステム
- 現行技術
- IoTベースのセンサー及び無線環境センサー
- 温度・湿度データロガー
- 冷蔵コンテナ/車両向けテレマティクス統合
- GPS/位置追跡と冷蔵コンテナ監視の連携
- 新興技術
- 予測分析/AIおよび機械学習を活用した分析
- データ駆動型意思決定プラットフォーム
- 広範なサプライチェーンシステムとの統合
- エッジコンピューティング/ローカル処理とハイブリッドアーキテクチャ
- 現行技術
- 特許分析
- 価格動向分析
- 地域別
- 製品別
- 生産統計
- 生産拠点
- 消費拠点
- 輸出入
- コスト内訳分析
- リスク分析と管理
- 業務リスク評価
- 財務リスク評価
- 技術・サイバーセキュリティリスク
- リスク軽減戦略
- サステナビリティと環境面
- 持続可能な取り組み
- 廃棄物削減戦略
- 生産におけるエネルギー効率
- 環境に配慮した取り組み
- カーボンフットプリントに関する考慮事項
- ユースケース
- ベストケースシナリオ
- 投資利益率(ROI)と費用便益分析
- 機能と価格のベンチマーク
- 顧客嗜好/購買行動
第4章 競合情勢
- イントロダクション
- 企業の市場シェア分析
- 北米
- 欧州
- アジア太平洋地域
- ラテンアメリカ
- 中東・アフリカ地域
- 主要市場企業の競合分析
- 競合ポジショニングマトリックス
- 戦略的展望マトリックス
- 主な発展
- 合併・買収
- 提携・協業
- 新製品の発売
- 事業拡大計画と資金調達
第5章 市場推計・予測:コンポーネント別、2022-2035
- 主要動向
- ハードウェア
- センサー
- RFIDデバイス
- テレマティクス
- ネットワーク機器
- その他
- ソフトウェア
- リアルタイム監視
- 分析とレポート
- サービス
- 専門サービス
- マネージドサービス
第6章 市場推計・予測:温度別、2022-2035
- 主要動向
- 冷凍
- コールドストレージ
第7章 市場推計・予測:導入形態別、2022-2035
- 主要動向
- クラウド
- オンプレミス
- ハイブリッド
第8章 市場推計・予測:物流分野別、2022-2035
- 主要動向
- ストレージ
- 輸送
第9章 市場推計・予測:最終用途別、2022-2035
- 主要動向
- 医薬品・医療分野
- 食品・飲料
- 物流・流通
- 化学品
- その他
第10章 市場推計・予測:地域別、2022-2035
- 主要動向
- 北米
- 米国
- カナダ
- 欧州
- ドイツ
- 英国
- フランス
- イタリア
- スペイン
- ロシア
- 北欧諸国
- ベネルクス
- アジア太平洋地域
- 中国
- インド
- 日本
- オーストラリア
- 韓国
- タイ
- インドネシア
- シンガポール
- ラテンアメリカ
- ブラジル
- メキシコ
- アルゼンチン
- コロンビア
- 中東・アフリカ地域
- 南アフリカ
- サウジアラビア
- アラブ首長国連邦
第11章 企業プロファイル
- Global Leaders
- Sensitech(Carrier Global)
- Emerson Electric
- Honeywell International
- Descartes Systems
- Digi International
- Zebra Technologies
- Cold Chain Technologies(CCT)
- ORBCOMM
- Controlant
- Testo
- ELPRO-Buchs
- Regional Champions
- DeltaTrak
- Monnit
- FreshLoc Technologies
- Samsara
- Tive
- Roambee
- Blulog(low-power NFC and wireless data loggers)
- OnAsset Intelligence(air cargo temperature &security tracking)
- Zest Labs
- TagBox
- 新興企業
- SenseAnywhere
- Rotronic
- TempGenius
- Zhuhai Rayonics Technology
- Blulog
