
|
市場調査レポート
商品コード
1667043
自律走行バス市場の機会、成長促進要因、産業動向分析、2025年~2034年の予測Autonomous Bus Market Opportunity, Growth Drivers, Industry Trend Analysis, and Forecast 2025 - 2034 |
||||||
カスタマイズ可能
|
|||||||
| 自律走行バス市場の機会、成長促進要因、産業動向分析、2025年~2034年の予測 |
|
出版日: 2024年12月17日
発行: Global Market Insights Inc.
ページ情報: 英文 180 Pages
納期: 2~3営業日
|

全表示
- 概要
- 目次
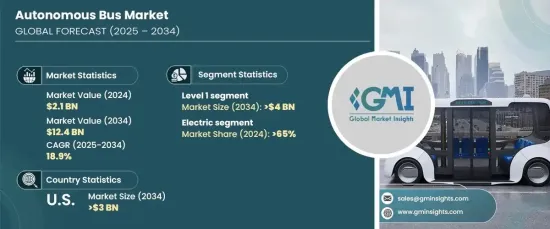
自律走行バスの世界市場は、2024年に21億米ドルと評価され、効率的で持続可能な公共交通ソリューションに対する需要の増加により、2025年から2034年にかけて18.9%の著しいCAGRが見込まれます。
世界各国の政府が交通渋滞を緩和し、二酸化炭素排出を抑制するためにスマートシティ構想を優先する中、自律走行バスの採用が大きな牽引力となっています。これらのドライバーレス車両は、都市モビリティにおける極めて重要な進歩を象徴しており、路線効率の最適化、運行コストの削減、安全性の向上により、公共交通機関への革新的なアプローチを提供しています。
急速な都市化は、大都市圏の人口密度の上昇と相まって、高度な交通ソリューションの必要性をさらに高めています。最先端技術を搭載した自律走行バスは、スマート交通管理システムとシームレスに統合することで、接続性を向上させ、遅延を最小限に抑え、よりスムーズな通勤を実現することで、従来の交通システムに変革をもたらしつつあります。また、温室効果ガス排出量の削減や化石燃料への依存度低減への注目が高まっていることも、交通機関にこうした環境に優しい代替手段の採用を促し、市場の成長をさらに促進しています。
| 市場範囲 | |
|---|---|
| 開始年 | 2024 |
| 予測年 | 2025-2034 |
| 開始金額 | 21億米ドル |
| 予測金額 | 124億米ドル |
| CAGR | 18.9% |
市場はレベル1、レベル2、レベル3、レベル4の自律性に区分され、それぞれ自動化の度合いが異なります。2024年には、レベル1の自動化が40%の市場シェアを占め、2034年までに40億米ドルの市場規模になると予測されます。アダプティブ・クルーズ・コントロールやレーンキーピング・アシスタンスなどのADAS(先進運転支援システム)を含むレベル1の自動運転は、その費用対効果と既存車両へのシームレスな統合により、交通機関にとって好ましい選択肢となっています。これらの機能は、インフラの大幅なアップグレードを必要とせずに安全性と運行効率を高めるため、広範な展開にとって魅力的な選択肢となっています。
車両タイプ別に見ると、市場はディーゼルバス、電気バス、ハイブリッドバスに分類され、2024年のシェアは電気バスが65%を占めてトップです。世界中の政府や交通事業者が持続可能性とカーボンニュートラルを重視しているため、電気バスの採用が急増しています。世界の環境規制とバッテリー技術の進歩に支えられ、電気バスは現在、航続距離、効率、手頃な価格が改善され、都市や地域の交通網にとって最適なソリューションとなっています。
米国の自律走行バス市場は、2024年には90%のシェアを占め、2034年には30億米ドルに達すると予測されています。この成長の原動力は、研究開発への旺盛な投資と技術革新への強いコミットメントです。同国の確立されたインフラと自律走行車の試験に対する支援政策が、都市部と郊外の両方で自律走行バスの配備を促進する環境を作り出し、米国をこの変革市場のリーダーとして確固たるものにしています。
目次
第1章 調査手法と調査範囲
- 調査デザイン
- 調査アプローチ
- データ収集方法
- 基本推定と計算
- 基準年の算出
- 市場推計の主要動向
- 予測モデル
- 1次調査と検証
- 一次情報
- データマイニングソース
- 市場定義
第2章 エグゼクティブサマリー
第3章 業界洞察
- エコシステム分析
- サプライヤーの状況
- テクノロジープロバイダー
- サービスプロバイダー
- 流通業者
- 最終用途
- 利益率分析
- 価格分析
- コスト内訳
- テクノロジーとイノベーションの展望
- 主要ニュースと取り組み
- 規制状況
- 影響要因
- 促進要因
- スマート交通システムに対する政府の取り組みと資金調達
- 安全で効率的な自律航行を可能にするAIとIoTの進歩
- 自律走行電気バスを促進する環境規制
- 都市の混雑に対処するための効率的な公共交通機関への需要の高まり
- 業界の潜在的リスク&課題
- 自律走行技術の高い開発・展開コスト
- 大規模導入を遅らせる規制と安全性の懸念
- 促進要因
- 成長可能性分析
- ポーターの分析
- PESTEL分析
第4章 競合情勢
- イントロダクション
- 企業シェア分析
- 競合のポジショニング・マトリックス
- 戦略展望マトリックス
第5章 市場推計・予測:自律性別、2021年~2034年
- 主要動向
- レベル1
- レベル2
- レベル3
- レベル4
第6章 市場推計・予測:燃料別、2021年~2034年
- 主要動向
- ディーゼル
- 電気
- ハイブリッド
第7章 市場推計・予測:用途別、2021年~2032年
- 主要動向
- インターシティ
- イントラシティ
第8章 市場推計・予測:地域別、2021年~2034年
- 主要動向
- 北米
- 米国
- カナダ
- 欧州
- 英国
- ドイツ
- フランス
- スペイン
- イタリア
- ロシア
- 北欧
- アジア太平洋
- 中国
- インド
- 日本
- 韓国
- ニュージーランド
- 東南アジア
- ラテンアメリカ
- ブラジル
- メキシコ
- アルゼンチン
- 中東・アフリカ
- UAE
- 南アフリカ
- サウジアラビア
第9章 企業プロファイル
- バスメーカー
- AB Volvo
- Apollo Baidu
- BYD Co. Ltd.
- Easymile
- MAN Truck &Bus
- Daimler AG
- Navya
- New Flyer
- Toyotas Motor Corporation
- Yutong Group Co. Ltd.
- 自律走行ソリューション・プロバイダー
- Continental AG
- Denso Corporation
- Robert Bosch GmbH
- SB Drive Corp
- ST Engineering
The Global Autonomous Bus Market was valued at USD 2.1 billion in 2024 and is expected to witness a remarkable CAGR of 18.9% from 2025 to 2034, driven by the increasing demand for efficient and sustainable public transportation solutions. With governments worldwide prioritizing smart city initiatives to mitigate traffic congestion and curb carbon emissions, the adoption of autonomous buses has gained substantial traction. These driverless vehicles represent a pivotal advancement in urban mobility, offering an innovative approach to public transit by optimizing route efficiency, reducing operational costs, and enhancing safety.
Rapid urbanization, coupled with rising population density in metropolitan areas, has further escalated the need for advanced transit solutions. Autonomous buses, equipped with cutting-edge technologies, are transforming traditional transportation systems by seamlessly integrating with smart traffic management systems to improve connectivity, minimize delays, and ensure a smoother commuting experience. The increasing focus on reducing greenhouse gas emissions and dependency on fossil fuels is also pushing transit agencies to adopt these eco-friendly alternatives, further driving market growth.
| Market Scope | |
|---|---|
| Start Year | 2024 |
| Forecast Year | 2025-2034 |
| Start Value | $2.1 Billion |
| Forecast Value | $12.4 Billion |
| CAGR | 18.9% |
The market is segmented into Level 1, Level 2, Level 3, and Level 4 autonomy, each offering varying degrees of automation. In 2024, Level 1 automation accounted for a dominant 40% market share and is projected to generate USD 4 billion by 2034. Level 1 autonomy, which includes advanced driver assistance systems like adaptive cruise control and lane-keeping assistance, has become a preferred choice for transit agencies due to its cost-effectiveness and seamless integration into existing vehicles. These features enhance safety and operational efficiency without requiring significant infrastructure upgrades, making them an attractive option for widespread deployment.
In terms of vehicle type, the market is categorized into diesel, electric, and hybrid buses, with electric buses leading the pack at a commanding 65% share in 2024. The adoption of electric buses has surged as governments and transit operators worldwide emphasize sustainability and carbon neutrality. Supported by global environmental regulations and advancements in battery technology, electric buses now offer improved range, efficiency, and affordability, making them the go-to solution for urban and regional transportation networks.
The United States autonomous bus market held an impressive 90% share in 2024 and is forecast to reach USD 3 billion by 2034. This growth is fueled by robust investments in research and development, combined with a strong commitment to technological innovation. The country's well-established infrastructure and supportive policies for autonomous vehicle testing have created a conducive environment for the deployment of autonomous buses in both urban and suburban areas, cementing the US as a leader in this transformative market.
Table of Contents
Chapter 1 Methodology & Scope
- 1.1 Research design
- 1.1.1 Research approach
- 1.1.2 Data collection methods
- 1.2 Base estimates and calculations
- 1.2.1 Base year calculation
- 1.2.2 Key trends for market estimates
- 1.3 Forecast model
- 1.4 Primary research & validation
- 1.4.1 Primary sources
- 1.4.2 Data mining sources
- 1.5 Market definitions
Chapter 2 Executive Summary
- 2.1 Industry 3600 synopsis, 2021 - 2034
Chapter 3 Industry Insights
- 3.1 Industry ecosystem analysis
- 3.2 Supplier landscape
- 3.2.1 Technology providers
- 3.2.2 Service providers
- 3.2.3 Distributors
- 3.2.4 End use
- 3.3 Profit margin analysis
- 3.4 Pricing analysis
- 3.5 Cost Breakdown
- 3.6 Technology & innovation landscape
- 3.7 Key news & initiatives
- 3.8 Regulatory landscape
- 3.9 Impact forces
- 3.9.1 Growth drivers
- 3.9.1.1 Government Initiatives and Funding for smart transportation systems
- 3.9.1.2 Advancements in AI and IoT enabling safe and efficient autonomous navigation
- 3.9.1.3 Environmental regulations promoting autonomous electric buses
- 3.9.1.4 Growing demand for efficient public transit to address urban congestion
- 3.9.2 Industry pitfalls & challenges
- 3.9.2.1 High development and deployment costs of autonomous technology
- 3.9.2.2 Regulatory and safety concerns delaying large-scale adoption
- 3.9.1 Growth drivers
- 3.10 Growth potential analysis
- 3.11 Porter’s analysis
- 3.12 PESTEL analysis
Chapter 4 Competitive Landscape, 2024
- 4.1 Introduction
- 4.2 Company market share analysis
- 4.3 Competitive positioning matrix
- 4.4 Strategic outlook matrix
Chapter 5 Market Estimates & Forecast, By Autonomy, 2021 - 2034 ($Bn, Units)
- 5.1 Key trends
- 5.2 Level 1
- 5.3 Level 2
- 5.4 Level 3
- 5.5 Level 4
Chapter 6 Market Estimates & Forecast, By Fuel, 2021 - 2034 ($Bn, Units)
- 6.1 Key trends
- 6.2 Diesel
- 6.3 Electric
- 6.4 Hybrid
Chapter 7 Market Estimates & Forecast, By Application, 2021 - 2032 ($Bn, Units)
- 7.1 Key trends
- 7.2 Intercity
- 7.3 Intracity
Chapter 8 Market Estimates & Forecast, By Region, 2021 - 2034 ($Bn, Units)
- 8.1 Key trends
- 8.2 North America
- 8.2.1 U.S.
- 8.2.2 Canada
- 8.3 Europe
- 8.3.1 UK
- 8.3.2 Germany
- 8.3.3 France
- 8.3.4 Spain
- 8.3.5 Italy
- 8.3.6 Russia
- 8.3.7 Nordics
- 8.4 Asia Pacific
- 8.4.1 China
- 8.4.2 India
- 8.4.3 Japan
- 8.4.4 South Korea
- 8.4.5 ANZ
- 8.4.6 Southeast Asia
- 8.5 Latin America
- 8.5.1 Brazil
- 8.5.2 Mexico
- 8.5.3 Argentina
- 8.6 MEA
- 8.6.1 UAE
- 8.6.2 South Africa
- 8.6.3 Saudi Arabia
Chapter 9 Company Profiles
- 9.1 Bus Manufacturers
- 9.1.1 AB Volvo
- 9.1.2 Apollo Baidu
- 9.1.3 BYD Co. Ltd.
- 9.1.4 Easymile
- 9.1.5 MAN Truck & Bus
- 9.1.6 Daimler AG
- 9.1.7 Navya
- 9.1.8 New Flyer
- 9.1.9 Toyotas Motor Corporation
- 9.1.10 Yutong Group Co. Ltd.
- 9.2 Autonomous driving solution providers
- 9.2.1 Continental AG
- 9.2.2 Denso Corporation
- 9.2.3 Robert Bosch GmbH
- 9.2.4 SB Drive Corp
- 9.2.5 ST Engineering

