|
|
市場調査レポート
商品コード
1389701
分岐鎖アミノ酸(BCAA)市場規模:タイプ、用途、形態別&世界予測、2023年~2032年Branched Chain Amino Acids (BCAAs) Market Size - By Type (L-Leucine, L-Isoleucine, and L-Valine), Applications (Sports Nutrition, Food and Beverage, Animal Feed, Pharmaceuticals, Cosmetics and Personal Care), Form & Global Forecast, 2023 - 2032 |
||||||
|
|
|||||||
カスタマイズ可能
|
|||||||


| 分岐鎖アミノ酸(BCAA)市場規模:タイプ、用途、形態別&世界予測、2023年~2032年 |
|
出版日: 2023年10月18日
発行: Global Market Insights Inc.
ページ情報: 英文 210 Pages
納期: 2~3営業日
|

- 全表示
- 概要
- 図表
- 目次
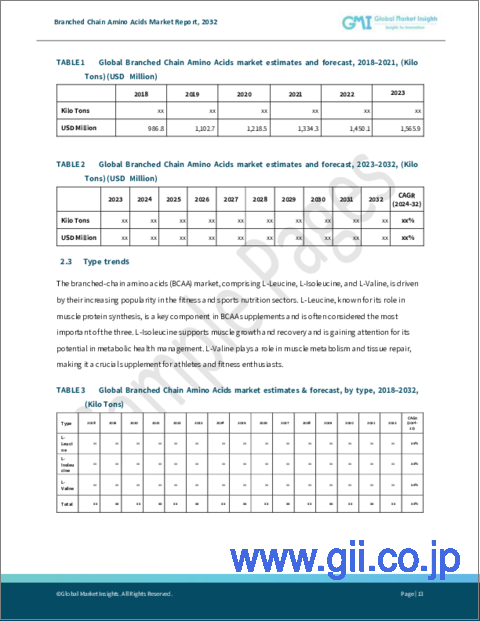
分岐鎖アミノ酸(BCAA)の世界市場規模は、2023年から2032年にかけてCAGR 5.8%を記録する見通しです。
多様な嗜好に対応し、消費者の全体的な体験を向上させるために、いくつかのBCAAプロバイダーは、新しい製剤やフレーバーを導入するための技術革新に注力しています。パウダー、カプセル、ドリンクといった新しいデリバリー・フォーマットの導入に重点を置いていることも、市場の成長を後押しすると思われます。一例を挙げると、英国を拠点とする急成長中のスポーツ栄養ブランドApplied Nutritionは2021年10月、On-the-goレンジを拡大するため、330mlの炭酸缶入りBCAAアミノハイドレートドリンクの新ラインを発表しました。
種類別では、L-バリンセグメントの市場規模は2023-2032年にCAGR 6.3%を記録する可能性があります。L-バリンは、肉類、乳製品、豆類など、タンパク質が豊富な食品に含まれています。そのため、他のBCAAと組み合わせて栄養補助食品として広く使用され、タンパク質の必要量が増加している個人や特定のフィットネス目標に対応しています。また、創傷治癒や組織修復だけでなく、肝機能の調節における重要性の高まりも、製品需要に有利であることを証明します。
用途別では、医薬品セグメントの分岐鎖アミノ酸市場規模は、2032年まで6.4%の成長率で拡大すると予想されています。これは、通常の食事から十分なタンパク質を摂取することが課題となっている患者に栄養サポートを提供するため、医薬品製剤への配合が増加しているためと考えられます。がんや慢性閉塞性肺疾患(COPD)などの慢性疾患の負担が増加する中、筋肉量を維持するためのタンパク質合成において、BCAA、特にロイシンの需要が増加しています。
地域的には、欧州のBCAA産業規模は、スポーツ栄養への強い焦点とともに、健康とフィットネスへの意識の高まりにより、2023年から2032年にかけて5.8%のCAGRを獲得すると予測されています。
植物性製品の台頭による植物性食生活の人気の高まりが、エンドウ豆、大豆、その他の植物性タンパク質を原料とする植物性BCAAの需要増加を後押ししています。複数のeコマース・プラットフォームにおける利便性と幅広い製品選択肢へのアクセスのしやすさも、この地域の製品普及に貢献すると思われます。
目次
第1章 調査手法と調査範囲
第2章 エグゼクティブサマリー
第3章 分岐鎖アミノ酸(BCAA)業界洞察
- エコシステム分析
- 業界への影響要因
- 促進要因
- 業界の潜在的リスク&課題
- 成長ポテンシャル分析
- COVID-19影響分析
- 規制状況
- 米国
- 欧州
- 価格分析、2022年
- 技術展望
- 今後の市場動向
- ポーター分析
- PESTEL分析
- ロシア・ウクライナ戦争が業界に与える影響
第4章 競合情勢
- イントロダクション
- 企業マトリックス分析
- 世界企業シェア分析
- 競合のポジショニング・マトリックス
- 戦略ダッシュボード
第5章 分岐鎖アミノ酸(BCAA)市場規模・予測:タイプ別2018年~2032年
- 分岐鎖アミノ酸(BCAA)市場動向:タイプ別
- L-ロイシン
- L-イソロイシン
- L-バリン
第6章 分岐鎖アミノ酸(BCAA)市場規模・予測:用途別2018年~2032年
- 分岐鎖アミノ酸(BCAA)市場動向:用途別
- スポーツ栄養およびフィットネス
- 飲食品
- 動物飼料
- 医薬品
- 化粧品・パーソナルケア
第7章 分岐鎖アミノ酸(BCAA)市場規模・予測:形態別2018~2032年
- 分岐鎖アミノ酸(BCAA)市場動向:形態別
- 粉末
- カプセル
- 錠剤
- 液体
第8章 分岐鎖アミノ酸(BCAA)市場規模・予測:2018年~2032年地域別
- 主要動向:地域別
- 北米
- 米国
- カナダ
- 欧州
- ドイツ
- 英国
- フランス
- スペイン
- イタリア
- アジア太平洋
- 日本
- 中国
- インド
- オーストラリア
- 韓国
- インドネシア
- マレーシア
- ラテンアメリカ
- ブラジル
- メキシコ
- アルゼンチン
- 中東・アフリカ
- 南アフリカ
- サウジアラビア
- アラブ首長国連邦
- エジプト
第9章 企業プロファイル
- Ajinomoto
- Kyowa Hakko Bio
- Evonik
- BASF
- Toray Industries
- DSM
- Kerry Group
- Glanbia
- Archer Daniels Midland(ADM)
- Cargill
- Tate & Lyle
- Glanbia Nutritionals
- NOW Foods
- Optimum Nutrition
- MuscleTech
Data Tables
- TABLE 1. Market revenue, by type (2022)
- TABLE 2. Marker revenue, by application (2022)
- TABLE 3. Market revenue, by form (2022)
- TABLE 4. Market revenue, by region (2022)
- TABLE 5. Global Branched chain amino acids (BCAAs) market size, 2018 - 2032, (USD Million)
- TABLE 6. Global Branched chain amino acids (BCAAs) market size, 2018 - 2032, (Kilo Tons)
- TABLE 7. Global Branched chain amino acids (BCAAs) market size, by region, 2018-2032 (USD Million)
- TABLE 8. Global Branched chain amino acids (BCAAs) market size, by region, 2018-2032 (Kilo Tons)
- TABLE 9. Global Branched chain amino acids (BCAAs) market size, by type, 2018-2032 (USD Million)
- TABLE 10. Global Branched chain amino acids (BCAAs) market size, by type, 2018-2032 (Kilo Tons)
- TABLE 11. Global Branched chain amino acids (BCAAs) market size, by form, 2018-2032 (USD Million)
- TABLE 12. Global Branched chain amino acids (BCAAs) market size, by form, 2018-2032 (Kilo Tons)
- TABLE 13. Global Branched chain amino acids (BCAAs) market size, by applications, 2018-2032 (USD Million)
- TABLE 14. Global Branched chain amino acids (BCAAs) market size, by applications, 2018-2032 (Kilo Tons)
- TABLE 15. Industry impact forces
- TABLE 16. North America Branched chain amino acids (BCAAs) market size, by country, 2018-2032 (USD Million)
- TABLE 17. North America Branched chain amino acids (BCAAs) market size, by country, 2018-2032 (Kilo Tons)
- TABLE 18. North America Branched chain amino acids (BCAAs) market size, by type, 2018-2032 (USD Million)
- TABLE 19. North America Branched chain amino acids (BCAAs) market size, by type, 2018-2032 (Kilo Tons)
- TABLE 20. North America Branched chain amino acids (BCAAs) market size, by form, 2018-2032 (USD Million)
- TABLE 21. North America Branched chain amino acids (BCAAs) market size, by form, 2018-2032 (Kilo Tons)
- TABLE 22. North America Branched chain amino acids (BCAAs) market size, by applications, 2018-2032 (USD Million)
- TABLE 23. North America Branched chain amino acids (BCAAs) market size, by applications, 2018-2032 (Kilo Tons)
- TABLE 24. U.S. Branched chain amino acids (BCAAs) market size, by type, 2018-2032 (USD Million)
- TABLE 25. U.S. Branched chain amino acids (BCAAs) market size, by type, 2018-2032 (Kilo Tons)
- TABLE 26. U.S. Branched chain amino acids (BCAAs) market size, by form, 2018-2032 (USD Million)
- TABLE 27. U.S. Branched chain amino acids (BCAAs) market size, by form, 2018-2032 (Kilo Tons)
- TABLE 28. U.S. Branched chain amino acids (BCAAs) market size, by applications, 2018-2032 (USD Million)
- TABLE 29. U.S. Branched chain amino acids (BCAAs) market size, by applications, 2018-2032 (Kilo Tons)
- TABLE 30. Canada Branched chain amino acids (BCAAs) market size, by type, 2018-2032 (USD Million)
- TABLE 31. Canada Branched chain amino acids (BCAAs) market size, by type, 2018-2032 (Kilo Tons)
- TABLE 32. Canada Branched chain amino acids (BCAAs) market size, by form, 2018-2032 (USD Million)
- TABLE 33. Canada Branched chain amino acids (BCAAs) market size, by form, 2018-2032 (Kilo Tons)
- TABLE 34. Canada Branched chain amino acids (BCAAs) market size, by applications, 2018-2032 (USD Million)
- TABLE 35. Canada Branched chain amino acids (BCAAs) market size, by applications, 2018-2032 (Kilo Tons)
- TABLE 36. Europe Branched chain amino acids (BCAAs) market size, by country, 2018-2032 (USD Million)
- TABLE 37. Europe Branched chain amino acids (BCAAs) market size, by country, 2018-2032 (Kilo Tons)
- TABLE 38. Europe Branched chain amino acids (BCAAs) market size, by type, 2018-2032 (USD Million)
- TABLE 39. Europe Branched chain amino acids (BCAAs) market size, by type, 2018-2032 (Kilo Tons)
- TABLE 40. Europe Branched chain amino acids (BCAAs) market size, by form, 2018-2032 (USD Million)
- TABLE 41. Europe Branched chain amino acids (BCAAs) market size, by form, 2018-2032 (Kilo Tons)
- TABLE 42. Europe Branched chain amino acids (BCAAs) market size, by applications, 2018-2032 (USD Million)
- TABLE 43. Europe Branched chain amino acids (BCAAs) market size, by applications, 2018-2032 (Kilo Tons)
- TABLE 44. Germany Branched chain amino acids (BCAAs) market size, by type, 2018-2032 (USD Million)
- TABLE 45. Germany Branched chain amino acids (BCAAs) market size, by type, 2018-2032 (Kilo Tons)
- TABLE 46. Germany Branched chain amino acids (BCAAs) market size, by form, 2018-2032 (USD Million)
- TABLE 47. Germany Branched chain amino acids (BCAAs) market size, by form, 2018-2032 (Kilo Tons)
- TABLE 48. Germany Branched chain amino acids (BCAAs) market size, by applications, 2018-2032 (USD Million)
- TABLE 49. Germany Branched chain amino acids (BCAAs) market size, by applications, 2018-2032 (Kilo Tons)
- TABLE 50. UK Branched chain amino acids (BCAAs) market size, by type, 2018-2032 (USD Million)
- TABLE 51. UK Branched chain amino acids (BCAAs) market size, by type, 2018-2032 (Kilo Tons)
- TABLE 52. UK Branched chain amino acids (BCAAs) market size, by form, 2018-2032 (USD Million)
- TABLE 53. UK Branched chain amino acids (BCAAs) market size, by form, 2018-2032 (Kilo Tons)
- TABLE 54. UK Branched chain amino acids (BCAAs) market size, by applications, 2018-2032 (USD Million)
- TABLE 55. UK Branched chain amino acids (BCAAs) market size, by applications, 2018-2032 (Kilo Tons)
- TABLE 56. France Branched chain amino acids (BCAAs) market size, by type, 2018-2032 (USD Million)
- TABLE 57. France Branched chain amino acids (BCAAs) market size, by type, 2018-2032 (Kilo Tons)
- TABLE 58. France Branched chain amino acids (BCAAs) market size, by form, 2018-2032 (USD Million)
- TABLE 59. France Branched chain amino acids (BCAAs) market size, by form, 2018-2032 (Kilo Tons)
- TABLE 60. France Branched chain amino acids (BCAAs) market size, by applications, 2018-2032 (USD Million)
- TABLE 61. France Branched chain amino acids (BCAAs) market size, by applications, 2018-2032 (Kilo Tons)
- TABLE 62. Spain Branched chain amino acids (BCAAs) market size, by type, 2018-2032 (USD Million)
- TABLE 63. Spain Branched chain amino acids (BCAAs) market size, by type, 2018-2032 (Kilo Tons)
- TABLE 64. Spain Branched chain amino acids (BCAAs) market size, by form, 2018-2032 (USD Million)
- TABLE 65. Spain Branched chain amino acids (BCAAs) market size, by form, 2018-2032 (Kilo Tons)
- TABLE 66. Spain Branched chain amino acids (BCAAs) market size, by applications, 2018-2032 (USD Million)
- TABLE 67. Spain Branched chain amino acids (BCAAs) market size, by applications, 2018-2032 (Kilo Tons)
- TABLE 68. Italy Branched chain amino acids (BCAAs) market size, by type, 2018-2032 (USD Million)
- TABLE 69. Italy Branched chain amino acids (BCAAs) market size, by type, 2018-2032 (Kilo Tons)
- TABLE 70. Italy Branched chain amino acids (BCAAs) market size, by form, 2018-2032 (USD Million)
- TABLE 71. Italy Branched chain amino acids (BCAAs) market size, by form, 2018-2032 (Kilo Tons)
- TABLE 72. Italy Branched chain amino acids (BCAAs) market size, by applications, 2018-2032 (USD Million)
- TABLE 73. Italy Branched chain amino acids (BCAAs) market size, by applications, 2018-2032 (Kilo Tons)
- TABLE 74. Asia Pacific Branched chain amino acids (BCAAs) market size, by country, 2018-2032 (USD Million)
- TABLE 75. Asia Pacific Branched chain amino acids (BCAAs) market size, by country, 2018-2032 (Kilo Tons)
- TABLE 76. Asia Pacific Branched chain amino acids (BCAAs) market size, by type, 2018-2032 (USD Million)
- TABLE 77. Asia Pacific Branched chain amino acids (BCAAs) market size, by type, 2018-2032 (Kilo Tons)
- TABLE 78. Asia Pacific Branched chain amino acids (BCAAs) market size, by form, 2018-2032 (USD Million)
- TABLE 79. Asia Pacific Branched chain amino acids (BCAAs) market size, by form, 2018-2032 (Kilo Tons)
- TABLE 80. Asia Pacific Branched chain amino acids (BCAAs) market size, by applications, 2018-2032 (USD Million)
- TABLE 81. Asia Pacific Branched chain amino acids (BCAAs) market size, by applications, 2018-2032 (Kilo Tons)
- TABLE 82. China Branched chain amino acids (BCAAs) market size, by type, 2018-2032 (USD Million)
- TABLE 83. China Branched chain amino acids (BCAAs) market size, by type, 2018-2032 (Kilo Tons)
- TABLE 84. China Branched chain amino acids (BCAAs) market size, by form, 2018-2032 (USD Million)
- TABLE 85. China Branched chain amino acids (BCAAs) market size, by form, 2018-2032 (Kilo Tons)
- TABLE 86. China Branched chain amino acids (BCAAs) market size, by applications, 2018-2032 (USD Million)
- TABLE 87. China Branched chain amino acids (BCAAs) market size, by applications, 2018-2032 (Kilo Tons)
- TABLE 88. Japan Branched chain amino acids (BCAAs) market size, by type, 2018-2032 (USD Million)
- TABLE 89. Japan Branched chain amino acids (BCAAs) market size, by type, 2018-2032 (Kilo Tons)
- TABLE 90. Japan Branched chain amino acids (BCAAs) market size, by form, 2018-2032 (USD Million)
- TABLE 91. Japan Branched chain amino acids (BCAAs) market size, by form, 2018-2032 (Kilo Tons)
- TABLE 92. Japan Branched chain amino acids (BCAAs) market size, by applications, 2018-2032 (USD Million)
- TABLE 93. Japan Branched chain amino acids (BCAAs) market size, by applications, 2018-2032 (Kilo Tons)
- TABLE 94. India Branched chain amino acids (BCAAs) market size, by type, 2018-2032 (USD Million)
- TABLE 95. India Branched chain amino acids (BCAAs) market size, by type, 2018-2032 (Kilo Tons)
- TABLE 96. India Branched chain amino acids (BCAAs) market size, by form, 2018-2032 (USD Million)
- TABLE 97. India Branched chain amino acids (BCAAs) market size, by form, 2018-2032 (Kilo Tons)
- TABLE 98. India Branched chain amino acids (BCAAs) market size, by applications, 2018-2032 (USD Million)
- TABLE 99. India Branched chain amino acids (BCAAs) market size, by applications, 2018-2032 (Kilo Tons)
- TABLE 100. Australia Branched chain amino acids (BCAAs) market size, by type, 2018-2032 (USD Million)
- TABLE 101. Australia Branched chain amino acids (BCAAs) market size, by type, 2018-2032 (Kilo Tons)
- TABLE 102. Australia Branched chain amino acids (BCAAs) market size, by form, 2018-2032 (USD Million)
- TABLE 103. Australia Branched chain amino acids (BCAAs) market size, by form, 2018-2032 (Kilo Tons)
- TABLE 104. Australia Branched chain amino acids (BCAAs) market size, by applications, 2018-2032 (USD Million)
- TABLE 105. Australia Branched chain amino acids (BCAAs) market size, by applications, 2018-2032 (Kilo Tons)
- TABLE 106. South Korea Branched chain amino acids (BCAAs) market size, by type, 2018-2032 (USD Million)
- TABLE 107. South Korea Branched chain amino acids (BCAAs) market size, by type, 2018-2032 (Kilo Tons)
- TABLE 108. South Korea Branched chain amino acids (BCAAs) market size, by form, 2018-2032 (USD Million)
- TABLE 109. South Korea Branched chain amino acids (BCAAs) market size, by form, 2018-2032 (Kilo Tons)
- TABLE 110. South Korea Branched chain amino acids (BCAAs) market size, by applications, 2018-2032 (USD Million)
- TABLE 111. South Korea Branched chain amino acids (BCAAs) market size, by applications, 2018-2032 (Kilo Tons)
- TABLE 112. Indonesia Branched chain amino acids (BCAAs) market size, by type, 2018-2032 (USD Million)
- TABLE 113. Indonesia Branched chain amino acids (BCAAs) market size, by type, 2018-2032 (Kilo Tons)
- TABLE 114. Indonesia Branched chain amino acids (BCAAs) market size, by form, 2018-2032 (USD Million)
- TABLE 115. Indonesia Branched chain amino acids (BCAAs) market size, by form, 2018-2032 (Kilo Tons)
- TABLE 116. Indonesia Branched chain amino acids (BCAAs) market size, by applications, 2018-2032 (USD Million)
- TABLE 117. Indonesia Branched chain amino acids (BCAAs) market size, by applications, 2018-2032 (Kilo Tons)
- TABLE 118. Malaysia Branched chain amino acids (BCAAs) market size, by type, 2018-2032 (USD Million)
- TABLE 119. Malaysia Branched chain amino acids (BCAAs) market size, by type, 2018-2032 (Kilo Tons)
- TABLE 120. Malaysia Branched chain amino acids (BCAAs) market size, by form, 2018-2032 (USD Million)
- TABLE 121. Malaysia Branched chain amino acids (BCAAs) market size, by form, 2018-2032 (Kilo Tons)
- TABLE 122. Malaysia Branched chain amino acids (BCAAs) market size, by applications, 2018-2032 (USD Million)
- TABLE 123. Malaysia Branched chain amino acids (BCAAs) market size, by applications, 2018-2032 (Kilo Tons)
- TABLE 124. Latin America Branched chain amino acids (BCAAs) market size, by country, 2018-2032 (USD Million)
- TABLE 125. Latin America Branched chain amino acids (BCAAs) market size, by country, 2018-2032 (Kilo Tons)
- TABLE 126. Latin America Branched chain amino acids (BCAAs) market size, by type, 2018-2032 (USD Million)
- TABLE 127. Latin America Branched chain amino acids (BCAAs) market size, by type, 2018-2032 (Kilo Tons)
- TABLE 128. Latin America Branched chain amino acids (BCAAs) market size, by form, 2018-2032 (USD Million)
- TABLE 129. Latin America Branched chain amino acids (BCAAs) market size, by form, 2018-2032 (Kilo Tons)
- TABLE 130. Latin America Branched chain amino acids (BCAAs) market size, by applications, 2018-2032 (USD Million)
- TABLE 131. Latin America Branched chain amino acids (BCAAs) market size, by applications, 2018-2032 (Kilo Tons)
- TABLE 132. Brazil Branched chain amino acids (BCAAs) market size, by type, 2018-2032 (USD Million)
- TABLE 133. Brazil Branched chain amino acids (BCAAs) market size, by type, 2018-2032 (Kilo Tons)
- TABLE 134. Brazil Branched chain amino acids (BCAAs) market size, by form, 2018-2032 (USD Million)
- TABLE 135. Brazil Branched chain amino acids (BCAAs) market size, by form, 2018-2032 (Kilo Tons)
- TABLE 136. Brazil Branched chain amino acids (BCAAs) market size, by applications, 2018-2032 (USD Million)
- TABLE 137. Brazil Branched chain amino acids (BCAAs) market size, by applications, 2018-2032 (Kilo Tons)
- TABLE 138. Mexico Branched chain amino acids (BCAAs) market size, by type, 2018-2032 (USD Million)
- TABLE 139. Mexico Branched chain amino acids (BCAAs) market size, by type, 2018-2032 (Kilo Tons)
- TABLE 140. Mexico Branched chain amino acids (BCAAs) market size, by form, 2018-2032 (USD Million)
- TABLE 141. Mexico Branched chain amino acids (BCAAs) market size, by form, 2018-2032 (Kilo Tons)
- TABLE 142. Mexico Branched chain amino acids (BCAAs) market size, by applications, 2018-2032 (USD Million)
- TABLE 143. Mexico Branched chain amino acids (BCAAs) market size, by applications, 2018-2032 (Kilo Tons)
- TABLE 144. Argentina Branched chain amino acids (BCAAs) market size, by type, 2018-2032 (USD Million)
- TABLE 145. Argentina Branched chain amino acids (BCAAs) market size, by type, 2018-2032 (Kilo Tons)
- TABLE 146. Argentina Branched chain amino acids (BCAAs) market size, by form, 2018-2032 (USD Million)
- TABLE 147. Argentina Branched chain amino acids (BCAAs) market size, by form, 2018-2032 (Kilo Tons)
- TABLE 148. Argentina Branched chain amino acids (BCAAs) market size, by applications, 2018-2032 (USD Million)
- TABLE 149. Argentina Branched chain amino acids (BCAAs) market size, by applications, 2018-2032 (Kilo Tons)
- TABLE 150. MEA Branched chain amino acids (BCAAs) market size, by country, 2018-2032 (USD Million)
- TABLE 151. MEA Branched chain amino acids (BCAAs) market size, by country, 2018-2032 (Kilo Tons)
- TABLE 152. MEA Branched chain amino acids (BCAAs) market size, by type, 2018-2032 (USD Million)
- TABLE 153. MEA Branched chain amino acids (BCAAs) market size, by type, 2018-2032 (Kilo Tons)
- TABLE 154. MEA Branched chain amino acids (BCAAs) market size, by form, 2018-2032 (USD Million)
- TABLE 155. MEA Branched chain amino acids (BCAAs) market size, by form, 2018-2032 (Kilo Tons)
- TABLE 156. MEA Branched chain amino acids (BCAAs) market size, by applications, 2018-2032 (USD Million)
- TABLE 157. MEA Branched chain amino acids (BCAAs) market size, by applications, 2018-2032 (Kilo Tons)
- TABLE 158. South Africa Branched chain amino acids (BCAAs) market size, by type, 2018-2032 (USD Million)
- TABLE 159. South Africa Branched chain amino acids (BCAAs) market size, by type, 2018-2032 (Kilo Tons)
- TABLE 160. South Africa Branched chain amino acids (BCAAs) market size, by form, 2018-2032 (USD Million)
- TABLE 161. South Africa Branched chain amino acids (BCAAs) market size, by form, 2018-2032 (Kilo Tons)
- TABLE 162. South Africa Branched chain amino acids (BCAAs) market size, by applications, 2018-2032 (USD Million)
- TABLE 163. South Africa Branched chain amino acids (BCAAs) market size, by applications, 2018-2032 (Kilo Tons)
- TABLE 164. Saudi Arabia Branched chain amino acids (BCAAs) market size, by type, 2018-2032 (USD Million)
- TABLE 165. Saudi Arabia Branched chain amino acids (BCAAs) market size, by type, 2018-2032 (Kilo Tons)
- TABLE 166. Saudi Arabia Branched chain amino acids (BCAAs) market size, by form, 2018-2032 (USD Million)
- TABLE 167. Saudi Arabia Branched chain amino acids (BCAAs) market size, by form, 2018-2032 (Kilo Tons)
- TABLE 168. Saudi Arabia Branched chain amino acids (BCAAs) market size, by applications, 2018-2032 (USD Million)
- TABLE 169. Saudi Arabia Branched chain amino acids (BCAAs) market size, by applications, 2018-2032 (Kilo Tons)
- TABLE 170. UAE Branched chain amino acids (BCAAs) market size, by type, 2018-2032 (USD Million)
- TABLE 171. UAE Branched chain amino acids (BCAAs) market size, by type, 2018-2032 (Kilo Tons)
- TABLE 172. UAE Branched chain amino acids (BCAAs) market size, by form, 2018-2032 (USD Million)
- TABLE 173. UAE Branched chain amino acids (BCAAs) market size, by form, 2018-2032 (Kilo Tons)
- TABLE 174. UAE Branched chain amino acids (BCAAs) market size, by applications, 2018-2032 (USD Million)
- TABLE 175. UAE Branched chain amino acids (BCAAs) market size, by applications, 2018-2032 (Kilo Tons)
- TABLE 176. Egypt Branched chain amino acids (BCAAs) market size, by type, 2018-2032 (USD Million)
- TABLE 177. Egypt Branched chain amino acids (BCAAs) market size, by type, 2018-2032 (Kilo Tons)
- TABLE 178. Egypt Branched chain amino acids (BCAAs) market size, by form, 2018-2032 (USD Million)
- TABLE 179. Egypt Branched chain amino acids (BCAAs) market size, by form, 2018-2032 (Kilo Tons)
- TABLE 180. Egypt Branched chain amino acids (BCAAs) market size, by applications, 2018-2032 (USD Million)
- TABLE 181. Egypt Branched chain amino acids (BCAAs) market size, by applications, 2018-2032 (Kilo Tons)
Charts & Figures
- FIG. 1 Industry segmentation
- FIG. 2 Market estimation and forecast methodology
- FIG. 3 Breakdown of primary participants
- FIG. 4 Branched chain amino acids (BCAAs) industry, 360 degree synopsis, 2018 - 2032
- FIG. 5 Industry landscape, 2018-2032 (USD Million)
- FIG. 6 Growth potential analysis
- FIG. 7 Porter's analysis
- FIG. 8 PESTEL analysis
- FIG. 9 Company matrix analysis, 2022
Global Branched Chain Amino Acids (BCAAs) Market size is poised to record 5.8% CAGR from 2023-2032, due to the growing dominance of e-commerce channels to render ease of access to wide range of products online.
To match the diverse preferences and enhance the overall experiences of consumers, several BCAA providers are focusing on innovations for introducing new formulations and flavors. The robust emphasis on introducing new delivery formats, such as powders, capsules, and drinks will also compliment the market growth. To cite an instance, in October 2021, the U.K.-based fast-growing sports nutrition brand Applied Nutrition introduced a new line of its BCAA amino-hydrate drinks in a 330ml carbonated can for expanding its On-the-go range.
The overall BCAAs industry is segmented based on type, form, application, and region.
In terms of type, the market size from the L-valine segment may observe 6.3% CAGR from 2023-2032. L-valine is naturally found in several protein-rich foods, such as meat, dairy products, and legumes. To that end, it is widely used as a dietary supplement in combination with other BCAAs to cater to individuals with increased protein needs and specific fitness goals. Rising importance in the regulation of liver function as well as wound healing and tissue repair will also prove favorable for the product demand.
On the basis of application, the branched chain amino acids market size from the pharmaceuticals segment is expected to expand at 6.4% growth rate up to 2032. This can be ascribed to the rising inclusion in pharmaceutical formulations to provide nutritional support for patients facing challenges in consuming adequate protein through regular dietary intake. With the growing burden of chronic illnesses, such as cancer and chronic obstructive pulmonary disease (COPD), the demand for BCAAs, especially leucine is increasing in protein synthesis to help preserve muscle mass.
Regionally, the Europe BCAAs industry size is projected to accrue 5.8% CAGR from 2023 to 2032 due to the increasing awareness of health and fitness along with the strong focus on sports nutrition.
The growing popularity of plant-based diets driven by the emerging trend of plant-based products is pushing the increasing demand for plant-based BCAAs sourced from peas, soy and other plant proteins. The ease of access to convenience and wide range of product choices in multiple e-commerce platforms will also contribute to the regional product uptake.
Table of Contents
Chapter 1 Methodology & Scope
- 1.1 Industry coverage
- 1.2 Market scope & definition
- 1.3 Base estimates & calculations
- 1.3.1 Data collection
- 1.4 Forecast parameters
- 1.5 COVID-19 impact analysis at global level
- 1.6 Data validation
- 1.7 Data Sources
- 1.7.1 Primary
- 1.7.2 Secondary
- 1.7.2.1 Paid sources
- 1.7.2.2 Unpaid sources
Chapter 2 Executive Summary
- 2.1 Branched chain amino acids (BCAAs) industry 360 degree synopsis, 2018 - 2032
- 2.2 Business trends
- 2.3 Type trends
- 2.4 Form trends
- 2.5 Application trends
- 2.6 Regional trends
Chapter 3 Branched chain amino acids (BCAAs) Industry Insights
- 3.1 Industry ecosystem analysis
- 3.2 Industry impact forces
- 3.2.1 Growth drivers
- 3.2.2 Industry pitfalls & challenges
- 3.3 Growth potential analysis
- 3.4 COVID- 19 impact analysis
- 3.5 Regulatory landscape
- 3.5.1 U.S.
- 3.5.2 Europe
- 3.6 Pricing analysis, 2022
- 3.7 Technology landscape
- 3.7.1 Future market trends
- 3.8 Porter's analysis
- 3.9 PESTEL analysis
- 3.10 Russia-Ukraine War Impact on the industry
Chapter 4 Competitive Landscape, 2022
- 4.1 Introduction
- 4.2 Company matrix analysis, 2022
- 4.3 Global company market share analysis, 2022
- 4.4 Competitive positioning matrix
- 4.5 Strategy dashboard
Chapter 5 Branched chain amino acids (BCAAs) Market Size and Forecast, By Type 2018 - 2032
- 5.1 Branched chain amino acids (BCAAs) Market Trends, By type
- 5.2 L-Leucine
- 5.3 L-Isoleucine
- 5.4 L-Valine
Chapter 6 Branched chain amino acids (BCAAs) Market Size and Forecast, By Application 2018 - 2032
- 6.1 Branched chain amino acids (BCAAs) Market Trends, By application
- 6.2 Sports nutrition and fitness
- 6.3 Food and beverage
- 6.4 Animal feed
- 6.5 Pharmaceuticals
- 6.6 Cosmetics and personal care
Chapter 7 Branched chain amino acids (BCAAs) Market Size and Forecast, By Form 2018 - 2032
- 7.1 Branched chain amino acids (BCAAs) Market Trends, By form
- 7.2 Powder
- 7.3 Capsule
- 7.4 Tablet
- 7.5 Liquid
Chapter 8 Branched chain amino acids (BCAAs) Market Size and Forecast, By Region 2018 - 2032
- 8.1 Key trends, by region
- 8.2 North America
- 8.2.1 U.S.
- 8.2.2 Canada
- 8.3 Europe
- 8.3.1 Germany
- 8.3.2 UK
- 8.3.3 France
- 8.3.4 Spain
- 8.3.5 Italy
- 8.4 Asia Pacific
- 8.4.1 Japan
- 8.4.2 China
- 8.4.3 India
- 8.4.4 Australia
- 8.4.5 South Korea
- 8.4.6 Indonesia
- 8.4.7 Malaysia
- 8.5 Latin America
- 8.5.1 Brazil
- 8.5.2 Mexico
- 8.5.3 Argentina
- 8.6 MEA
- 8.6.1 South Africa
- 8.6.2 Saudi Arabia
- 8.6.3 UAE
- 8.6.4 Egypt
Chapter 9 Company Profiles
- 9.1 Ajinomoto
- 9.2 Kyowa Hakko Bio
- 9.3 Evonik
- 9.4 BASF
- 9.5 Toray Industries
- 9.6 DSM
- 9.7 Kerry Group
- 9.8 Glanbia
- 9.9 Archer Daniels Midland (ADM)
- 9.10 Cargill
- 9.11 Tate & Lyle
- 9.12 Glanbia Nutritionals
- 9.13 NOW Foods
- 9.14 Optimum Nutrition
- 9.15 MuscleTech
