
|
市場調査レポート
商品コード
1844316
スマート農業の市場機会、成長促進要因、産業動向分析、2025~2034年予測Smart Agriculture Market Opportunity, Growth Drivers, Industry Trend Analysis, and Forecast 2025 - 2034 |
||||||
カスタマイズ可能
|
|||||||
| スマート農業の市場機会、成長促進要因、産業動向分析、2025~2034年予測 |
|
出版日: 2025年09月22日
発行: Global Market Insights Inc.
ページ情報: 英文 180 Pages
納期: 2~3営業日
|

概要
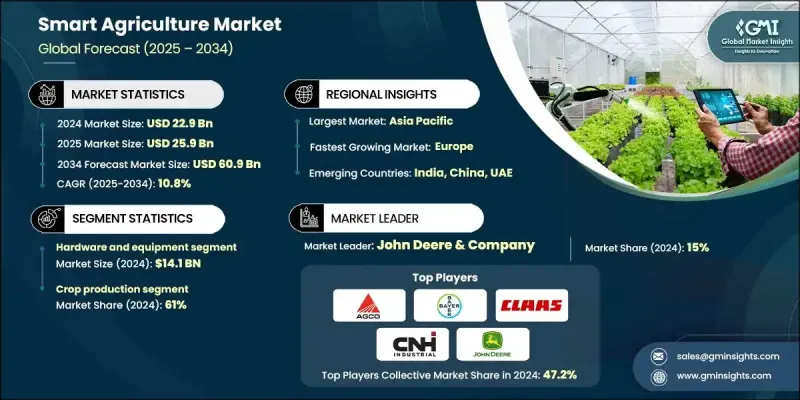
世界のスマート農業市場は、2024年に229億米ドルと評価され、CAGR 10.8%で成長し、2034年には609億米ドルに達すると推定されています。
急速な人口増加、農業従事者の労働力不足、深刻化する気候問題による食糧需要の増加が、テクノロジー主導型農業へのシフトに拍車をかけています。政府や業界のリーダーたちは、農業の効率を改善し、回復力を高め、長期的な持続可能性を促進するための的を絞った戦略で対応しています。世界の食糧需要は2050年までに60%増加すると予測されており、革新的なデジタル・ツールや自動化を用いて生産性を向上させる必要性が高まっています。スマート農業は、不規則な降雨、気温の上昇、自然災害の増加など、収量や食の安全を脅かす気候関連の混乱に対処する上で中心的な存在になりつつあります。その結果、農作業のデジタル化は急速に勢いを増しており、官民を超えた資金提供や戦略的パートナーシップに支えられています。この変革の主な実現要因は精密農業であり、リアルタイムのデータと自動化を活用してインプットとアウトプットを最適化し、資源の浪費を削減し、地域全体の食糧安全保障を強化します。
| 市場範囲 | |
|---|---|
| 開始年 | 2024 |
| 予測年 | 2025-2034 |
| 市場規模 | 229億米ドル |
| 予測金額 | 609億米ドル |
| CAGR | 10.8% |
ハードウェアと機器の分野は、2024年に141億米ドルを生み出し、2034年までのCAGRは10.9%と予測されます。この分野は、最新の農場がセンサー、ロボット工学、AIを搭載したコネクテッド機器を採用するにつれて牽引力を増し続けています。先進的な機械と自律システムにより、農業生産者は、より正確で手作業の少ない方法で、収量を向上させ、圃場の状態を監視することが容易になっています。
作物生産分野は2024年に61%のシェアを占め、2025年から2034年にかけてCAGR 10.6%で成長すると予想されています。リモートセンシング、精密灌漑、リアルタイムの土壌モニタリングなどのデジタルツールの統合は、作物の栽培、管理、収穫方法を変革しています。スマート・ソリューションは、高度なモニタリングとデータ分析を通じて、投入物の最適化、無駄の削減、より健全な収量の確保を実現し、生産性を高めています。
米国スマート農業市場は2024年に76%のシェアを占め、46億米ドルを創出しました。この地域の成長は、持続可能な農業慣行の改善を目指した連邦政府の積極的な支援によって促進されています。2024年だけでも、農家が数百万エーカーの土地で環境に優しい戦略を実施するのを支援するために、数十億米ドルの資金が割り当てられました。こうした取り組みにより、保全、土壌の健全性、気候への適応を支援する技術の導入が促進されています。
世界のスマート農業市場で活躍する主要企業には、Bayer、CNH Industrial、Mahindra &Mahindra、Kubota、Trimble、Taranis、CLAAS Group、Monarch Tractor、Prospera Technologies、Topcon、John Deere &Company、AGCO、Yara International、Farmers Edge、Carbon Roboticsなどがあります。主要企業は、自動化、AI、IoTに多額の投資を行い、精度を高め、運用コストを削減する統合農業ソリューションを提供しています。戦略的買収やアグリテック新興企業との提携により、技術的能力を拡大し、リアルタイムの意思決定のためのデータ主導型プラットフォームを提供しています。これらの企業はまた、新興市場での採用を促進するために、地域政府や協同組合とのパートナーシップを構築しています。多くの企業は、大規模な商業農場と小規模な農業生産者の両方にアピールするため、拡張可能なモジュール式機器に注力しています。
目次
第1章 調査手法と範囲
第2章 エグゼクティブサマリー
第3章 業界考察
- エコシステム分析
- サプライヤーの情勢
- 利益率
- 各段階での付加価値
- バリューチェーンに影響を与える要因
- 業界への影響要因
- 促進要因
- 世界の食糧需要の増加と人口増加
- 労働力不足と自動化の必要性
- 気候変動適応要件
- 業界の潜在的リスク&課題
- 初期投資と導入コストが高め
- 限られた農村地域の接続インフラ
- 投資収益率の不確実性
- 機会
- 炭素クレジットと環境サービス市場
- AIと機械学習の統合
- 自律農業システムの開発
- 促進要因
- 成長可能性分析
- 将来の市場動向
- テクノロジーとイノベーションの情勢
- 現在の技術動向
- 新興技術
- 価格動向
- 地域別
- 製品タイプ別
- 規制情勢
- 標準とコンプライアンス要件
- 地域規制枠組み
- 認証基準
- 貿易統計
- 主要輸入国
- 主要輸出国
- ポーターの分析
- PESTEL分析
第4章 競合情勢
- イントロダクション
- 企業の市場シェア分析
- 地域別
- 企業マトリックス分析
- 主要市場企業の競合分析
- 競合ポジショニングマトリックス
- 主な発展
- 合併と買収
- パートナーシップとコラボレーション
- 新製品の発売
- 拡張計画
第5章 市場推計・予測:製品タイプ別、2021-2034
- 主要動向
- ハードウェアと機器
- GNSS誘導および操舵システム
- IoTセンサーと監視デバイス
- 自律型およびロボットシステム
- 精密塗布装置
- ソフトウェアとデジタルプラットフォーム
- 農場管理情報システム(FMIS)
- 意思決定支援システム
- サプライチェーンとトレーサビリティプラットフォーム
- サービスと接続
- 接続ソリューション
- クラウドコンピューティングとデータ分析
- 専門サービス
第6章 市場推計・予測:用途別、2021-2034
- 主要動向
- 作物生産
- 精密な植え付けと播種
- 栄養管理
- 農作物保護
- 灌漑管理
- 家畜管理
- 動物の健康モニタリング
- 自動給餌システム
- 繁殖と繁殖管理
- 収穫後およびサプライチェーン
- 収量監視と分析
- 保管と取り扱いの最適化
- トレーサビリティとコンプライアンス
第7章 市場推計・予測:地域別、2021-2034
- 主要動向
- 北米
- 米国
- カナダ
- 欧州
- ドイツ
- 英国
- フランス
- スペイン
- イタリア
- オランダ
- アジア太平洋地域
- 中国
- 日本
- インド
- オーストラリア
- 韓国
- ラテンアメリカ
- ブラジル
- メキシコ
- アルゼンチン
- 中東・アフリカ
- 南アフリカ
- サウジアラビア
- アラブ首長国連邦
第8章 企業プロファイル
- AGCO
- Bayer
- Carbon Robotics
- CLAAS Group
- CNH Industrial
- Farmers Edge
- John Deere &Company
- Kubota
- Mahindra &Mahindra
- Monarch Tractor
- Prospera Technologies
- Taranis
- Topcon
- Trimble
- Yara International

