|
|
市場調査レポート
商品コード
1388269
粒子状物質モニタリング市場:モニタリングタイプ別、粒子径別、用途別、最終用途産業別・予測、 2023年~2032年Particulate Matter Monitoring Market - By Monitoring Type (Manual, Real-time, Remote), By Particle Size, By Application (Indoor Air Quality Monitoring, Outdoor Air Quality Monitoring), By End-use Industry & Forecast, 2023 - 2032 |
||||||
|
|
|||||||
カスタマイズ可能
|
|||||||


| 粒子状物質モニタリング市場:モニタリングタイプ別、粒子径別、用途別、最終用途産業別・予測、 2023年~2032年 |
|
出版日: 2023年10月20日
発行: Global Market Insights Inc.
ページ情報: 英文 220 Pages
納期: 2~3営業日
|

- 全表示
- 概要
- 図表
- 目次
粒子状物質モニタリング市場規模は、大気汚染に関連する呼吸器系疾患の世界の有病率の上昇に牽引され、2023年から2032年にかけてCAGR 12%以上で拡大する見通しです。
WHOによると、世界の10人中9人が毎日汚染された空気を吸っています。粒子状物質への暴露と呼吸器疾患との直接的な関連性を立証する科学的証拠により、大気の質を監視・管理する必要性に対する意識はかなり高まっています。そのため、いくつかの政府、ヘルスケア組織、産業界は、呼吸器系の健康問題の高まりに対処するため、高度なモニタリング・ソリューションに多額の投資を行っています。
さらに、多くの企業が、多様な産業や用途に対応するためのコンパクトで費用対効果の高いソリューションを導入するための研究開発投資を開始しており、業界の見通しをさらに強めています。例えば、2023年2月、イケアは室内空気汚染物質レベルの測定と監視を可能にする新しいVINDSTYRKA空気品質センサーを発売しました。
粒子状物質モニタリング産業は、モニタリングタイプ、粒子径、用途、最終用途産業と地域に区分されます。
モニタリングタイプに関しては、リアルタイムモニタリングセグメントの市場価値は、特に都市部や産業環境において、空気の質に関する即時の洞察に対する需要の高まりにより、2023年から2032年にかけて13%以上のCAGRを獲得すると予測されています。リアルタイム粒子状物質モニタリングデバイスは、当局や産業界が汚染を制御するための対策を迅速に実施できるように、実用的なデータを提供するための高度なセンサーやIoT技術と統合されています。
用途に基づき、室内空気品質モニタリングセグメントは2022年に粒子状物質モニタリング業界のかなりの収益シェアを占め、2032年まで13.5%の成長率を示すと予測されています。これは、室内汚染による健康への影響に対する意識の高まりに起因しています。特に商業および工業環境における厳しい規制が、室内空気品質モニタリングシステムの採用急増に寄与しています。さらに、アクセス性と有効性が強化された小型センサーやスマートモニタリングデバイスなどの技術的進歩の継続的な開発が、このセグメントの成長を促進します。
地域別では、欧州の粒子状物質モニタリング市場規模は、厳しい環境規制と一般市民の意識の高まりにより、2032年まで13.4%のCAGRを示すと予想されています。欧州グリーンディールのような政府のイニシアチブの流入は、この地域の大気質管理への投資を促進しています。さらに、製品需要の高まりに対応するため、先進的な空気品質ソリューションを開発する欧州メーカー間の協力が、この地域の市場成長にさらに貢献すると思われます。例えば、2023年9月、スイスを拠点とするセンサー・ソリューション・プロバイダーであるSensirionは、AirTeqと協業し、ビジネスおよび住宅用途に優れた室内空気品質ソリューションを提供する室内空気品質モニターAirCheq Proシリーズを提供しました。
目次
第1章 調査手法と調査範囲
第2章 エグゼクティブサマリー
第3章 粒子状物質モニタリング市場の産業洞察
- COVID-19への影響
- ロシア・ウクライナ戦争の影響
- エコシステム分析
- ベンダーマトリックス
- 利益率分析
- 技術とイノベーションの展望
- 特許分析
- 主要ニュースと取り組み
- 規制状況
- 影響要因
- 促進要因
- 大気質モニタリングに関する政府の法律と基準の増加
- 大気環境モニタリングの重要性の高まり
- 自動車および輸送部門における粒子状物質レベルの需要増加
- 粒子状物質による健康リスクに対する意識の高まり
- PMモニタリングシステムの継続的進歩
- 業界の潜在的リスク&課題
- PMモニタリング装置の設置やメンテナンスは困難な場合がある
- 低開発国でのPMモニタリングソリューション導入の遅れ
- 促進要因
- 成長可能性分析
- ポーター分析
- PESTEL分析
第4章 競合情勢
- イントロダクション
- 各社の市場シェア
- 主要市場プレーヤーの競合分析
- ACOEM Group
- AMETEK
- Siemens
- Spectris plc
- Teledyne Technologies Incorporated
- Thermo Fisher Scientific, Inc.
- TSI Incorporated
- 競合のポジショニング・マトリックス
- 戦略的展望マトリックス
第5章 粒子状物質モニタリング市場推計・予測:モニタリングタイプ別、2018年~2032年
- 主要動向:モニタリングタイプ別
- 手動モニタリング
- リアルタイムモニタリング
- 遠隔モニタリング
第6章 粒子状物質モニタリング市場規模推計・予測:粒子径別、2018年~2032年
- 主要動向:粒子径別
- PM 1(直径1マイクロメートル以下)径
- PM 2.5(2.5マイクロメートル以下)径
- PM 5(5マイクロメートル以下)径
- PM 10(10マイクロメートル以下)径
第7章 粒子状物質モニタリング市場推計・予測:用途別、2018年~2032年
- 主要動向:用途別
- 室内空気質(IAQ)モニタリング
- 屋外空気品質(IAQ)モニタリング
第8章 粒子状物質モニタリング市場推計・予測:最終用途産業別、2018年~2032年
- 主要動向:最終用途産業別
- 発電
- 石油・ガス
- 化学・石油化学
- 輸送・物流
- ヘルスケア
- 研究機関
- その他
第9章 粒子状物質モニタリング市場推計・予測:地域別2018~2032年
- 主要動向:地域別
- 北米
- 米国
- カナダ
- 欧州
- 英国
- ドイツ
- フランス
- イタリア
- スペイン
- その他欧州
- アジア太平洋
- 中国
- インド
- 日本
- 韓国
- ニュージーランド
- その他アジア太平洋地域
- ラテンアメリカ
- ブラジル
- メキシコ
- その他ラテンアメリカ
- 中東・アフリカ
- 南アフリカ
- GCC
- アラブ首長国連邦
- その他のMEA
第10章 企業プロファイル
- 3M Company
- ACOEM Group
- Aeroqual Group Limited
- AMETEK
- Beckman Coulter, Inc.
- ECOM America, Ltd.
- Emerson Electric Co.
- GrayWolf Sensing Solutions
- Horiba, Ltd.
- Kaiterra
- Kanomax, Inc.
- Rupprecht & Patashnick Co., Inc. (R&P)
- Siemens AG
- Teledyne API
- Thermo Fisher Scientific, Inc.
- TSI Incorporated
Data Tables
- TABLE 1 Global Particulate matter monitoring market 360 degree synopsis, 2018-2032
- TABLE 2 Particulate matter monitoring market, 2018 - 2022, (USD Million)
- TABLE 3 Particulate matter monitoring market, 2023 - 2032, (USD Million)
- TABLE 4 Particulate matter monitoring market TAM, 2023 - 2032
- TABLE 5 Particulate matter monitoring market, by monitoring type, 2018 - 2022, (USD Million)
- TABLE 6 Particulate matter monitoring market, by monitoring type, 2023 - 2032, (USD Million)
- TABLE 7 Particulate matter monitoring market, by particle size, 2018 - 2022, (USD Million)
- TABLE 8 Particulate matter monitoring market, by particle size, 2023 - 2032, (USD Million)
- TABLE 9 Particulate matter monitoring market, by application, 2018 - 2022, (USD Million)
- TABLE 10 Particulate matter monitoring market, by application, 2023 - 2032, (USD Million)
- TABLE 11 Particulate matter monitoring market, by end-use Industry, 2018 - 2022, (USD Million)
- TABLE 12 Particulate matter monitoring market, by end-use Industry, 2023 - 2032, (USD Million)
- TABLE 13 COVID-19 impact on North America particulate matter monitoring market
- TABLE 14 COVID-19 impact on Europe particulate matter monitoring market
- TABLE 15 COVID-19 impact on Asia Pacific particulate matter monitoring market
- TABLE 16 COVID-19 impact on Latin America particulate matter monitoring market
- TABLE 17 COVID-19 impact on MEA particulate matter monitoring market
- TABLE 18 Vendor matrix
- TABLE 19 Patent analysis
- TABLE 20 Industry impact forces
- TABLE 21 Company market share, 2022
- TABLE 22 Competitive analysis of major market players, 2022
- TABLE 23 Manual monitoring market, 2018 - 2022 (USD Million)
- TABLE 24 Manual monitoring market, 2023 - 2032 (USD Million)
- TABLE 25 Real-time monitoring market, 2018 - 2022 (USD Million)
- TABLE 26 Real-time monitoring market, 2023 - 2032 (USD Million)
- TABLE 27 Remote monitoring market, 2018 - 2022 (USD Million)
- TABLE 28 Remote monitoring market, 2023 - 2032 (USD Million)
- TABLE 29 PM 1 (1 Micrometer or less) dia market, 2018 - 2022 (USD Million)
- TABLE 30 PM 1 (1 Micrometer or less) dia market, 2023 - 2032 (USD Million)
- TABLE 31 PM 2.5 ( 2.5Micrometer or less) dia market, 2018 - 2022 (USD Million)
- TABLE 32 PM 2.5 ( 2.5Micrometer or less) dia market, 2023 - 2032 (USD Million)
- TABLE 33 PM 5 (5 Micrometer or less) dia market, 2018 - 2022 (USD Million)
- TABLE 34 PM 5 (5 Micrometer or less) dia market, 2023 - 2032 (USD Million)
- TABLE 35 PM 10 (10 Micrometer or less) dia market, 2018 - 2022 (USD Million)
- TABLE 36 PM 10 (10 Micrometer or less) dia market, 2023 - 2032 (USD Million)
- TABLE 37 Indoor air quality (IAQ) monitoring market, 2018 - 2022 (USD Million)
- TABLE 38 Indoor air quality (IAQ) monitoring market, 2023 - 2032 (USD Million)
- TABLE 39 Outdoor air quality (IAQ) monitoring market, 2018 - 2022 (USD Million)
- TABLE 40 Outdoor air quality (IAQ) monitoring market, 2023 - 2032 (USD Million)
- TABLE 41 Power generation market, 2018 - 2022 (USD Million)
- TABLE 42 Power generation market, 2023 - 2032 (USD Million)
- TABLE 43 Oil & gas market, 2018 - 2022 (USD Million)
- TABLE 44 Oil & gas market, 2023 - 2032 (USD Million)
- TABLE 45 Chemical & petrochemical market, 2018 - 2022 (USD Million)
- TABLE 46 Chemical & petrochemical market, 2023 - 2032 (USD Million)
- TABLE 47 Transportation and logistics market, 2018 - 2022 (USD Million)
- TABLE 48 Transportation and logistics market, 2023 - 2032 (USD Million)
- TABLE 49 Healthcare market, 2018 - 2022 (USD Million)
- TABLE 50 Healthcare market, 2023 - 2032 (USD Million)
- TABLE 51 Research institutions market, 2018 - 2022 (USD Million)
- TABLE 52 Research institutions market, 2023 - 2032 (USD Million)
- TABLE 53 Others market, 2018 - 2022 (USD Million)
- TABLE 54 Others market, 2023 - 2032 (USD Million)
- TABLE 55 North America particulate matter monitoring market, 2018 - 2022 (USD Million)
- TABLE 56 North America particulate matter monitoring market, 2023 - 2032 (USD Million)
- TABLE 57 North America particulate matter monitoring market, by monitoring type, 2018 - 2022 (USD Million)
- TABLE 58 North America particulate matter monitoring market, by monitoring type, 2023 - 2032 (USD Million
- TABLE 59 North America particulate matter monitoring market, by particle size, 2018 - 2022 (USD Million)
- TABLE 60 North America particulate matter monitoring market, by particle size, 2023 - 2032 (USD Million)
- TABLE 61 North America particulate matter monitoring market, by application, 2018 - 2022 (USD Million)
- TABLE 62 North America particulate matter monitoring market, by application, 2023 - 2032 (USD Million)
- TABLE 63 North America particulate matter monitoring market, by end-use Industry, 2018 - 2022 (USD Million)
- TABLE 64 North America particulate matter monitoring market, by end-use Industry, 2023 - 2032 (USD Million)
- TABLE 65 U.S. particulate matter monitoring market, 2018 - 2022 (USD Million)
- TABLE 66 U.S. particulate matter monitoring market, 2023 - 2032 (USD Million)
- TABLE 67 U.S. particulate matter monitoring market, by monitoring type, 2018 - 2022 (USD Million)
- TABLE 68 U.S. particulate matter monitoring market, by monitoring type, 2023 - 2032 (USD Million
- TABLE 69 U.S. particulate matter monitoring market, by particle size, 2018 - 2022 (USD Million)
- TABLE 70 U.S. particulate matter monitoring market, by particle size, 2023 - 2032 (USD Million)
- TABLE 71 U.S. particulate matter monitoring market, by application, 2018 - 2022 (USD Million)
- TABLE 72 U.S. particulate matter monitoring market, by application, 2023 - 2032 (USD Million)
- TABLE 73 U.S. particulate matter monitoring market, by end-use Industry, 2018 - 2022 (USD Million)
- TABLE 74 U.S. particulate matter monitoring market, by end-use Industry, 2023 - 2032 (USD Million)
- TABLE 75 Canada particulate matter monitoring market, 2018 - 2022 (USD Million)
- TABLE 76 Canada particulate matter monitoring market, 2023 - 2032 (USD Million)
- TABLE 77 Canada particulate matter monitoring market, by monitoring type, 2018 - 2022 (USD Million)
- TABLE 78 Canada particulate matter monitoring market, by monitoring type, 2023 - 2032 (USD Million
- TABLE 79 Canada particulate matter monitoring market, by particle size, 2018 - 2022 (USD Million)
- TABLE 80 Canada particulate matter monitoring market, by particle size, 2023 - 2032 (USD Million)
- TABLE 81 Canada particulate matter monitoring market, by application, 2018 - 2022 (USD Million)
- TABLE 82 Canada particulate matter monitoring market, by application, 2023 - 2032 (USD Million)
- TABLE 83 Canada particulate matter monitoring market, by end-use Industry, 2018 - 2022 (USD Million)
- TABLE 84 Canada particulate matter monitoring market, by end-use Industry, 2023 - 2032 (USD Million)
- TABLE 85 Europe particulate matter monitoring market, 2018 - 2022 (USD Million)
- TABLE 86 Europe particulate matter monitoring market, 2023 - 2032 (USD Million)
- TABLE 87 Europe particulate matter monitoring market, by monitoring type, 2018 - 2022 (USD Million)
- TABLE 88 Europe particulate matter monitoring market, by monitoring type, 2023 - 2032 (USD Million
- TABLE 89 Europe particulate matter monitoring market, by particle size, 2018 - 2022 (USD Million)
- TABLE 90 Europe particulate matter monitoring market, by particle size, 2023 - 2032 (USD Million)
- TABLE 91 Europe particulate matter monitoring market, by application, 2018 - 2022 (USD Million)
- TABLE 92 Europe particulate matter monitoring market, by application, 2023 - 2032 (USD Million)
- TABLE 93 Europe particulate matter monitoring market, by end-use Industry, 2018 - 2022 (USD Million)
- TABLE 94 Europe particulate matter monitoring market, by end-use Industry, 2023 - 2032 (USD Million)
- TABLE 95 UK particulate matter monitoring market, 2018 - 2022 (USD Million)
- TABLE 96 UK particulate matter monitoring market, 2023 - 2032 (USD Million)
- TABLE 97 UK particulate matter monitoring market, by monitoring type, 2018 - 2022 (USD Million)
- TABLE 98 UK particulate matter monitoring market, by monitoring type, 2023 - 2032 (USD Million
- TABLE 99 UK particulate matter monitoring market, by particle size, 2018 - 2022 (USD Million)
- TABLE 100 UK particulate matter monitoring market, by particle size, 2023 - 2032 (USD Million)
- TABLE 101 UK particulate matter monitoring market, by application, 2018 - 2022 (USD Million)
- TABLE 102 UK particulate matter monitoring market, by application, 2023 - 2032 (USD Million)
- TABLE 103 UK particulate matter monitoring market, by end-use Industry, 2018 - 2022 (USD Million)
- TABLE 104 UK particulate matter monitoring market, by end-use Industry, 2023 - 2032 (USD Million)
- TABLE 105 Germany particulate matter monitoring market, 2018 - 2022 (USD Million)
- TABLE 106 Germany particulate matter monitoring market, 2023 - 2032 (USD Million)
- TABLE 107 Germany particulate matter monitoring market, by monitoring type, 2018 - 2022 (USD Million)
- TABLE 108 Germany particulate matter monitoring market, by monitoring type, 2023 - 2032 (USD Million
- TABLE 109 Germany particulate matter monitoring market, by particle size, 2018 - 2022 (USD Million)
- TABLE 110 Germany particulate matter monitoring market, by particle size, 2023 - 2032 (USD Million)
- TABLE 111 Germany particulate matter monitoring market, by application, 2018 - 2022 (USD Million)
- TABLE 112 Germany particulate matter monitoring market, by application, 2023 - 2032 (USD Million)
- TABLE 113 Germany particulate matter monitoring market, by end-use Industry, 2018 - 2022 (USD Million)
- TABLE 114 Germany particulate matter monitoring market, by end-use Industry, 2023 - 2032 (USD Million)
- TABLE 115 France particulate matter monitoring market, 2018 - 2022 (USD Million)
- TABLE 116 France particulate matter monitoring market, 2023 - 2032 (USD Million)
- TABLE 117 France particulate matter monitoring market, by monitoring type, 2018 - 2022 (USD Million)
- TABLE 118 France particulate matter monitoring market, by monitoring type, 2023 - 2032 (USD Million
- TABLE 119 France particulate matter monitoring market, by particle size, 2018 - 2022 (USD Million)
- TABLE 120 France particulate matter monitoring market, by particle size, 2023 - 2032 (USD Million)
- TABLE 121 France particulate matter monitoring market, by application, 2018 - 2022 (USD Million)
- TABLE 122 France particulate matter monitoring market, by application, 2023 - 2032 (USD Million)
- TABLE 123 France particulate matter monitoring market, by end-use Industry, 2018 - 2022 (USD Million)
- TABLE 124 France particulate matter monitoring market, by end-use Industry, 2023 - 2032 (USD Million)
- TABLE 125 Italy particulate matter monitoring market, 2018 - 2022 (USD Million)
- TABLE 126 Italy particulate matter monitoring market, 2023 - 2032 (USD Million)
- TABLE 127 Italy particulate matter monitoring market, by monitoring type, 2018 - 2022 (USD Million)
- TABLE 128 Italy particulate matter monitoring market, by monitoring type, 2023 - 2032 (USD Million
- TABLE 129 Italy particulate matter monitoring market, by particle size, 2018 - 2022 (USD Million)
- TABLE 130 Italy particulate matter monitoring market, by particle size, 2023 - 2032 (USD Million)
- TABLE 131 Italy particulate matter monitoring market, by application, 2018 - 2022 (USD Million)
- TABLE 132 Italy particulate matter monitoring market, by application, 2023 - 2032 (USD Million)
- TABLE 133 Italy particulate matter monitoring market, by end-use Industry, 2018 - 2022 (USD Million)
- TABLE 134 Italy particulate matter monitoring market, by end-use Industry, 2023 - 2032 (USD Million)
- TABLE 135 Spain particulate matter monitoring market, 2018 - 2022 (USD Million)
- TABLE 136 Spain particulate matter monitoring market, 2023 - 2032 (USD Million)
- TABLE 137 Spain particulate matter monitoring market, by monitoring type, 2018 - 2022 (USD Million)
- TABLE 138 Spain particulate matter monitoring market, by monitoring type, 2023 - 2032 (USD Million
- TABLE 139 Spain particulate matter monitoring market, by particle size, 2018 - 2022 (USD Million)
- TABLE 140 Spain particulate matter monitoring market, by particle size, 2023 - 2032 (USD Million)
- TABLE 141 Spain particulate matter monitoring market, by application, 2018 - 2022 (USD Million)
- TABLE 142 Spain particulate matter monitoring market, by application, 2023 - 2032 (USD Million)
- TABLE 143 Spain particulate matter monitoring market, by end-use Industry, 2018 - 2022 (USD Million)
- TABLE 144 Spain particulate matter monitoring market, by end-use Industry, 2023 - 2032 (USD Million)
- TABLE 145 Rest of Europe particulate matter monitoring market, 2018 - 2022 (USD Million)
- TABLE 146 Rest of Europe particulate matter monitoring market, 2023 - 2032 (USD Million)
- TABLE 147 Rest of Europe particulate matter monitoring market, by monitoring type, 2018 - 2022 (USD Million)
- TABLE 148 Rest of Europe particulate matter monitoring market, by monitoring type, 2023 - 2032 (USD Million
- TABLE 149 Rest of Europe particulate matter monitoring market, by particle size, 2018 - 2022 (USD Million)
- TABLE 150 Rest of Europe particulate matter monitoring market, by particle size, 2023 - 2032 (USD Million)
- TABLE 151 Rest of Europe particulate matter monitoring market, by application, 2018 - 2022 (USD Million)
- TABLE 152 Rest of Europe particulate matter monitoring market, by application, 2023 - 2032 (USD Million)
- TABLE 153 Rest of Europe particulate matter monitoring market, by end-use Industry, 2018 - 2022 (USD Million)
- TABLE 154 Rest of Europe particulate matter monitoring market, by end-use Industry, 2023 - 2032 (USD Million)
- TABLE 155 Asia Pacific particulate matter monitoring market, 2018 - 2022 (USD Million)
- TABLE 156 Asia Pacific particulate matter monitoring market, 2023 - 2032 (USD Million)
- TABLE 157 Asia Pacific particulate matter monitoring market, by monitoring type, 2018 - 2022 (USD Million)
- TABLE 158 Asia Pacific particulate matter monitoring market, by monitoring type, 2023 - 2032 (USD Million
- TABLE 159 Asia Pacific particulate matter monitoring market, by particle size, 2018 - 2022 (USD Million)
- TABLE 160 Asia Pacific particulate matter monitoring market, by particle size, 2023 - 2032 (USD Million)
- TABLE 161 Asia Pacific particulate matter monitoring market, by application, 2018 - 2022 (USD Million)
- TABLE 162 Asia Pacific particulate matter monitoring market, by application, 2023 - 2032 (USD Million)
- TABLE 163 Asia Pacific particulate matter monitoring market, by end-use Industry, 2018 - 2022 (USD Million)
- TABLE 164 Asia Pacific particulate matter monitoring market, by end-use Industry, 2023 - 2032 (USD Million)
- TABLE 165 China particulate matter monitoring market, 2018 - 2022 (USD Million)
- TABLE 166 China particulate matter monitoring market, 2023 - 2032 (USD Million)
- TABLE 167 China particulate matter monitoring market, by monitoring type, 2018 - 2022 (USD Million)
- TABLE 168 China particulate matter monitoring market, by monitoring type, 2023 - 2032 (USD Million
- TABLE 169 China particulate matter monitoring market, by particle size, 2018 - 2022 (USD Million)
- TABLE 170 China particulate matter monitoring market, by particle size, 2023 - 2032 (USD Million)
- TABLE 171 China particulate matter monitoring market, by application, 2018 - 2022 (USD Million)
- TABLE 172 China particulate matter monitoring market, by application, 2023 - 2032 (USD Million)
- TABLE 173 China particulate matter monitoring market, by end-use Industry, 2018 - 2022 (USD Million)
- TABLE 174 China particulate matter monitoring market, by end-use Industry, 2023 - 2032 (USD Million)
- TABLE 175 Japan particulate matter monitoring market, 2018 - 2022 (USD Million)
- TABLE 176 Japan particulate matter monitoring market, 2023 - 2032 (USD Million)
- TABLE 177 Japan particulate matter monitoring market, by monitoring type, 2018 - 2022 (USD Million)
- TABLE 178 Japan particulate matter monitoring market, by monitoring type, 2023 - 2032 (USD Million
- TABLE 179 Japan particulate matter monitoring market, by particle size, 2018 - 2022 (USD Million)
- TABLE 180 Japan particulate matter monitoring market, by particle size, 2023 - 2032 (USD Million)
- TABLE 181 Japan particulate matter monitoring market, by application, 2018 - 2022 (USD Million)
- TABLE 182 Japan particulate matter monitoring market, by application, 2023 - 2032 (USD Million)
- TABLE 183 Japan particulate matter monitoring market, by end-use Industry, 2018 - 2022 (USD Million)
- TABLE 184 Japan particulate matter monitoring market, by end-use Industry, 2023 - 2032 (USD Million)
- TABLE 185 India particulate matter monitoring market, 2018 - 2022 (USD Million)
- TABLE 186 India Particulate matter monitoring market, 2023 - 2032 (USD Million)
- TABLE 187 India particulate matter monitoring market, by monitoring type, 2018 - 2022 (USD Million)
- TABLE 188 India particulate matter monitoring market, by monitoring type, 2023 - 2032 (USD Million
- TABLE 189 India particulate matter monitoring market, by particle size, 2018 - 2022 (USD Million)
- TABLE 190 India particulate matter monitoring market, by particle size, 2023 - 2032 (USD Million)
- TABLE 191 India particulate matter monitoring market, by application, 2018 - 2022 (USD Million)
- TABLE 192 India particulate matter monitoring market, by application, 2023 - 2032 (USD Million)
- TABLE 193 India particulate matter monitoring market, by end-use Industry, 2018 - 2022 (USD Million)
- TABLE 194 India particulate matter monitoring market, by end-use Industry, 2023 - 2032 (USD Million)
- TABLE 195 South Korea particulate matter monitoring market, 2018 - 2022 (USD Million)
- TABLE 196 South Korea particulate matter monitoring market, 2023 - 2032 (USD Million)
- TABLE 197 South Korea particulate matter monitoring market, by monitoring type, 2018 - 2022 (USD Million)
- TABLE 198 South Korea particulate matter monitoring market, by monitoring type, 2023 - 2032 (USD Million
- TABLE 199 South Korea particulate matter monitoring market, by particle size, 2018 - 2022 (USD Million)
- TABLE 200 South Korea particulate matter monitoring market, by particle size, 2023 - 2032 (USD Million)
- TABLE 201 South Korea particulate matter monitoring market, by application, 2018 - 2022 (USD Million)
- TABLE 202 South Korea particulate matter monitoring market, by application, 2023 - 2032 (USD Million)
- TABLE 203 South Korea particulate matter monitoring market, by end-use Industry, 2018 - 2022 (USD Million)
- TABLE 204 South Korea particulate matter monitoring market, by end-use Industry, 2023 - 2032 (USD Million)
- TABLE 205 ANZ particulate matter monitoring market, 2018 - 2022 (USD Million)
- TABLE 206 ANZ particulate matter monitoring market, 2023 - 2032 (USD Million)
- TABLE 207 ANZ particulate matter monitoring market, by monitoring type, 2018 - 2022 (USD Million)
- TABLE 208 ANZ particulate matter monitoring market, by monitoring type, 2023 - 2032 (USD Million
- TABLE 209 ANZ particulate matter monitoring market, by particle size, 2018 - 2022 (USD Million)
- TABLE 210 ANZ particulate matter monitoring market, by particle size, 2023 - 2032 (USD Million)
- TABLE 211 ANZ particulate matter monitoring market, by application, 2018 - 2022 (USD Million)
- TABLE 212 ANZ particulate matter monitoring market, by application, 2023 - 2032 (USD Million)
- TABLE 213 ANZ particulate matter monitoring market, by end-use Industry, 2018 - 2022 (USD Million)
- TABLE 214 ANZ particulate matter monitoring market, by end-use Industry, 2023 - 2032 (USD Million)
- TABLE 215 Rest of Asia Pacific particulate matter monitoring market, 2018 - 2022 (USD Million)
- TABLE 216 Rest of Rest of Asia Pacific particulate matter monitoring market, 2023 - 2032 (USD Million)
- TABLE 217 Rest of Asia Pacific particulate matter monitoring market, by monitoring type, 2018 - 2022 (USD Million)
- TABLE 218 Rest of Asia Pacific particulate matter monitoring market, by monitoring type, 2023 - 2032 (USD Million
- TABLE 219 Rest of Asia Pacific particulate matter monitoring market, by particle size, 2018 - 2022 (USD Million)
- TABLE 220 Rest of Asia Pacific particulate matter monitoring market, by particle size, 2023 - 2032 (USD Million)
- TABLE 221 Rest of Asia Pacific particulate matter monitoring market, by application, 2018 - 2022 (USD Million)
- TABLE 222 Rest of Rest of Asia Pacific particulate matter monitoring market, by application, 2023 - 2032 (USD Million)
- TABLE 223 Rest of Asia Pacific particulate matter monitoring market, by end-use Industry, 2018 - 2022 (USD Million)
- TABLE 224 Rest of Asia Pacific particulate matter monitoring market, by end-use Industry, 2023 - 2032 (USD Million)
- TABLE 225 Latin America particulate matter monitoring market, 2018 - 2022 (USD Million)
- TABLE 226 Latin America particulate matter monitoring market, 2023 - 2032 (USD Million)
- TABLE 227 Latin America particulate matter monitoring market, by monitoring type, 2018 - 2022 (USD Million)
- TABLE 228 Latin America particulate matter monitoring market, by fous monitoring type, 2023 - 2032 (USD Million
- TABLE 229 Latin America particulate matter monitoring market, by particle size, 2018 - 2022 (USD Million)
- TABLE 230 Latin America particulate matter monitoring market, by particle size, 2023 - 2032 (USD Million)
- TABLE 231 Latin America particulate matter monitoring market, by application, 2018 - 2022 (USD Million)
- TABLE 232 Latin America particulate matter monitoring market, by application, 2023 - 2032 (USD Million)
- TABLE 233 Latin America particulate matter monitoring market, by end-use Industry, 2018 - 2022 (USD Million)
- TABLE 234 Latin America particulate matter monitoring market, by end-use Industry, 2023 - 2032 (USD Million)
- TABLE 235 Brazil particulate matter monitoring market, 2018 - 2022 (USD Million)
- TABLE 236 Brazil particulate matter monitoring market, 2023 - 2032 (USD Million)
- TABLE 237 Brazil particulate matter monitoring market, by monitoring type, 2018 - 2022 (USD Million)
- TABLE 238 Brazil particulate matter monitoring market, by monitoring type, 2023 - 2032 (USD Million
- TABLE 239 Brazil particulate matter monitoring market, by particle size, 2018 - 2022 (USD Million)
- TABLE 240 Brazil particulate matter monitoring market, by particle size, 2023 - 2032 (USD Million)
- TABLE 241 Brazil particulate matter monitoring market, by application, 2018 - 2022 (USD Million)
- TABLE 242 Brazil particulate matter monitoring market, by application, 2023 - 2032 (USD Million)
- TABLE 243 Brazil particulate matter monitoring market, by end-use Industry, 2018 - 2022 (USD Million)
- TABLE 244 Brazil particulate matter monitoring market, by end-use Industry, 2023 - 2032 (USD Million)
- TABLE 245 Mexica particulate matter monitoring market, 2018 - 2022 (USD Million)
- TABLE 246 Mexica particulate matter monitoring market, 2023 - 2032 (USD Million)
- TABLE 247 Mexica particulate matter monitoring market, by monitoring type, 2018 - 2022 (USD Million)
- TABLE 248 Mexica particulate matter monitoring market, by monitoring type, 2023 - 2032 (USD Million
- TABLE 249 Mexica particulate matter monitoring market, by particle size, 2018 - 2022 (USD Million)
- TABLE 250 Mexica particulate matter monitoring market, by particle size, 2023 - 2032 (USD Million)
- TABLE 251 Mexica particulate matter monitoring market, by application, 2018 - 2022 (USD Million)
- TABLE 252 Mexica particulate matter monitoring market, by application, 2023 - 2032 (USD Million)
- TABLE 253 Mexica particulate matter monitoring market, by end-use Industry, 2018 - 2022 (USD Million)
- TABLE 254 Mexica particulate matter monitoring market, by end-use Industry, 2023 - 2032 (USD Million)
- TABLE 255 Rest of Latin America particulate matter monitoring market, 2018 - 2022 (USD Million)
- TABLE 256 Rest of Latin America particulate matter monitoring market, 2023 - 2032 (USD Million)
- TABLE 257 Rest of Latin America particulate matter monitoring market, by monitoring type, 2018 - 2022 (USD Million)
- TABLE 258 Rest of Latin America particulate matter monitoring market, by monitoring type, 2023 - 2032 (USD Million
- TABLE 259 Rest of Latin America particulate matter monitoring market, by particle size, 2018 - 2022 (USD Million)
- TABLE 260 Rest of Latin America particulate matter monitoring market, by particle size, 2023 - 2032 (USD Million)
- TABLE 261 Rest of Latin America particulate matter monitoring market, by application, 2018 - 2022 (USD Million)
- TABLE 262 Rest of Latin America particulate matter monitoring market, by application, 2023 - 2032 (USD Million)
- TABLE 263 Rest of Latin America particulate matter monitoring market, by end-use Industry, 2018 - 2022 (USD Million)
- TABLE 264 Rest of Latin America particulate matter monitoring market, by end-use Industry, 2023 - 2032 (USD Million)
- TABLE 265 MEA particulate matter monitoring market, 2018 - 2022 (USD Million)
- TABLE 266 MEA particulate matter monitoring market, 2023 - 2032 (USD Million)
- TABLE 267 MEA particulate matter monitoring market, by monitoring type, 2018 - 2022 (USD Million)
- TABLE 268 MEA particulate matter monitoring market, by monitoring type, 2023 - 2032 (USD Million
- TABLE 269 MEA particulate matter monitoring market, by particle size, 2018 - 2022 (USD Million)
- TABLE 270 MEA particulate matter monitoring market, by particle size, 2023 - 2032 (USD Million)
- TABLE 271 MEA particulate matter monitoring market, by application, 2018 - 2022 (USD Million)
- TABLE 272 MEA particulate matter monitoring market, by application, 2023 - 2032 (USD Million)
- TABLE 273 MEA particulate matter monitoring market, by end-use Industry, 2018 - 2022 (USD Million)
- TABLE 274 MEA particulate matter monitoring market, by end-use Industry, 2023 - 2032 (USD Million)
- TABLE 275 South Africa particulate matter monitoring market, 2018 - 2022 (USD Million)
- TABLE 276 South Africa particulate matter monitoring market, 2023 - 2032 (USD Million)
- TABLE 277 South Africa particulate matter monitoring market, by monitoring type, 2018 - 2022 (USD Million)
- TABLE 278 South Africa particulate matter monitoring market, by monitoring type, 2023 - 2032 (USD Million
- TABLE 279 South Africa particulate matter monitoring market, by particle size, 2018 - 2022 (USD Million)
- TABLE 280 South Africa particulate matter monitoring market, by particle size, 2023 - 2032 (USD Million)
- TABLE 281 South Africa particulate matter monitoring market, by application, 2018 - 2022 (USD Million)
- TABLE 282 South Africa particulate matter monitoring market, by application, 2023 - 2032 (USD Million)
- TABLE 283 South Africa particulate matter monitoring market, by end-use Industry, 2018 - 2022 (USD Million)
- TABLE 284 South Africa particulate matter monitoring market, by end-use Industry, 2023 - 2032 (USD Million)
- TABLE 285 GCC particulate matter monitoring market, 2018 - 2022 (USD Million)
- TABLE 286 GCC particulate matter monitoring market, 2023 - 2032 (USD Million)
- TABLE 287 GCC particulate matter monitoring market, by monitoring type, 2018 - 2022 (USD Million)
- TABLE 288 GCC particulate matter monitoring market, by monitoring type, 2023 - 2032 (USD Million
- TABLE 289 GCC particulate matter monitoring market, by particle size, 2018 - 2022 (USD Million)
- TABLE 290 GCC particulate matter monitoring market, by particle size, 2023 - 2032 (USD Million)
- TABLE 291 GCC particulate matter monitoring market, by application, 2018 - 2022 (USD Million)
- TABLE 292 GCC particulate matter monitoring market, by application, 2023 - 2032 (USD Million)
- TABLE 293 GCC particulate matter monitoring market, by end-use Industry, 2018 - 2022 (USD Million)
- TABLE 294 GCC particulate matter monitoring market, by end-use Industry, 2023 - 2032 (USD Million)
- TABLE 295 UAE particulate matter monitoring market, 2018 - 2022 (USD Million)
- TABLE 296 UAE particulate matter monitoring market, 2023 - 2032 (USD Million)
- TABLE 297 UAE particulate matter monitoring market, by monitoring type, 2018 - 2022 (USD Million)
- TABLE 298 UAE particulate matter monitoring market, by monitoring type, 2023 - 2032 (USD Million
- TABLE 299 UAE particulate matter monitoring market, by particle size, 2018 - 2022 (USD Million)
- TABLE 300 UAE particulate matter monitoring market, by particle size, 2023 - 2032 (USD Million)
- TABLE 301 UAE particulate matter monitoring market, by application, 2018 - 2022 (USD Million)
- TABLE 302 UAE particulate matter monitoring market, by application, 2023 - 2032 (USD Million)
- TABLE 303 UAE particulate matter monitoring market, by end-use Industry, 2018 - 2022 (USD Million)
- TABLE 304 UAE particulate matter monitoring market, by end-use Industry, 2023 - 2032 (USD Million)
- TABLE 305 Rest of MEA particulate matter monitoring market, 2018 - 2022 (USD Million)
- TABLE 306 Rest of MEA particulate matter monitoring market, 2023 - 2032 (USD Million)
- TABLE 307 Rest of MEA particulate matter monitoring market, by monitoring type, 2018 - 2022 (USD Million)
- TABLE 308 Rest of MEA particulate matter monitoring market, by monitoring type, 2023 - 2032 (USD Million
- TABLE 309 Rest of MEA particulate matter monitoring market, by particle size, 2018 - 2022 (USD Million)
- TABLE 310 Rest of MEA particulate matter monitoring market, by particle size, 2023 - 2032 (USD Million)
- TABLE 311 Rest of MEA particulate matter monitoring market, by application, 2018 - 2022 (USD Million)
- TABLE 312 Rest of MEA particulate matter monitoring market, by application, 2023 - 2032 (USD Million)
- TABLE 313 Rest of MEA particulate matter monitoring market, by end-use Industry, 2018 - 2022 (USD Million)
- TABLE 314 Rest of MEA particulate matter monitoring market, by end-use Industry, 2023 - 2032 (USD Million)
Charts & Figures
- FIG 1 GMI's report technology in the global particulate matter monitoring market
- FIG 2 Industry segmentation
- FIG 3 Forecast calculation
- FIG 4 Profile break-up of primary respondents
- FIG 5 Global particulate matter monitoring market 36 degree synopsis, 2018 - 2032
- FIG 6 Particulate matter monitoring market ecosystem analysis
- FIG 7 Profit margin analysis
- FIG 8 Growth potential analysis
- FIG 9 Porter's analysis
- FIG 10 PESTEL analysis
- FIG 11 Competitive analysis of major market players, 2022
- FIG 12 Competitive positioning matrix
- FIG 13 Strategic outlook matrix
- FIG 14 Particulate matter monitoring market by monitoring type, 2022& 2032
- FIG 15 Particulate matter monitoring market by particle size, 2022& 2032
- FIG 16 Particulate matter monitoring market by application, 2022& 2032
- FIG 17 Particulate matter monitoring market by end-use Industry, 2022& 2032
- FIG 18 SWOT analysis, 3M Company
- FIG 19 SWOT analysis, ACOEM Group
- FIG 20 SWOT analysis, Aeroqual Group Limited
- FIG 21 SWOT analysis, AMETEK
- FIG 22 SWOT analysis, Beckman Coulter, Inc.
- FIG 23 SWOT analysis, ECOM America, Ltd.
- FIG 24 SWOT analysis, Emerson Electric Co.
- FIG 25 SWOT analysis, GrayWolf Sensing Solutions
- FIG 26 SWOT analysis, Horiba, Ltd.
- FIG 27 SWOT analysis, Kaiterra
- FIG 28 SWOT analysis, Kanomax, Inc.
- FIG 29 SWOT analysis, Rupprecht & Patashnick Co., Inc. (R&P)
- FIG 30 SWOT analysis, Siemens AG
- FIG 31 SWOT analysis, Teledyne API
- FIG 32 SWOT analysis, Thermo Fisher Scientific, Inc.
- FIG 33 SWOT analysis, TSI Incorporated
Particulate Matter Monitoring Market size is poised to expand at over 12% CAGR from 2023 to 2032, driven by the rising global prevalence of respiratory diseases linked to air pollution. According to WHO, 9 out of every 10 people worldwide breathe polluted air every day. With scientific evidence establishing direct links between exposure to particulate matter and respiratory issues, the awareness of the need to monitor and control air quality has considerably heightened. To that end, several governments, healthcare organizations, and industries are heavily investing in advanced monitoring solutions to combat rising respiratory health concerns.
Moreover, a large number of companies are initiating R&D investments to introduce compact and cost-effective solutions for catering to diverse industries and applications, further augmenting the industry outlook. For instance, in February 2023, IKEA launched the new VINDSTYRKA air quality sensor to enable the measurement and monitoring of indoor air pollutant levels.
The particulate matter monitoring industry is segmented into monitoring type, particle size, application, and end-use industry and region.
In terms of monitoring type, the market value from the real-time monitoring segment is anticipated to accrue over 13% CAGR from 2023 to 2032 owing to the rising demand for immediate insights into air quality, especially in urban and industrial settings. Real-time particulate matter monitoring devices are integrated with advanced sensors and IoT technologies for offering actionable data to allow authorities and industries to promptly implement measures to control pollution.
Based on application, the indoor air quality monitoring segment accounted for considerable revenue share of the particulate matter monitoring industry in 2022 and is projected to witness 13.5% growth rate through 2032. This can be attributed to the increasing awareness of the health impacts caused by indoor pollution. Stringent regulations, especially in commercial and industrial settings, are contributing to the surging adoption of indoor air quality monitoring systems. Additionally, the ongoing development of technological advancements, including compact sensors and smart monitoring devices with enhanced accessibility and effectiveness will propel the segment growth.
Regionally, the Europe particulate matter monitoring market size is expected to exhibit 13.4% CAGR through 2032 driven by stringent environmental regulations and increasing public awareness. The influx of government initiatives, such as the European Green Deal are propelling investments in air quality management in the region. Furthermore, collaborations between European manufacturers to develop advanced air quality solutions to address the rising product demand will further contribute to the regional market growth. For instance, in September 2023, Switzerland-based sensor solution provider Sensirion collaborated with AirTeq to offer the AirCheq Pro Series, an indoor air quality monitor to provide superior indoor air quality solutions for business and residential applications.
Table of Contents
Chapter 1 Methodology & Scope
- 1.1 Market scope & definition
- 1.2 Base estimates & calculations
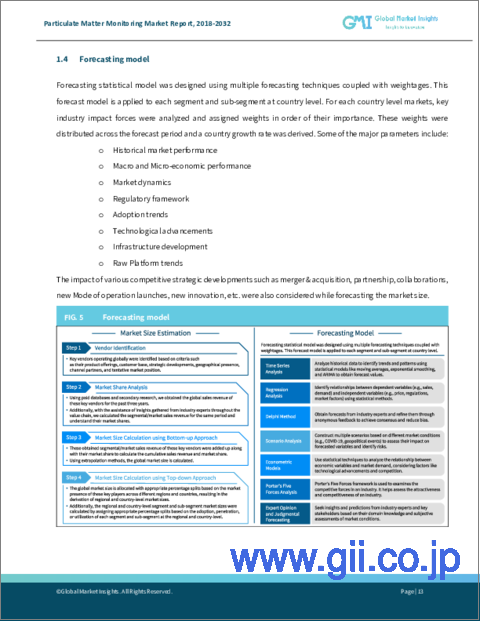
- 1.3 Forecast calculation
- 1.4 Data Sources
- 1.4.1 Primary
- 1.4.2 Secondary
- 1.4.2.1 Paid sources
- 1.4.2.2 Public sources
Chapter 2 Executive Summary
- 2.1 Particulate matter monitoring market 360 degree synopsis, 2018 - 2032
- 2.2 Business trends
- 2.2.1 Total addressable market (TAM), 2023-2032
- 2.3 Regional trends
- 2.4 Monitoring type trends
- 2.5 Particle size trends
- 2.6 Application trends
- 2.7 End-use Industry trends
Chapter 3 Particulate Matter Monitoring Market Industry Insights
- 3.1 Impact on COVID-19
- 3.2 Russia- Ukraine war impact
- 3.3 Industry ecosystem analysis
- 3.4 Vendor matrix
- 3.5 Profit margin analysis
- 3.6 Technology & innovation landscape
- 3.7 Patent analysis
- 3.8 Key news and initiatives
- 3.9 Regulatory landscape
- 3.10 Impact forces
- 3.10.1 Growth drivers
- 3.10.1.1 Increasing government laws and standards for monitoring air quality
- 3.10.1.2 Monitoring of ambient air quality is becoming more important
- 3.10.1.3 Rising demand of particulate matter levels in automotive and transportation sectors
- 3.10.1.4 Increasing awareness about the health risks associated of particulate matter.
- 3.10.1.5 Ongoing advancements in PM monitoring systems
- 3.10.2 Industry pitfalls & challenges
- 3.10.2.1 Installing and maintaining PM monitoring devices can be difficult.
- 3.10.2.2 Delays in underdeveloped nations in implementing PM monitoring solutions.
- 3.10.1 Growth drivers
- 3.11 Growth potential analysis
- 3.12 Porter's analysis
- 3.13 PESTEL analysis
Chapter 4 Competitive Landscape, 2022
- 4.1 Introduction
- 4.2 Company market share, 2022
- 4.3 Competitive analysis of major market players, 2022
- 4.3.1 ACOEM Group
- 4.3.2 AMETEK
- 4.3.3 Siemens
- 4.3.4 Spectris plc
- 4.3.5 Teledyne Technologies Incorporated
- 4.3.6 Thermo Fisher Scientific, Inc.
- 4.3.7 TSI Incorporated
- 4.4 Competitive positioning matrix, 2022
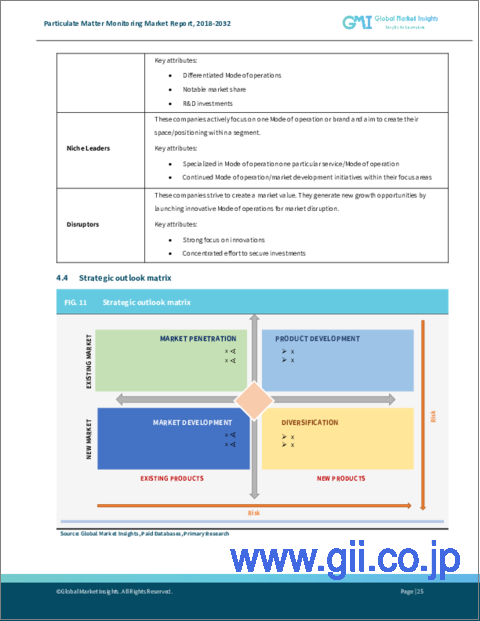
- 4.5 Strategic outlook matrix, 2022
Chapter 5 Particulate Matter Monitoring Market Estimates and Forecast, By Monitoring Type 2018-2032 (USD Million)
- 5.1 Key trends, by monitoring type
- 5.2 Manual monitoring
- 5.3 Real-time monitoring
- 5.4 Remote monitoring
Chapter 6 Particulate Matter Monitoring Market Estimates and Forecast, By Particle Size 2018-2032 (USD Million)
- 6.1 Key trends, by particle size
- 6.2 PM 1 (1 Micrometer or less) dia
- 6.3 PM 2.5 ( 2.5Micrometer or less) dia
- 6.4 PM 5 (5 Micrometer or less) dia
- 6.5 PM 10 (10 Micrometer or less) dia
Chapter 7 Particulate Matter Monitoring Market Estimates and Forecast, By Application 2018-2032 (USD Million)
- 7.1 Key trends, by application
- 7.2 Indoor air quality (IAQ) monitoring
- 7.3 Outdoor air quality (IAQ) monitoring
Chapter 8 Particulate Matter Monitoring Market Estimates and Forecast, By End-use Industry 2018-2032 (USD Million)
- 8.1 Key trends, by end-use Industry
- 8.2 Power generation
- 8.3 Oil & gas
- 8.4 Chemical & petrochemical
- 8.5 Transportation and logistics
- 8.6 Healthcare
- 8.7 Research institutions
- 8.8 Others
Chapter 9 Particulate Matter Monitoring Market Estimates and Forecast, By Region 2018-2032 (USD Million)
- 9.1 Key trends, by region
- 9.2 North America
- 9.2.1 U.S.
- 9.2.2 Canada
- 9.3 Europe
- 9.3.1 UK
- 9.3.2 Germany
- 9.3.3 France
- 9.3.4 Italy
- 9.3.5 Spain
- 9.3.6 Rest of Europe
- 9.4 Asia Pacific
- 9.4.1 China
- 9.4.2 India
- 9.4.3 Japan
- 9.4.4 South Korea
- 9.4.5 ANZ
- 9.4.6 Rest of Asia Pacific
- 9.5 Latin America
- 9.5.1 Brazil
- 9.5.2 Mexico
- 9.5.3 Rest of Latin America
- 9.6 MEA
- 9.6.1 South Africa
- 9.6.2 GCC
- 9.6.3 UAE
- 9.6.4 Rest of MEA
Chapter 10 Company Profiles (Business Overview, Financial Overview, Product Landscape, Strategic Outlook, SWOT Analysis)
- 10.1 3M Company
- 10.2 ACOEM Group
- 10.3 Aeroqual Group Limited
- 10.4 AMETEK
- 10.5 Beckman Coulter, Inc.
- 10.6 ECOM America, Ltd.
- 10.7 Emerson Electric Co.
- 10.8 GrayWolf Sensing Solutions
- 10.9 Horiba, Ltd.
- 10.10 Kaiterra
- 10.11 Kanomax, Inc.
- 10.12 Rupprecht & Patashnick Co., Inc. (R&P)
- 10.13 Siemens AG
- 10.14 Teledyne API
- 10.15 Thermo Fisher Scientific, Inc.
- 10.16 TSI Incorporated
