
交流電圧トランスデューサ市場の機会、成長要因、業界動向分析、および2026年~2035年の予測
AC Voltage Transducer Market Opportunity, Growth Drivers, Industry Trend Analysis, and Forecast 2026 - 2035- 発行日
- ページ情報
- 英文 130 Pages
- 納期
- 2~3営業日
- 商品コード
- 2038746
- カスタマイズ可能 お客様のご希望に応じて、既存データの加工や未掲載情報(例:国別セグメント)の追加などの対応が可能です。詳細はお問い合わせください。
- 翻訳ツール提供対象 PDF対応AI翻訳ツールの無料貸し出しサービスのご利用が可能です
世界の交流電圧トランスデューサ市場は、2025年に11億米ドルと評価され、CAGR 7.3%で成長し、2035年までに22億米ドルに達すると推定されています。
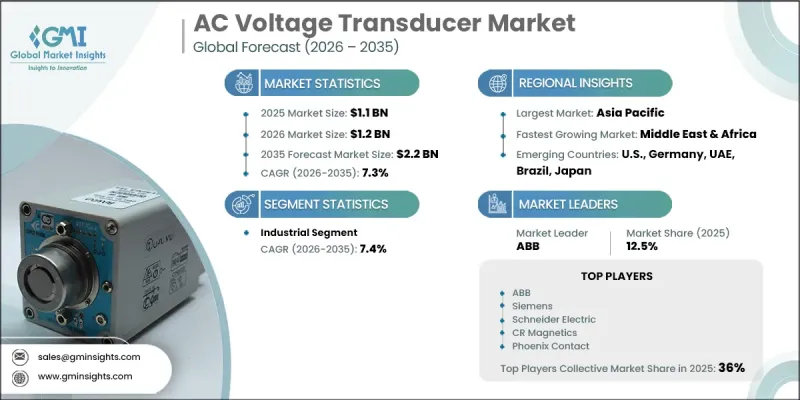
産業オートメーションや電力監視システムが各セクターで拡大し続ける中、交流電圧トランスデューサへの需要が高まっています。効率的なエネルギー管理と業務の継続性に対する関心の高まりが、高度な監視デバイスの導入を加速させています。製造、石油・ガス、化学処理など、高い電力需要を伴う産業では、リアルタイムの電圧追跡とシステムの信頼性が求められるため、安定した需要を生み出しています。これらのデバイスは、エネルギー利用効率を向上させ、スマートファクトリーのエコシステムへの移行を支援すると同時に、運用リスクの低減にも寄与しています。また、エネルギー効率の高い技術やデジタル化された産業インフラへの移行が進んでいることも、市場にとって追い風となっています。こうした環境において、正確な電圧測定は、運用の安定性を維持し、ダウンタイムを削減する上で極めて重要な役割を果たしています。
| 市場の範囲 | |
|---|---|
| 開始年 | 2025年 |
| 予測期間 | 2026年~2035年 |
| 開始時の市場規模 | 11億米ドル |
| 予測額 | 22億米ドル |
| CAGR | 7.3% |
交流電圧トランスデューサ市場は、小型化、測定精度の向上、およびデジタル統合機能の強化といった進歩に伴い、急速に進化しています。最新のトランスデューサには、ワイヤレス接続機能やクラウドベースの監視機能が搭載されるケースが増えており、これにより遠隔システム診断や予知保全戦略が可能になっています。また、センシング技術や材料工学の進歩により、過酷な産業環境下での耐久性と性能も向上しています。さらに、マルチレンジ機能や自己校正機能といった革新的な技術により、再生可能エネルギーの統合や次世代配電ネットワークを含む、先進的なエネルギーシステム全体での適用範囲が拡大しています。
産業分野は、2035年までCAGR7.4%で成長すると予測されています。この分野の成長は、産業環境における精密な電圧監視、エネルギー効率の向上、および運用信頼性の強化に対する需要の高まりに支えられています。交流電圧トランスデューサは、製造、石油・ガス、化学処理産業において、機器の保護、電力消費の最適化、およびダウンタイムの最小化を確保する上で重要な役割を果たしています。自動化システムやIoT対応の監視プラットフォームとの統合により、その導入はさらに加速しており、現代の産業運営においてリアルタイムの洞察とプロセス制御の向上を実現しています。
米国の交流電圧トランスデューサ市場は、2035年までに3億3,490万米ドルに達すると予想されています。市場の拡大は、エネルギー効率の高いシステムへの重視の高まりと、全米における電力インフラの近代化によって牽引されています。スマート製造の実践、自動化技術、および持続可能性に焦点を当てたエネルギー管理ソリューションの導入は、産業セクター全体で増加しています。風力や太陽光発電設備を含む再生可能エネルギープロジェクトの急速な成長も、送電網の安定性と効率的な電力配電を確保するための高精度電圧監視ソリューションへの需要を後押ししています。
よくあるご質問
目次
第1章 調査手法と範囲
第2章 エグゼクティブサマリー
第3章 業界考察
- エコシステム分析
- 原材料の入手可能性および調達分析
- 生産能力の評価
- サプライチェーンのレジリエンスとリスク要因
- 流通ネットワーク分析
- 規制情勢
- 業界への影響要因
- 促進要因
- 業界の潜在的リスク&課題
- 成長可能性分析
- ポーター分析
- PESTEL分析
- 貿易データ分析(1次調査に基づく)
- 輸出入額の動向(1次調査に基づく)
- 主要な貿易ルートと関税の影響(1次調査に基づく)
- 生産能力および生産動向(1次調査に基づく)
- 主要生産者別の生産能力(1次調査に基づく)
- 稼働率および拡張計画(1次調査に基づく)
- AIおよび生成AIが市場に与える影響(コアソリューション)
- AIを活用した生産最適化(コアソリューション)
- 予知保全および故障検出(コアソリューション)
- 新たな機会と動向
- 投資分析と将来展望
- サステナビリティの取り組みとインダストリー4.0への統合
第4章 競合情勢
- イントロダクション
- 企業の市場シェア分析:地域別
- 北米
- 欧州
- アジア太平洋地域
- 中東・アフリカ
- ラテンアメリカ
- 主な発展
- 主要なパートナーシップおよび提携
- 主なM&A活動
- 製品の革新と新製品発売
- 市場拡大戦略
- 競合ポジショニングマトリックス
第5章 市場規模・予測:用途別、2022-2035
- 鉄道
- 再生可能エネルギー
- 産業用
- 自動車
- その他
第6章 市場規模・予測:地域別、2022-2035
- 北米
- 米国
- カナダ
- メキシコ
- 欧州
- 英国
- フランス
- ドイツ
- イタリア
- ロシア
- スペイン
- アジア太平洋地域
- 中国
- オーストラリア
- インド
- 日本
- 韓国
- 中東・アフリカ
- サウジアラビア
- アラブ首長国連邦
- トルコ
- 南アフリカ
- エジプト
- ラテンアメリカ
- ブラジル
- アルゼンチン
第7章 企業プロファイル
- ABB
- Analog Devices
- Carlo Gavazzi
- CR Magnetics
- Crompton Instruments
- DENT Instruments
- Eaton Corporation
- Honeywell International
- LEM International
- Mors Smitt
- NK Technologies
- OMRON Corporation
- Phoenix Contact
- RECOM Power
- Schneider Electric
- Siemens
- Socomec
- Texas Instruments
- Weidmuller Interface
- Yokogawa Electric Corporation
- 発行日
- 発行
- Global Market Insights Inc.
- ページ情報
- 英文 130 Pages
- 納期
- 2~3営業日


