|
|
市場調査レポート
商品コード
1372450
ホスゲン市場- 誘導体別、用途別、予測、2023年~2032年Phosgene Market - By Derivative (Isocyanates, Chloroformates, Carbamoyl Chlorides), By Application (Agrochemicals, Polycarbonates, Pharmaceuticals, Fine Chemicals, Dyes, Specialty Chemicals) & Forecast, 2023 - 2032 |
||||||
|
|
|||||||
カスタマイズ可能
|
|||||||


| ホスゲン市場- 誘導体別、用途別、予測、2023年~2032年 |
|
出版日: 2023年08月31日
発行: Global Market Insights Inc.
ページ情報: 英文 120 Pages
納期: 2~3営業日
|

- 全表示
- 概要
- 図表
- 目次
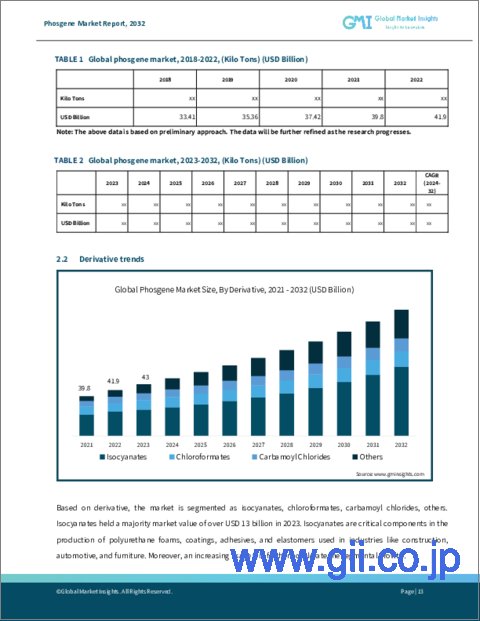
ホスゲンの市場規模は、2023年から2032年にかけてCAGR 5.5%になると予測されています。
殺虫剤、除草剤、医薬中間体の製造に広く使用されています。例えば、原料としてホスゲン誘導体であるイソシアネートを必要とするポリウレタンの使用とその後の生産が増加しています。
さらに、急成長する自動車産業と建設産業が、ホスゲンベースの製品に対する需要をさらに促進しており、市場の見通しを明るいものにしています。欧州自動車工業会のデータによると、2022年には世界中で8,540万台の自動車が生産されます。
クロロギ酸エステル誘導体分野は、製薬・化学産業の急速な拡大により、2032年までに高収益を上げると予想されます。クロロギ酸誘導体は、染料、農薬、医薬品など様々な化学品の合成に幅広く利用されているため、需要が大幅に増加しています。持続可能な化学合成プロセスへの注目の高まりは、同分野の成長をさらに刺激すると思われます。
ポリカーボネート用途分野は、ホスゲンが製品に与える卓越した耐久性、高い耐衝撃性、光学的透明性により、2023年から2032年にかけて高いCAGRが見込まれます。ポリカーボネートは、自動車、電気・電子、建築など、さまざまな分野で広く利用されています。これらの分野で軽量で耐久性のある素材への需要が高まっていることが、ポリカーボネートの消費を大幅に押し上げ、市場収益を増加させています。
アジア太平洋地域のホスゲン市場規模は、中国、インド、日本などの国々における急速な工業化と化学セクターの急成長により、2032年まで顕著な成長を遂げると思われます。人口の増加と可処分所得の増加、都市化が相まって、ホスゲンベースの製品を利用する消費財の需要が高まっています。さらに、この地域における自動車産業とエレクトロニクス産業の新興国市場は、様々な用途でのホスゲンの使用をさらに増大させ、今後数年間のホスゲン市場の発展を後押ししています。
目次
第1章 調査手法と調査範囲
第2章 エグゼクティブサマリー
第3章 ホスゲン産業洞察
- エコシステム分析
- 業界への影響要因
- 促進要因
- 業界の潜在的リスク&課題
- 成長の可能性分析
- COVID-19影響分析
- 規制状況
- 米国
- 欧州
- 価格分析、2022年
- 技術展望
- 今後の市場動向
- ポーター分析
- PESTEL分析
- ロシア・ウクライナ戦争の影響
第4章 競合情勢
- イントロダクション
- 企業マトリックス分析
- 世界企業シェア分析
- 競合のポジショニングマトリックス
- 戦略ダッシュボード
第5章 ホスゲンの市場規模・予測:誘導体別、2018年~2032年
- イソシアネート
- クロロホルメート
- カルバモイルクロリド
- その他
第6章 ホスゲンの市場規模・予測:用途別、2018年~2032年
- 農薬
- ポリカーボネート
- 医薬
- ファインケミカル
- 染料
- 特殊化学品
- その他
第7章 ホスゲンの市場規模・予測:地域別、2018年~2032年
- 主要動向:地域別
- 北米
- 米国
- カナダ
- 欧州
- ドイツ
- 英国
- フランス
- スペイン
- イタリア
- アジア太平洋
- 日本
- 中国
- インド
- オーストラリア
- 韓国
- インドネシア
- マレーシア
- ラテンアメリカ
- ブラジル
- メキシコ
- アルゼンチン
- 中東・アフリカ
- 南アフリカ
- サウジアラビア
- アラブ首長国連邦
- エジプト
第8章 企業プロファイル
- BASF SE
- Covestro AG
- Dow Inc.
- Huntsman Corporation
- Wanhua Chemical Group Co., Ltd.
- OCI Company Ltd.
- Puyang Shenghuade Chemical Co., Ltd.
- Jilin Tely Chemical Co., Ltd.
- Chongqing Changshou Chemical Co., Ltd.
- Shandong Lantian Disinfection Technology Co., Ltd.
- Shandong Tianhong Chemical Co., Ltd.
- Shandong Fine Chemical Co., Ltd.
- Yuneng Chemical Co., Ltd.
- Shandong Luyue Chemical Co., Ltd.
- Xuzhou JianPing Chemical Co., Ltd.
Data Tables
- TABLE 1 Market revenue, by product type (2022)
- TABLE 2 Market revenue, by derivative (2022)
- TABLE 3 Market revenue, by application (2022)
- TABLE 4 Market revenue, by region (2022)
- TABLE 5 Global phosgene market size, 2018 - 2032, (USD Billion)
- TABLE 6 Global phosgene market size, 2018 - 2032, (Kilo Tons)
- TABLE 7 Global phosgene market size, by region, 2018 - 2032 (USD Billion)
- TABLE 8 Global phosgene market size, by region, 2018 - 2032 (Kilo Tons)
- TABLE 9 Global phosgene market size, by derivative, 2018 - 2032 (USD Billion)
- TABLE 10 Global phosgene market size, by derivative, 2018 - 2032 (Kilo Tons)
- TABLE 11 Global phosgene market size, by application, 2018 - 2032 (USD Billion)
- TABLE 12 Global phosgene market size, by application, 2018 - 2032 (Kilo Tons)
- TABLE 13 Industry impact forces
- TABLE 14 North America phosgene market size, by country, 2018 - 2032 (USD Billion)
- TABLE 15 North America phosgene market size, by country, 2018 - 2032 (Kilo Tons)
- TABLE 16 North America phosgene market size, by derivative, 2018 - 2032 (USD Billion)
- TABLE 17 North America phosgene market size, by derivative, 2018 - 2032 (Kilo Tons)
- TABLE 18 North America phosgene market size, by application, 2018 - 2032 (USD Billion)
- TABLE 19 North America phosgene market size, by application, 2018 - 2032 (Kilo Tons)
- TABLE 20 U.S. phosgene market size, by derivative, 2018 - 2032 (USD Billion)
- TABLE 21 U.S. phosgene market size, by derivative, 2018 - 2032 (Kilo Tons)
- TABLE 22 U.S. phosgene market size, by application, 2018 - 2032 (USD Billion)
- TABLE 23 U.S. phosgene market size, by application, 2018 - 2032 (Kilo Tons)
- TABLE 24 Canada phosgene market size, by derivative, 2018 - 2032 (USD Billion)
- TABLE 25 Canada phosgene market size, by derivative, 2018 - 2032 (Kilo Tons)
- TABLE 26 Canada phosgene market size, by application, 2018 - 2032 (USD Billion)
- TABLE 27 Canada phosgene market size, by application, 2018 - 2032 (Kilo Tons)
- TABLE 28 Europe phosgene market size, by country, 2018 - 2032 (USD Billion)
- TABLE 29 Europe phosgene market size, by country, 2018 - 2032 (Kilo Tons)
- TABLE 30 Europe phosgene market size, by derivative, 2018 - 2032 (USD Billion)
- TABLE 31 Europe phosgene market size, by derivative, 2018 - 2032 (Kilo Tons)
- TABLE 32 Europe phosgene market size, by application, 2018 - 2032 (USD Billion)
- TABLE 33 Europe phosgene market size, by application, 2018 - 2032 (Kilo Tons)
- TABLE 34 Germany phosgene market size, by derivative, 2018 - 2032 (USD Billion)
- TABLE 35 Germany phosgene market size, by derivative, 2018 - 2032 (Kilo Tons)
- TABLE 36 Germany phosgene market size, by application, 2018 - 2032 (USD Billion)
- TABLE 37 Germany phosgene market size, by application, 2018 - 2032 (Kilo Tons)
- TABLE 38 UK phosgene market size, by derivative, 2018 - 2032 (USD Billion)
- TABLE 39 UK phosgene market size, by derivative, 2018 - 2032 (Kilo Tons)
- TABLE 40 UK phosgene market size, by application, 2018 - 2032 (USD Billion)
- TABLE 41 UK phosgene market size, by application, 2018 - 2032 (Kilo Tons)
- TABLE 42 France phosgene market size, by derivative, 2018 - 2032 (USD Billion)
- TABLE 43 France phosgene market size, by derivative, 2018 - 2032 (Kilo Tons)
- TABLE 44 France phosgene market size, by application, 2018 - 2032 (USD Billion)
- TABLE 45 France phosgene market size, by application, 2018 - 2032 (Kilo Tons)
- TABLE 46 Spain phosgene market size, by derivative, 2018 - 2032 (USD Billion)
- TABLE 47 Spain phosgene market size, by derivative, 2018 - 2032 (Kilo Tons)
- TABLE 48 Spain phosgene market size, by application, 2018 - 2032 (USD Billion)
- TABLE 49 Spain phosgene market size, by application, 2018 - 2032 (Kilo Tons)
- TABLE 50 Italy phosgene market size, by derivative, 2018 - 2032 (USD Billion)
- TABLE 51 Italy phosgene market size, by derivative, 2018 - 2032 (Kilo Tons)
- TABLE 52 Italy phosgene market size, by application, 2018 - 2032 (USD Billion)
- TABLE 53 Italy phosgene market size, by application, 2018 - 2032 (Kilo Tons)
- TABLE 54 Asia Pacific phosgene market size, by country, 2018 - 2032 (USD Billion)
- TABLE 55 Asia Pacific phosgene market size, by country, 2018 - 2032 (Kilo Tons)
- TABLE 56 Asia Pacific phosgene market size, by derivative, 2018 - 2032 (USD Billion)
- TABLE 57 Asia Pacific phosgene market size, by derivative, 2018 - 2032 (Kilo Tons)
- TABLE 58 Asia Pacific phosgene market size, by application, 2018 - 2032 (USD Billion)
- TABLE 59 Asia Pacific phosgene market size, by application, 2018 - 2032 (Kilo Tons)
- TABLE 60 China phosgene market size, by derivative, 2018 - 2032 (USD Billion)
- TABLE 61 China phosgene market size, by derivative, 2018 - 2032 (Kilo Tons)
- TABLE 62 China phosgene market size, by application, 2018 - 2032 (USD Billion)
- TABLE 63 China phosgene market size, by application, 2018 - 2032 (Kilo Tons)
- TABLE 64 Japan phosgene market size, by derivative, 2018 - 2032 (USD Billion)
- TABLE 65 Japan phosgene market size, by derivative, 2018 - 2032 (Kilo Tons)
- TABLE 66 Japan phosgene market size, by application, 2018 - 2032 (USD Billion)
- TABLE 67 Japan phosgene market size, by application, 2018 - 2032 (Kilo Tons)
- TABLE 68 India phosgene market size, by derivative, 2018 - 2032 (USD Billion)
- TABLE 69 India phosgene market size, by derivative, 2018 - 2032 (Kilo Tons)
- TABLE 70 India phosgene market size, by application, 2018 - 2032 (USD Billion)
- TABLE 71 India phosgene market size, by application, 2018 - 2032 (Kilo Tons)
- TABLE 72 Australia phosgene market size, by derivative, 2018 - 2032 (USD Billion)
- TABLE 73 Australia phosgene market size, by derivative, 2018 - 2032 (Kilo Tons)
- TABLE 74 Australia phosgene market size, by application, 2018 - 2032 (USD Billion)
- TABLE 75 Australia phosgene market size, by application, 2018 - 2032 (Kilo Tons)
- TABLE 76 South Korea phosgene market size, by derivative, 2018 - 2032 (USD Billion)
- TABLE 77 South Korea phosgene market size, by derivative, 2018 - 2032 (Kilo Tons)
- TABLE 78 South Korea phosgene market size, by application, 2018 - 2032 (USD Billion)
- TABLE 79 South Korea phosgene market size, by application, 2018 - 2032 (Kilo Tons)
- TABLE 80 Indonesia phosgene market size, by derivative, 2018 - 2032 (USD Billion)
- TABLE 81 Indonesia phosgene market size, by derivative, 2018 - 2032 (Kilo Tons)
- TABLE 82 Indonesia phosgene market size, by application, 2018 - 2032 (USD Billion)
- TABLE 83 Indonesia phosgene market size, by application, 2018 - 2032 (Kilo Tons)
- TABLE 84 Malaysia phosgene market size, by derivative, 2018 - 2032 (USD Billion)
- TABLE 85 Malaysia phosgene market size, by derivative, 2018 - 2032 (Kilo Tons)
- TABLE 86 Malaysia phosgene market size, by application, 2018 - 2032 (USD Billion)
- TABLE 87 Malaysia phosgene market size, by application, 2018 - 2032 (Kilo Tons)
- TABLE 88 Latin America phosgene market size, by country, 2018 - 2032 (USD Billion)
- TABLE 89 Latin America phosgene market size, by country, 2018 - 2032 (Kilo Tons)
- TABLE 90 Latin America phosgene market size, by derivative, 2018 - 2032 (USD Billion)
- TABLE 91 Latin America phosgene market size, by derivative, 2018 - 2032 (Kilo Tons)
- TABLE 92 Latin America phosgene market size, by application, 2018 - 2032 (USD Billion)
- TABLE 93 Latin America phosgene market size, by application, 2018 - 2032 (Kilo Tons)
- TABLE 94 Brazil phosgene market size, by derivative, 2018 - 2032 (USD Billion)
- TABLE 95 Brazil phosgene market size, by derivative, 2018 - 2032 (Kilo Tons)
- TABLE 96 Brazil phosgene market size, by application, 2018 - 2032 (USD Billion)
- TABLE 97 Brazil phosgene market size, by application, 2018 - 2032 (Kilo Tons)
- TABLE 98 Mexico phosgene market size, by derivative, 2018 - 2032 (USD Billion)
- TABLE 99 Mexico phosgene market size, by derivative, 2018 - 2032 (Kilo Tons)
- TABLE 100 Mexico phosgene market size, by application, 2018 - 2032 (USD Billion)
- TABLE 101 Mexico phosgene market size, by application, 2018 - 2032 (Kilo Tons)
- TABLE 102 Argentina phosgene market size, by derivative, 2018 - 2032 (USD Billion)
- TABLE 103 Argentina phosgene market size, by derivative, 2018 - 2032 (Kilo Tons)
- TABLE 104 Argentina phosgene market size, by application, 2018 - 2032 (USD Billion)
- TABLE 105 Argentina phosgene market size, by application, 2018 - 2032 (Kilo Tons)
- TABLE 106 MEA phosgene market size, by country, 2018 - 2032 (USD Billion)
- TABLE 107 MEA phosgene market size, by country, 2018 - 2032 (Kilo Tons)
- TABLE 108 MEA phosgene market size, by derivative, 2018 - 2032 (USD Billion)
- TABLE 109 MEA phosgene market size, by derivative, 2018 - 2032 (Kilo Tons)
- TABLE 110 MEA phosgene market size, by application, 2018 - 2032 (USD Billion)
- TABLE 111 MEA phosgene market size, by application, 2018 - 2032 (Kilo Tons)
- TABLE 112 South Africa phosgene market size, by derivative, 2018 - 2032 (USD Billion)
- TABLE 113 South Africa phosgene market size, by derivative, 2018 - 2032 (Kilo Tons)
- TABLE 114 South Africa phosgene market size, by application, 2018 - 2032 (USD Billion)
- TABLE 115 South Africa phosgene market size, by application, 2018 - 2032 (Kilo Tons)
- TABLE 116 Saudi Arabia phosgene market size, by derivative, 2018 - 2032 (USD Billion)
- TABLE 117 Saudi Arabia phosgene market size, by derivative, 2018 - 2032 (Kilo Tons)
- TABLE 118 Saudi Arabia phosgene market size, by application, 2018 - 2032 (USD Billion)
- TABLE 119 Saudi Arabia phosgene market size, by application, 2018 - 2032 (Kilo Tons)
- TABLE 120 UAE phosgene market size, by derivative, 2018 - 2032 (USD Billion)
- TABLE 121 UAE phosgene market size, by derivative, 2018 - 2032 (Kilo Tons)
- TABLE 122 UAE phosgene market size, by application, 2018 - 2032 (USD Billion)
- TABLE 123 UAE phosgene market size, by application, 2018 - 2032 (Kilo Tons)
- TABLE 124 Egypt phosgene market size, by derivative, 2018 - 2032 (USD Billion)
- TABLE 125 Egypt phosgene market size, by derivative, 2018 - 2032 (Kilo Tons)
- TABLE 126 Egypt phosgene market size, by application, 2018 - 2032 (USD Billion)
- TABLE 127 Egypt phosgene market size, by application, 2018 - 2032 (Kilo Tons)
Charts & Figures
- FIG. 1 Industry segmentation
- FIG. 2 Market estimation and forecast methodology
- FIG. 3 Breakdown of primary participants
- FIG. 4 Phosgene industry, 360o synopsis, 2018 - 2032
- FIG. 5 Industry landscape, 2018-2032 (USD Million)
- FIG. 6 Growth potential analysis
- FIG. 7 Porter's analysis
- FIG. 8 PESTEL analysis
- FIG. 9 Company matrix analysis, 2022
- FIG. 10 Strategy dashboard, 2022
Phosgene market size is predicted to witness 5.5% CAGR from 2023 to 2032 attributed to the rising demand for the product's derivatives in the manufacturing of various chemicals and materials. It is widely used in the production of pesticides, herbicides, and pharmaceutical intermediates. For instance, there is increasing usage and subsequent production of polyurethanes that requires isocyanates, a phosgene derivative, as a raw material.
Moreover, the burgeoning automotive and construction industries are further fueling the demand for phosgene-based products, leading to a positive market outlook. According to the data by the European Automobile Manufacturers' Association, in 2022, 85.4 million motor vehicles were produced across the globe.
The overall phosgene market is divided based on derivatives, application, and region.
The chloroformates derivative segment expected to generate high revenues by 2032 owing to the rapid expansion of the pharmaceutical and chemical industries. Chloroformate derivatives have witnessed a significant upsurge in demand as they are extensively utilized in the synthesis of various chemicals, including dyes, agrochemicals, and pharmaceuticals. The growing focus on sustainable chemical synthesis processes will further stimulate the segment growth.
The polycarbonates application segment is anticipated to observe high CAGR from 2023 to 2032 due to the exceptional durability, high impact resistance, and optical clarity offered by phosgene to the products. Polycarbonates find widespread application across several sectors like automotive, electrical and electronics, and construction. The increasing demand for lightweight and durable materials in these sectors has significantly boosted the consumption of polycarbonates, thereby adding to the market revenues.
Asia Pacific phosgene market size will grow at a notable rate through 2032, owing to the rapid industrialization and burgeoning chemical sector in countries such as China, India, and Japan. The growing population, coupled with the rising disposable income and urbanization, has fueled the demand for consumer goods, that utilize phosgene-based products. Additionally, the expanding automotive and electronics industries in the region have further augmented the usage of phosgene for various applications, boosting the phosgene market development in the coming years.
Table of Contents
Chapter 1 Methodology & Scope
- 1.1 Industry coverage
- 1.2 Market scope & definition
- 1.3 Base estimates & calculations
- 1.3.1 Data collection
- 1.4 Forecast parameters
- 1.5 COVID-19 impact analysis at global level
- 1.6 Data validation
- 1.7 Data Sources
- 1.7.1 Primary
- 1.7.2 Secondary
- 1.7.2.1 Paid sources
- 1.7.2.2 Unpaid sources
Chapter 2 Executive Summary
- 2.1 Phosgene industry 360 degree synopsis, 2018 - 2032
- 2.2 Business trends
- 2.3 Derivative trends
- 2.4 Application trends
- 2.5 Regional trends
Chapter 3 Phosgene Industry Insights
- 3.1 Industry ecosystem analysis
- 3.2 Industry impact forces
- 3.2.1 Growth drivers
- 3.2.2 Industry pitfalls & challenges
- 3.3 Growth potential analysis
- 3.3.1 By derivative
- 3.3.2 By application
- 3.4 COVID- 19 impact analysis
- 3.5 Regulatory landscape
- 3.5.1 U.S.
- 3.5.2 Europe
- 3.6 Pricing analysis, 2022
- 3.7 Technology landscape
- 3.7.1 Future market trends
- 3.8 Porter's analysis
- 3.9 PESTEL analysis
- 3.10 Impact of Russia Ukraine war
Chapter 4 Competitive Landscape, 2022
- 4.1 Introduction
- 4.2 Company matrix analysis, 2022
- 4.3 Global company market share analysis, 2022
- 4.4 Competitive positioning matrix
- 4.5 Strategy dashboard
Chapter 5 Phosgene Market Size and Forecast, By Derivative 2018 - 2032
- 5.1 Isocyanates
- 5.2 Chloroformates
- 5.3 Carbamoyl Chlorides
- 5.4 Others
Chapter 6 Phosgene Market Size and Forecast, By Application 2018 - 2032
- 6.1 Agrochemicals
- 6.2 Polycarbonates
- 6.3 Pharmaceuticals
- 6.4 Fine Chemicals
- 6.5 Dyes
- 6.6 Specialty Chemicals
- 6.7 Others
Chapter 7 Phosgene Market Size and Forecast, By Region 2018 - 2032
- 7.1 Key trends, by region
- 7.2 North America
- 7.2.1 U.S.
- 7.2.2 Canada
- 7.3 Europe
- 7.3.1 Germany
- 7.3.2 UK
- 7.3.3 France
- 7.3.4 Spain
- 7.3.5 Italy
- 7.4 Asia Pacific
- 7.4.1 Japan
- 7.4.2 China
- 7.4.3 India
- 7.4.4 Australia
- 7.4.5 South Korea
- 7.4.6 Indonesia
- 7.4.7 Malaysia
- 7.5 Latin America
- 7.5.1 Brazil
- 7.5.2 Mexico
- 7.5.3 Argentina
- 7.6 MEA
- 7.6.1 South Africa
- 7.6.2 Saudi Arabia
- 7.6.3 UAE
- 7.6.4 Egypt
Chapter 8 Company Profiles
- 8.1 BASF SE
- 8.2 Covestro AG
- 8.3 Dow Inc.
- 8.4 Huntsman Corporation
- 8.5 Wanhua Chemical Group Co., Ltd.
- 8.6 OCI Company Ltd.
- 8.7 Puyang Shenghuade Chemical Co., Ltd.
- 8.8 Jilin Tely Chemical Co., Ltd.
- 8.9 Chongqing Changshou Chemical Co., Ltd.
- 8.10 Shandong Lantian Disinfection Technology Co., Ltd.
- 8.11 Shandong Tianhong Chemical Co., Ltd.
- 8.12 Shandong Fine Chemical Co., Ltd.
- 8.13 Yuneng Chemical Co., Ltd.
- 8.14 Shandong Luyue Chemical Co., Ltd.
- 8.15 Xuzhou JianPing Chemical Co., Ltd.
