
|
市場調査レポート
商品コード
1844329
洋上風力ケーブルの市場機会、成長促進要因、産業動向分析、2025~2034年予測Offshore Wind Cable Market Opportunity, Growth Drivers, Industry Trend Analysis, and Forecast 2025 - 2034 |
||||||
カスタマイズ可能
|
|||||||
| 洋上風力ケーブルの市場機会、成長促進要因、産業動向分析、2025~2034年予測 |
|
出版日: 2025年09月24日
発行: Global Market Insights Inc.
ページ情報: 英文 130 Pages
納期: 2~3営業日
|

概要
世界の洋上風力ケーブル市場は、2024年には35億米ドルとなり、CAGR 28.2%で成長し、2034年には399億米ドルに達すると推定されています。
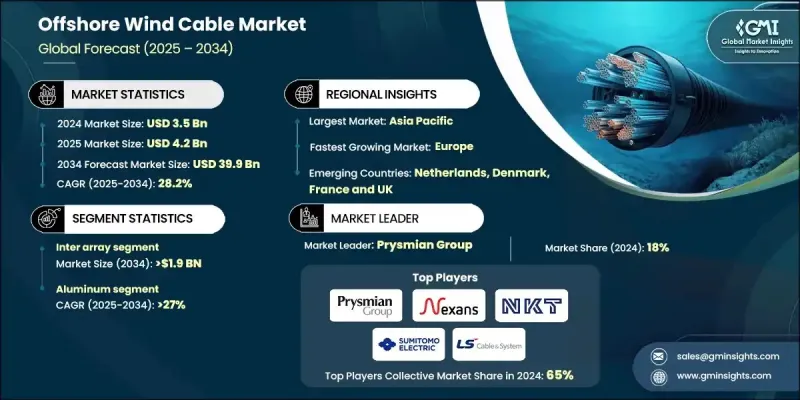
成長の原動力となっているのは、ケーブル製造・敷設技術の急速な進歩による運用コストの継続的な低下で、大規模洋上風力発電プロジェクトをより経済的に実現可能なものにしています。協力関係や進化するロジスティクスの枠組みがケーブルへのアクセスを改善し、市場力学をさらに強化しています。環境規制が強化されるにつれて、持続可能で環境に配慮した海底ケーブル・ソリューションの設計を推進する動きが強まっています。業界のリーダーたちは、環境破壊を最小限に抑えるため、ケーブルのリサイクルと再利用を採用しています。生産・配備方法全体の標準化は一貫性と性能を高め、コスト管理と長期信頼性の向上につながります。再生可能エネルギー開発に対する政府の優遇措置や財政支援は、洋上風力インフラの展開をさらに加速させています。洋上風力発電所設置の増加により、洋上で発電された電力を陸上の送電網に確実に送電するための強固な海底接続が必要となり、より広範なエネルギー展望における風力ケーブルの戦略的重要性が高まっています。メーカーが回復力と拡張性を目指す中、洋上風力ケーブル業界は世界的にかつてない投資と拡大を目の当たりにしています。
| 市場範囲 | |
|---|---|
| 開始年 | 2024 |
| 予測年 | 2025-2034 |
| 市場規模 | 35億米ドル |
| 予測金額 | 399億米ドル |
| CAGR | 28.2% |
アレイ間ケーブル分野は、大容量の再生可能エネルギー施設の設置増加や深海開発のためのエンジニアリング技術の進歩に後押しされ、2034年には19億米ドルに達すると予測されています。メーカー各社は、メンテナンスと運用の中断を最小限に抑えることに注力する一方、設置費用の削減にも取り組んでいます。送電ロスの低減やプロジェクト実行コストの削減など、有利な特性により、アレイ間ケーブルはオフショア・オペレーターにとって好ましい選択肢となっています。
銅の分野は2034年には375億米ドルに達します。銅の高い耐久性、卓越した導電性、海底条件下での耐腐食性が、オフショア設備での銅の普及を後押ししています。サージ負荷や過酷な環境にも耐え、高電圧アレイ間システムに理想的です。66kVのアレイ間システムの統合が進んでおり、それは主に銅ベースであるため、今後10年間のセグメント成長をさらに後押しすると予想されます。
米国洋上風力ケーブル2024年の市場規模は5億1,000万米ドル。大規模な再生可能エネルギーへの取り組みの高まりと、オフショアゾーンにおける大きな技術力が相まって、米国は主要なプレーヤーとして位置づけられています。風力ケーブル・システムとともにバンドル・サービスを提供する需要や、エンジニアリングの専門知識を拡大する取り組みが、北米市場の今後の勢いを支えています。
洋上風力ケーブル業界を牽引する主要企業には、住友電気工業、ZTT、KEI Industries、C.S. Cable Corp.、Seaway7、NKT A/S、Cavicel、LEONI、Hydro Group、Nexans、Prysmian Group、KEC International、古河電気工業、フジクラ、JDR Cable Systems、Hellenic Cables、Ningbo Orient Wires &Cables、Orient Cable、Hengtong Group、LS Cable &Systemなどがあります。これらの企業は、製造能力を積極的に拡大し、新興風力市場全体でグローバルなプレゼンスを強化しています。洋上風力ケーブル市場の主要企業は、地域の製造ハブを設立し、長期供給契約を確保することで、積極的にグローバル事業を拡大しています。信頼性と性能を向上させるため、各社は過酷な海底条件下でも使用可能な高圧ケーブルシステムを開発するための研究開発に投資しています。また、リサイクル可能な素材や環境に優しいケーブル設計に重点を置くなど、持続可能性も重視されています。戦略的提携や合併により、先端技術へのアクセスが可能になり、開発リスクも軽減されています。
よくあるご質問
目次
第1章 調査手法と範囲
第2章 エグゼクティブサマリー
第3章 業界考察
- 業界エコシステム
- 規制情勢
- 業界への影響要因
- 促進要因
- 業界の潜在的リスク&課題
- 成長可能性分析
- 主要な洋上風力発電プロジェクト
- 運用
- 提案
- 価格動向分析, 2021-2034
- 導体材料別
- 地域別
- ポーターの分析
- 供給企業の交渉力
- 買い手の交渉力
- 新規参入業者の脅威
- 代替品の脅威
- PESTEL分析
第4章 競合情勢
- イントロダクション
- 企業の市場シェア分析:地域別
- 北米
- 欧州
- アジア太平洋地域
- 戦略的ダッシュボード
- 戦略的取り組み
- 企業ベンチマーク
- イノベーションとテクノロジーの情勢
第5章 市場規模・予測:最終用途別、2021-2034
- 主要動向
- アレイ間
- 11kV~33kV
- 34kV~66kV
- 輸出
- 132 kV以下
- 132 kV以上
第6章 市場規模・予測:導体材質別、2021-2034
- 主要動向
- アルミニウム
- 銅
第7章 市場規模・予測:地域別、2021-2034
- 主要動向
- 北米
- 米国
- カナダ
- 欧州
- 英国
- ドイツ
- デンマーク
- フランス
- オランダ
- ベルギー
- アジア太平洋地域
- 中国
- 日本
- 韓国
- ベトナム
- 台湾
- 世界のその他の地域
第8章 企業プロファイル
- Cavicel
- C.S. Cable Corp.
- Furukawa Electric
- Fujikura Ltd.
- Hellenic Cables
- Hengtong Group
- Hydro Group
- JDR Cable Systems
- KEI Industries
- KEC International
- LS Cable &System
- LEONI
- Prysmian Group
- Orient Cable
- NEXANS
- NKT A/S
- Ningbo Orient Wires &Cables
- Seaway7
- Sumitomo Electric Industries
- ZTT

