
|
市場調査レポート
商品コード
1667018
ファイバーセメント市場の機会、成長促進要因、産業動向分析、2025~2034年の予測Fiber Cement Market Opportunity, Growth Drivers, Industry Trend Analysis, and Forecast 2025 - 2034 |
||||||
カスタマイズ可能
|
|||||||
| ファイバーセメント市場の機会、成長促進要因、産業動向分析、2025~2034年の予測 |
|
出版日: 2024年12月26日
発行: Global Market Insights Inc.
ページ情報: 英文 220 Pages
納期: 2~3営業日
|

全表示
- 概要
- 目次
ファイバーセメントの世界市場は2024年に150億米ドルと評価され、2025年から2034年までのCAGRが5%と予想され、大幅な成長が見込まれています。
この好況は、持続可能で耐久性のある建設資材に対する需要の増加、特に産業が環境に優しい代替品にシフトしていることが背景にあります。ファイバーセメントは、その強度、汎用性、環境負荷の低さが評価され、住宅、商業、工業建設を含む様々な分野で広く採用されています。消費者や建築関係者が環境に優しい建築方法を優先し続ける中、ファイバーセメントの人気は急上昇しています。費用対効果と厳しい気象条件下での優れた性能兼ね備えているため、現代の建設プロジェクトに最適なソリューションとなっています。耐久性に加えて、ファイバーセメントは、低メンテナンスや長期間にわたる風雨からの保護といった大きな利点もあり、環境意識の高い建築業者にとって最良の選択肢としての地位を確固たるものにしています。
市場は製品タイプ別に分けられ、主なカテゴリーにはセルロース繊維系、合成繊維系、鉱物繊維系、その他があります。このうち、セルロース繊維ベースのセグメントがリードし、2024年には約60億米ドルを生み出すと予想されています。この分野は、再生可能で生分解性のある素材に対する需要の高まりの恩恵を受けて、予測期間中にCAGR 5.2%で成長すると予測されています。植物由来の繊維から作られるセルロース系ファイバーセメントは、その環境に優しい性質から支持を集めており、持続可能性が建築の最優先事項になりつつある現在、特に魅力的な材料となっています。セルロース繊維のリサイクル性、生分解性、再生可能な特性は、建築業界がカーボンフットプリントの削減に取り組む中で、このセグメントの成長に貢献し続けています。
| 市場範囲 | |
|---|---|
| 開始年 | 2024 |
| 予測年 | 2025-2034 |
| 開始金額 | 150億米ドル |
| 予測金額 | 242億米ドル |
| CAGR | 5% |
ファイバーセメントの用途としては、サイディング、屋根材、モールディングとトリム、床材などがあります。なかでもサイディング分野が最も顕著で、2024年の市場シェア全体の約40%を占めています。成長率は市場全体のCAGR 5%に匹敵すると予想され、ファイバーセメントサイディングは異常気象に見舞われやすい地域で好まれる選択肢になりつつあります。耐久性に優れ、腐朽、シロアリ、湿気に強いことで知られるファイバーセメントサイディングは、頻繁なメンテナンスと治療が必要な従来の木材に代わる優れた選択肢です。耐用年数が長く、メンテナンスの必要性が低いことから、建設業者や住宅所有者はファイバーセメントサイディングを選ぶ傾向が強まっており、持続可能で耐候性の高い建築方法として理想的なソリューションとなっています。
米国のファイバーセメント市場は最大級の市場であり、2024年のシェアは82%に達します。このような強い市場プレゼンスは、持続可能性認証を目指すプロジェクトが増えるにつれて、グリーン建築材料に対する需要が高まっていることに起因しています。ファイバーセメントは、砂、セメント、セルロースファイバーなどの天然素材で構成されているため、木材やビニールのような炭素を多く含む材料に代わる、より環境に優しい材料として注目されています。この素材のリサイクル可能性、生産時の環境負荷の低さ、耐用年数の長さは、グリーン・コンストラクションの高まる動向において重要なセールスポイントとなっています。環境に配慮した建築の推進は、ファイバーセメントの需要を牽引し続け、今後数年間の継続的成長と普及を確実なものにすると予想されます。
目次
第1章 調査手法と調査範囲
- 市場範囲と定義
- 基本推定と計算
- 予測計算
- データソース
- 1次データ
- 2次データ
- 有料情報源
- 公的情報源
第2章 エグゼクティブサマリー
第3章 業界洞察
- エコシステム分析
- バリューチェーンに影響を与える要因
- 利益率分析
- 破壊
- 将来の展望
- メーカー
- 流通業者
- サプライヤーの状況
- 利益率分析
- 主要ニュース
- 規制状況
- 影響要因
- 促進要因
- 建設活動の増加
- 製品革新の進展
- 業界の潜在的リスク&課題
- 市場の飽和と激しい競合
- 持続可能性への懸念
- 促進要因
- 成長可能性分析
- ポーターの分析
- PESTEL分析
第4章 競合情勢
- イントロダクション
- 企業シェア分析
- 競合のポジショニング・マトリックス
- 戦略展望マトリックス
第5章 市場推計・予測:製品タイプ別、2021年~2034年
- 主要動向
- セルロース繊維ベース
- 合成繊維ベース
- 鉱物繊維ベース
- その他(天然繊維ベースなど)
第6章 市場推計・予測:用途別、2021年~2034年
- 主要動向
- サイディング
- 屋根材
- モールディング&トリム
- フローリング
- その他
第7章 市場推計・予測:最終用途別、2021年~2034年
- 主要動向
- 住宅用
- 商業用
- 産業用
第8章 市場推計・予測:流通チャネル別、2021年~2034年
- 主要動向
- 直接販売
- 間接販売
第9章 市場推計・予測:地域別、2021年~2034年
- 主要動向
- 北米
- 米国
- カナダ
- 欧州
- 英国
- ドイツ
- フランス
- イタリア
- スペイン
- ロシア
- アジア太平洋
- 中国
- インド
- 日本
- 韓国
- オーストラリア
- ラテンアメリカ
- ブラジル
- メキシコ
- 中東・アフリカ
- UAE
- サウジアラビア
- 南アフリカ
第10章 企業プロファイル
- ArcelorMittal
- Boral Limited
- China National Building Material
- CSR Limited
- Etex Group
- Everest Industries Limited
- Finolex Industries
- Hume Cement
- James Hardie Industries
- Mahaphant Fibre Cement Public
- Nichiha Corporation
- Pioneer Cement Limited
- Saint-Gobain
- Siam Cement Group
- Toray Industries
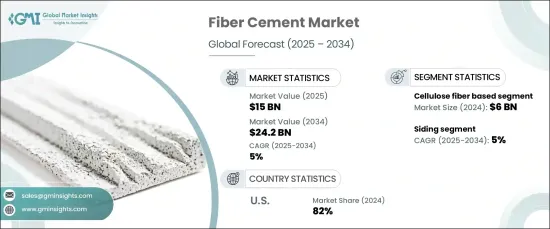
The Global Fiber Cement Market, valued at USD 15 billion in 2024, is set for substantial growth with an anticipated CAGR of 5% from 2025 to 2034. This positive trajectory is being driven by the increasing demand for sustainable, durable construction materials, especially as industries shift toward eco-friendly alternatives. Fiber cement, recognized for its strength, versatility, and low environmental impact, has garnered widespread adoption across diverse sectors, including residential, commercial, and industrial construction. As consumers and construction professionals continue to prioritize green building practices, fiber cement's popularity has surged. Its ability to combine cost-effectiveness with exceptional performance in harsh weather conditions makes it a go-to solution for modern construction projects. In addition to being durable, fiber cement also offers significant advantages, such as low maintenance and long-lasting protection against the elements, solidifying its position as a prime choice for eco-conscious builders.
The market is divided by product type, with key categories including cellulose fiber-based, synthetic fiber-based, mineral fiber-based, and others. Among these, the cellulose fiber-based segment is expected to lead, generating approximately USD 6 billion in 2024. This segment is projected to grow at a CAGR of 5.2% over the forecast period, benefiting from the rising demand for renewable and biodegradable materials. Made from plant-derived fibers, cellulose-based fiber cement is gaining traction due to its eco-friendly nature, making it particularly appealing in an age when sustainability is becoming a top priority in construction. The cellulose fibers' recyclability, biodegradability, and renewable properties continue to contribute to the segment's growth as the building industry looks to reduce its carbon footprint.
| Market Scope | |
|---|---|
| Start Year | 2024 |
| Forecast Year | 2025-2034 |
| Start Value | $15 Billion |
| Forecast Value | $24.2 Billion |
| CAGR | 5% |
When it comes to applications, fiber cement is used in siding, roofing, molding and trim, flooring, and more. Of these, the siding segment is the most prominent, accounting for approximately 40% of the total market share in 2024. With a growth rate expected to match the overall market at a CAGR of 5%, fiber cement siding is becoming the preferred option in areas prone to extreme weather conditions. Renowned for its durability and resistance to rot, termites, and moisture, fiber cement siding provides an excellent alternative to traditional wood, which requires frequent maintenance and treatment. Builders and homeowners are increasingly opting for fiber cement siding due to its long lifespan and low maintenance needs, making it an ideal solution for sustainable, weather-resistant building practices.
The U.S. market for fiber cement is one of the largest, holding an impressive 82% share in 2024. This strong market presence is attributed to the rising demand for green building materials as more projects aim for sustainability certifications. Fiber cement is seen as a more eco-friendly alternative to carbon-heavy materials like wood and vinyl, thanks to its composition of natural materials such as sand, cement, and cellulose fibers. The material's recyclability, lower environmental impact during production, and longevity are key selling points in the growing trend of green construction. The push for eco-conscious construction is expected to keep driving demand for fiber cement, ensuring its continued growth and widespread adoption in the coming years.
Table of Contents
Chapter 1 Methodology & Scope
- 1.1 Market scope & definitions
- 1.2 Base estimates & calculations
- 1.3 Forecast calculations
- 1.4 Data sources
- 1.4.1 Primary
- 1.4.2 Secondary
- 1.4.2.1 Paid sources
- 1.4.2.2 Public sources
Chapter 2 Executive Summary
- 2.1 Industry synopsis, 2021-2034
Chapter 3 Industry Insights
- 3.1 Industry ecosystem analysis
- 3.1.1 Factor affecting the value chain
- 3.1.2 Profit margin analysis
- 3.1.3 Disruptions
- 3.1.4 Future outlook
- 3.1.5 Manufacturers
- 3.1.6 Distributors
- 3.2 Supplier landscape
- 3.3 Profit margin analysis
- 3.4 Key news & initiatives
- 3.5 Regulatory landscape
- 3.6 Impact forces
- 3.6.1 Growth drivers
- 3.6.1.1 Increasing construction activities
- 3.6.1.2 Growing product innovation
- 3.6.2 Industry pitfalls & challenges
- 3.6.2.1 Market saturation and intense competition
- 3.6.2.2 Sustainability concerns
- 3.6.1 Growth drivers
- 3.7 Growth potential analysis
- 3.8 Porter’s analysis
- 3.9 PESTEL analysis
Chapter 4 Competitive Landscape, 2024
- 4.1 Introduction
- 4.2 Company market share analysis
- 4.3 Competitive positioning matrix
- 4.4 Strategic outlook matrix
Chapter 5 Market Estimates & Forecast, By Product Type, 2021-2034 (USD Million) (Kilo Tons)
- 5.1 Key trends
- 5.2 Cellulose fiber based
- 5.3 Synthetic fiber based
- 5.4 Mineral fiber based
- 5.5 Others (natural fiber based, etc.)
Chapter 6 Market Estimates & Forecast, By Application, 2021-2034 (USD Million) (Kilo Tons)
- 6.1 Key trends
- 6.2 Siding
- 6.3 Roofing
- 6.4 Molding & trim
- 6.5 Flooring
- 6.6 Others
Chapter 7 Market Estimates & Forecast, By End Use, 2021-2034 (USD Million) (Kilo Tons)
- 7.1 Key trends
- 7.2 Residential
- 7.3 Commercial
- 7.4 Industrial
Chapter 8 Market Estimates & Forecast, By Distribution Channel, 2021-2034 (USD Million) (Kilo Tons)
- 8.1 Key trends
- 8.2 Direct
- 8.3 Indirect
Chapter 9 Market Estimates & Forecast, By Region, 2021-2034 (USD Million) (Kilo Tons)
- 9.1 Key trends
- 9.2 North America
- 9.2.1 U.S.
- 9.2.2 Canada
- 9.3 Europe
- 9.3.1 UK
- 9.3.2 Germany
- 9.3.3 France
- 9.3.4 Italy
- 9.3.5 Spain
- 9.3.6 Russia
- 9.4 Asia Pacific
- 9.4.1 China
- 9.4.2 India
- 9.4.3 Japan
- 9.4.4 South Korea
- 9.4.5 Australia
- 9.5 Latin America
- 9.5.1 Brazil
- 9.5.2 Mexico
- 9.6 MEA
- 9.6.1 UAE
- 9.6.2 Saudi Arabia
- 9.6.3 South Africa
Chapter 10 Company Profiles
- 10.1 ArcelorMittal
- 10.2 Boral Limited
- 10.3 China National Building Material
- 10.4 CSR Limited
- 10.5 Etex Group
- 10.6 Everest Industries Limited
- 10.7 Finolex Industries
- 10.8 Hume Cement
- 10.9 James Hardie Industries
- 10.10 Mahaphant Fibre Cement Public
- 10.11 Nichiha Corporation
- 10.12 Pioneer Cement Limited
- 10.13 Saint-Gobain
- 10.14 Siam Cement Group
- 10.15 Toray Industries

