|
|
市場調査レポート
商品コード
1359550
PVDF膜市場規模:素材タイプ別、技術別、最終用途別&予測、2023年~2032年PVDF Membrane Market Size - By Material Type, By Technology (Microfiltration PVDF Membrane, Ultrafiltration PVDF Membrane, Nanofiltration PVDF Membrane), By End-use & Forecast, 2023 - 2032 |
||||||
|
|
|||||||
カスタマイズ可能
|
|||||||


| PVDF膜市場規模:素材タイプ別、技術別、最終用途別&予測、2023年~2032年 |
|
出版日: 2023年08月08日
発行: Global Market Insights Inc.
ページ情報: 英文 150 Pages
納期: 2~3営業日
|

- 全表示
- 概要
- 図表
- 目次
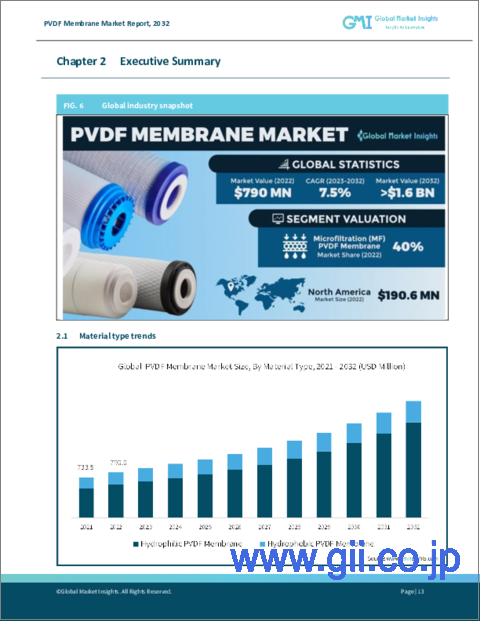
PVDF膜の世界市場規模は2023年から2032年までCAGR 7.5%で拡大、エレクトロニクス分野の健全な成長が原動力2022-23年経済調査によると、インドのエレクトロニクス産業は2020年度に1,180億米ドルとなり、携帯電話、家電、産業用エレクトロニクスが牽引して着実に進展しています。
23年度(4月~11月)のエレクトロニクス輸出は13.8%増と急増し、過去6年間で最高の伸びを記録しました。インドはこの力強い成長軌道に後押しされ、26年度までに電子機器輸出1,200億米ドルの達成を目指しています。
PVDF膜は、半導体製造や電子機器組立における濾過や分離工程など、エレクトロニクス分野で幅広く使用されています。エレクトロニクス産業が力強い成長を続けるなか、さまざまなプロセスで重要な役割を果たすPVDF膜の需要が高まり、市場拡大の原動力となることが予想されます。
PVDF膜市場全体は、材料タイプ、技術、最終用途、地域によって分類されます。
疎水性PVDF膜の優れた撥水特性により、疎水性PVDF膜産業は2032年までに大きな評価を示すと思われます。疎水性PVDF膜は、水処理、廃水処理、製薬、バイオテクノロジー用途で高い需要があります。その疎水性により、非水性物質をろ過・分離することができるため、さまざまな工業プロセスや研究用途に不可欠です。産業界が効率的で信頼性の高いろ過ソリューションを求め続ける中、疎水性PVDF膜の需要は依然として高いです。
2032年までのPVDF膜市場シェアは、飲食品分野で小幅にとどまると思われます。飲食品業界におけるPVDF(ポリフッ化ビニリデン)膜の需要は、その優れた耐薬品性、耐久性、製品品質維持能力によって牽引されています。PVDF膜はろ過や分離プロセスに使用され、飲食品から汚染物質、微生物、不純物を確実に除去します。これは製品の安全性を維持し、賞味期限を延ばすために極めて重要であり、PVDF膜は高品質な食品・飲料の生産に不可欠なものとなっています。
アジア太平洋地域の PVDF 膜産業は、人口の多い国でのきれいな水の需要の増加、急速な工業化、製薬およびバイオテクノロジー分野の拡大により、2023年から2032年にかけて大幅な成長を示すと予想されます。 さらに、厳しい環境規制と水と空気の浄化に対する意識の高まりがPVDF膜の需要を後押ししており、アジア太平洋市場はこの技術の高成長拠点となっています。
目次
第1章 調査手法と調査範囲
第2章 エグゼクティブサマリー
第3章 PVDF膜、産業洞察
- エコシステム分析
- 業界への影響要因
- 成長促進要因
- 業界の潜在的リスク&課題
- 成長の可能性分析
- COVID-19の影響分析
- 規制状況
- 米国
- 欧州
- 価格分析、2022年
- 償還シナリオ
- 技術展望
- 今後の市場動向
- ポーターの分析
- PESTEL分析
- ロシア・ウクライナ戦争の影響
第4章 競合情勢
- イントロダクション
- 企業マトリックス分析
- 世界企業市場シェア分析
- 競合のポジショニングマトリックス
- 戦略ダッシュボード
第5章 PVDF膜の市場規模・予測:素材タイプ別、2018年~2032年
- 親水性PVDF膜
- 疎水性PVDF膜
第6章 PVDF膜の市場規模・予測:技術別、2018年~2032年
- 精密ろ過(MF)PVDF膜
- 限外ろ過(UF)PVDF膜
- ナノろ過(NF)PVDF膜
- その他
第7章 PVDF膜の市場規模・予測:最終用途別、2018年~2032年
- 医薬品・バイオテクノロジー
- 食品・飲料
- エレクトロニクス・半導体
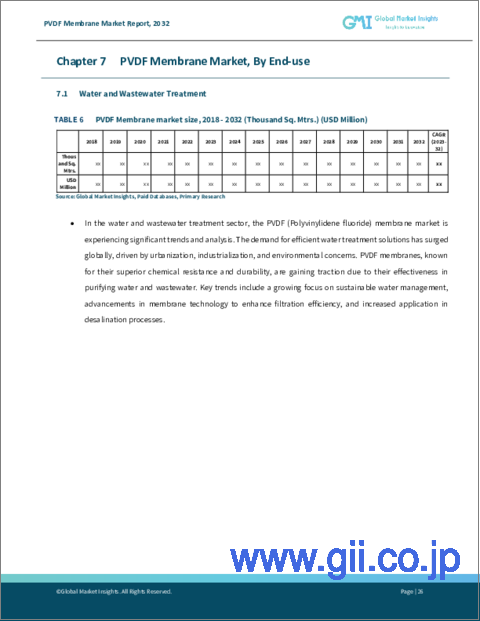
- 水処理・廃水処理
- 化学処理
- 石油・ガス
- 自動車
第8章 PVDF膜の市場規模・予測:地域別、2018年~2032年
- 主要動向:地域別
- 北米
- 米国
- カナダ
- 欧州
- ドイツ
- 英国
- フランス
- スペイン
- イタリア
- アジア太平洋
- 日本
- 中国
- インド
- オーストラリア
- 韓国
- インドネシア
- マレーシア
- ラテンアメリカ
- ブラジル
- メキシコ
- アルゼンチン
- MEA
- 南アフリカ
- サウジアラビア
- アラブ首長国連邦
- エジプト
第9章 企業プロファイル
- Merck KGaA(MilliporeSigma)-Germany
- Pall Corporation(a division of Danaher Corporation)-USA
- GE Healthcare(now Cytiva, a Danaher company)-USA
- Sartorius AG-Germany
- Thermo Fisher Scientific Inc.-USA
- Koch Membrane Systems, Inc.-USA
- Sterlitech Corporation-USA
- Hangzhou Cobetter Filtration Equipment Co., Ltd.-China
- GVS Group-Italy
- Asahi Kasei Corporation-Japan
- Membrane Solutions LLC-USA
- Microdyn-Nadir GmbH-Germany
- Synder Filtration Inc.-USA
- CITIC Envirotech Ltd.-China
- Axiva Sichem Biotech-India
- Axiva Sichem Biotech-India
Data Tables
- TABLE 1. Market revenue, by technology (2022)
- TABLE 2. Market revenue, by material type (2022)
- TABLE 3. Market revenue, by end-use (2022)
- TABLE 4. Market revenue, by region (2022)
- TABLE 5. Global PVDF membrane market size, 2018 - 2032, (USD Billion)
- TABLE 6. Global PVDF membrane market size, 2018 - 2032, (Kilo Tons)
- TABLE 7. Global PVDF membrane market size, by region, 2018 - 2032 (USD Billion)
- TABLE 8. Global PVDF membrane market size, by region, 2018 - 2032 (Kilo Tons)
- TABLE 9. Global PVDF membrane market size, by technology, 2018 - 2032 (USD Billion)
- TABLE 10. Global PVDF membrane market size, by technology, 2018 - 2032 (Kilo Tons)
- TABLE 11. Global PVDF membrane market size, by material type, 2018 - 2032 (USD Billion)
- TABLE 12. Global PVDF membrane market size, by material type, 2018 - 2032 (Kilo Tons)
- TABLE 13. Global PVDF membrane market size, by end-use, 2018 - 2032 (USD Billion)
- TABLE 14. Global PVDF membrane market size, by end-use, 2018 - 2032 (Kilo Tons)
- TABLE 15. Industry impact forces
- TABLE 16. North America PVDF membrane market size, by country, 2018 - 2032 (USD Billion)
- TABLE 17. North America PVDF membrane market size, by country, 2018 - 2032 (Kilo Tons)
- TABLE 18. North America PVDF membrane market size, by technology, 2018 - 2032 (USD Billion)
- TABLE 19. North America PVDF membrane market size, by technology, 2018 - 2032 (Kilo Tons)
- TABLE 20. North America PVDF membrane market size, by material type, 2018 - 2032 (USD Billion)
- TABLE 21. North America PVDF membrane market size, by material type, 2018 - 2032 (Kilo Tons)
- TABLE 22. North America PVDF membrane market size, by end-use, 2018 - 2032 (USD Billion)
- TABLE 23. North America PVDF membrane market size, by end-use, 2018 - 2032 (Kilo Tons)
- TABLE 24. U.S. PVDF membrane market size, by technology, 2018 - 2032 (USD Billion)
- TABLE 25. U.S. PVDF membrane market size, by technology, 2018 - 2032 (Kilo Tons)
- TABLE 26. U.S. PVDF membrane market size, by material type, 2018 - 2032 (USD Billion)
- TABLE 27. U.S. PVDF membrane market size, by material type, 2018 - 2032 (Kilo Tons)
- TABLE 28. U.S. PVDF membrane market size, by end-use, 2018 - 2032 (USD Billion)
- TABLE 29. U.S. PVDF membrane market size, by end-use, 2018 - 2032 (Kilo Tons)
- TABLE 30. Canada PVDF membrane market size, by technology, 2018 - 2032 (USD Billion)
- TABLE 31. Canada PVDF membrane market size, by technology, 2018 - 2032 (Kilo Tons)
- TABLE 32. Canada PVDF membrane market size, by material type, 2018 - 2032 (USD Billion)
- TABLE 33. Canada PVDF membrane market size, by material type, 2018 - 2032 (Kilo Tons)
- TABLE 34. Canada PVDF membrane market size, by end-use, 2018 - 2032 (USD Billion)
- TABLE 35. Canada PVDF membrane market size, by end-use, 2018 - 2032 (Kilo Tons)
- TABLE 36. Europe PVDF membrane market size, by country, 2018 - 2032 (USD Billion)
- TABLE 37. Europe PVDF membrane market size, by country, 2018 - 2032 (Kilo Tons)
- TABLE 38. Europe PVDF membrane market size, by technology, 2018 - 2032 (USD Billion)
- TABLE 39. Europe PVDF membrane market size, by technology, 2018 - 2032 (Kilo Tons)
- TABLE 40. Europe PVDF membrane market size, by material type, 2018 - 2032 (USD Billion)
- TABLE 41. Europe PVDF membrane market size, by material type, 2018 - 2032 (Kilo Tons)
- TABLE 42. Europe PVDF membrane market size, by end-use, 2018 - 2032 (USD Billion)
- TABLE 43. Europe PVDF membrane market size, by end-use, 2018 - 2032 (Kilo Tons)
- TABLE 44. Germany PVDF membrane market size, by technology, 2018 - 2032 (USD Billion)
- TABLE 45. Germany PVDF membrane market size, by technology, 2018 - 2032 (Kilo Tons)
- TABLE 46. Germany PVDF membrane market size, by material type, 2018 - 2032 (USD Billion)
- TABLE 47. Germany PVDF membrane market size, by material type, 2018 - 2032 (Kilo Tons)
- TABLE 48. Germany PVDF membrane market size, by end-use, 2018 - 2032 (USD Billion)
- TABLE 49. Germany PVDF membrane market size, by end-use, 2018 - 2032 (Kilo Tons)
- TABLE 50. UK PVDF membrane market size, by technology, 2018 - 2032 (USD Billion)
- TABLE 51. UK PVDF membrane market size, by technology, 2018 - 2032 (Kilo Tons)
- TABLE 52. UK PVDF membrane market size, by material type, 2018 - 2032 (USD Billion)
- TABLE 53. UK PVDF membrane market size, by material type, 2018 - 2032 (Kilo Tons)
- TABLE 54. UK PVDF membrane market size, by end-use, 2018 - 2032 (USD Billion)
- TABLE 55. UK PVDF membrane market size, by end-use, 2018 - 2032 (Kilo Tons)
- TABLE 56. France PVDF membrane market size, by technology, 2018 - 2032 (USD Billion)
- TABLE 57. France PVDF membrane market size, by technology, 2018 - 2032 (Kilo Tons)
- TABLE 58. France PVDF membrane market size, by material type, 2018 - 2032 (USD Billion)
- TABLE 59. France PVDF membrane market size, by material type, 2018 - 2032 (Kilo Tons)
- TABLE 60. France PVDF membrane market size, by end-use, 2018 - 2032 (USD Billion)
- TABLE 61. France PVDF membrane market size, by end-use, 2018 - 2032 (Kilo Tons)
- TABLE 62. Spain PVDF membrane market size, by technology, 2018 - 2032 (USD Billion)
- TABLE 63. Spain PVDF membrane market size, by technology, 2018 - 2032 (Kilo Tons)
- TABLE 64. Spain PVDF membrane market size, by material type, 2018 - 2032 (USD Billion)
- TABLE 65. Spain PVDF membrane market size, by material type, 2018 - 2032 (Kilo Tons)
- TABLE 66. Spain PVDF membrane market size, by end-use, 2018 - 2032 (USD Billion)
- TABLE 67. Spain PVDF membrane market size, by end-use, 2018 - 2032 (Kilo Tons)
- TABLE 68. Italy PVDF membrane market size, by technology, 2018 - 2032 (USD Billion)
- TABLE 69. Italy PVDF membrane market size, by technology, 2018 - 2032 (Kilo Tons)
- TABLE 70. Italy PVDF membrane market size, by material type, 2018 - 2032 (USD Billion)
- TABLE 71. Italy PVDF membrane market size, by material type, 2018 - 2032 (Kilo Tons)
- TABLE 72. Italy PVDF membrane market size, by end-use, 2018 - 2032 (USD Billion)
- TABLE 73. Italy PVDF membrane market size, by end-use, 2018 - 2032 (Kilo Tons)
- TABLE 74. Asia Pacific PVDF membrane market size, by country, 2018 - 2032 (USD Billion)
- TABLE 75. Asia Pacific PVDF membrane market size, by country, 2018 - 2032 (Kilo Tons)
- TABLE 76. Asia Pacific PVDF membrane market size, by technology, 2018 - 2032 (USD Billion)
- TABLE 77. Asia Pacific PVDF membrane market size, by technology, 2018 - 2032 (Kilo Tons)
- TABLE 78. Asia Pacific PVDF membrane market size, by material type, 2018 - 2032 (USD Billion)
- TABLE 79. Asia Pacific PVDF membrane market size, by material type, 2018 - 2032 (Kilo Tons)
- TABLE 80. Asia Pacific PVDF membrane market size, by end-use, 2018 - 2032 (USD Billion)
- TABLE 81. Asia Pacific PVDF membrane market size, by end-use, 2018 - 2032 (Kilo Tons)
- TABLE 82. China PVDF membrane market size, by technology, 2018 - 2032 (USD Billion)
- TABLE 83. China PVDF membrane market size, by technology, 2018 - 2032 (Kilo Tons)
- TABLE 84. China PVDF membrane market size, by material type, 2018 - 2032 (USD Billion)
- TABLE 85. China PVDF membrane market size, by material type, 2018 - 2032 (Kilo Tons)
- TABLE 86. China PVDF membrane market size, by end-use, 2018 - 2032 (USD Billion)
- TABLE 87. China PVDF membrane market size, by end-use, 2018 - 2032 (Kilo Tons)
- TABLE 88. Japan PVDF membrane market size, by technology, 2018 - 2032 (USD Billion)
- TABLE 89. Japan PVDF membrane market size, by technology, 2018 - 2032 (Kilo Tons)
- TABLE 90. Japan PVDF membrane market size, by material type, 2018 - 2032 (USD Billion)
- TABLE 91. Japan PVDF membrane market size, by material type, 2018 - 2032 (Kilo Tons)
- TABLE 92. Japan PVDF membrane market size, by end-use, 2018 - 2032 (USD Billion)
- TABLE 93. Japan PVDF membrane market size, by end-use, 2018 - 2032 (Kilo Tons)
- TABLE 94. India PVDF membrane market size, by technology, 2018 - 2032 (USD Billion)
- TABLE 95. India PVDF membrane market size, by technology, 2018 - 2032 (Kilo Tons)
- TABLE 96. India PVDF membrane market size, by material type, 2018 - 2032 (USD Billion)
- TABLE 97. India PVDF membrane market size, by material type, 2018 - 2032 (Kilo Tons)
- TABLE 98. India PVDF membrane market size, by end-use, 2018 - 2032 (USD Billion)
- TABLE 99. India PVDF membrane market size, by end-use, 2018 - 2032 (Kilo Tons)
- TABLE 100. Australia PVDF membrane market size, by technology, 2018 - 2032 (USD Billion)
- TABLE 101. Australia PVDF membrane market size, by technology, 2018 - 2032 (Kilo Tons)
- TABLE 102. Australia PVDF membrane market size, by material type, 2018 - 2032 (USD Billion)
- TABLE 103. Australia PVDF membrane market size, by material type, 2018 - 2032 (Kilo Tons)
- TABLE 104. Australia PVDF membrane market size, by end-use, 2018 - 2032 (USD Billion)
- TABLE 105. Australia PVDF membrane market size, by end-use, 2018 - 2032 (Kilo Tons)
- TABLE 106. South Korea PVDF membrane market size, by technology, 2018 - 2032 (USD Billion)
- TABLE 107. South Korea PVDF membrane market size, by technology, 2018 - 2032 (Kilo Tons)
- TABLE 108. South Korea PVDF membrane market size, by material type, 2018 - 2032 (USD Billion)
- TABLE 109. South Korea PVDF membrane market size, by material type, 2018 - 2032 (Kilo Tons)
- TABLE 110. South Korea PVDF membrane market size, by end-use, 2018 - 2032 (USD Billion)
- TABLE 111. South Korea PVDF membrane market size, by end-use, 2018 - 2032 (Kilo Tons)
- TABLE 112. Indonesia PVDF membrane market size, by technology, 2018 - 2032 (USD Billion)
- TABLE 113. Indonesia PVDF membrane market size, by technology, 2018 - 2032 (Kilo Tons)
- TABLE 114. Indonesia PVDF membrane market size, by material type, 2018 - 2032 (USD Billion)
- TABLE 115. Indonesia PVDF membrane market size, by material type, 2018 - 2032 (Kilo Tons)
- TABLE 116. Indonesia PVDF membrane market size, by end-use, 2018 - 2032 (USD Billion)
- TABLE 117. Indonesia PVDF membrane market size, by end-use, 2018 - 2032 (Kilo Tons)
- TABLE 118. Malaysia PVDF membrane market size, by technology, 2018 - 2032 (USD Billion)
- TABLE 119. Malaysia PVDF membrane market size, by technology, 2018 - 2032 (Kilo Tons)
- TABLE 120. Malaysia PVDF membrane market size, by material type, 2018 - 2032 (USD Billion)
- TABLE 121. Malaysia PVDF membrane market size, by material type, 2018 - 2032 (Kilo Tons)
- TABLE 122. Malaysia PVDF membrane market size, by end-use, 2018 - 2032 (USD Billion)
- TABLE 123. Malaysia PVDF membrane market size, by end-use, 2018 - 2032 (Kilo Tons)
- TABLE 124. Latin America PVDF membrane market size, by country, 2018 - 2032 (USD Billion)
- TABLE 125. Latin America PVDF membrane market size, by country, 2018 - 2032 (Kilo Tons)
- TABLE 126. Latin America PVDF membrane market size, by technology, 2018 - 2032 (USD Billion)
- TABLE 127. Latin America PVDF membrane market size, by technology, 2018 - 2032 (Kilo Tons)
- TABLE 128. Latin America PVDF membrane market size, by material type, 2018 - 2032 (USD Billion)
- TABLE 129. Latin America PVDF membrane market size, by material type, 2018 - 2032 (Kilo Tons)
- TABLE 130. Latin America PVDF membrane market size, by end-use, 2018 - 2032 (USD Billion)
- TABLE 131. Latin America PVDF membrane market size, by end-use, 2018 - 2032 (Kilo Tons)
- TABLE 132. Brazil PVDF membrane market size, by technology, 2018 - 2032 (USD Billion)
- TABLE 133. Brazil PVDF membrane market size, by technology, 2018 - 2032 (Kilo Tons)
- TABLE 134. Brazil PVDF membrane market size, by material type, 2018 - 2032 (USD Billion)
- TABLE 135. Brazil PVDF membrane market size, by material type, 2018 - 2032 (Kilo Tons)
- TABLE 136. Brazil PVDF membrane market size, by end-use, 2018 - 2032 (USD Billion)
- TABLE 137. Brazil PVDF membrane market size, by end-use, 2018 - 2032 (Kilo Tons)
- TABLE 138. Mexico PVDF membrane market size, by technology, 2018 - 2032 (USD Billion)
- TABLE 139. Mexico PVDF membrane market size, by technology, 2018 - 2032 (Kilo Tons)
- TABLE 140. Mexico PVDF membrane market size, by material type, 2018 - 2032 (USD Billion)
- TABLE 141. Mexico PVDF membrane market size, by material type, 2018 - 2032 (Kilo Tons)
- TABLE 142. Mexico PVDF membrane market size, by end-use, 2018 - 2032 (USD Billion)
- TABLE 143. Mexico PVDF membrane market size, by end-use, 2018 - 2032 (Kilo Tons)
- TABLE 144. Argentina PVDF membrane market size, by technology, 2018 - 2032 (USD Billion)
- TABLE 145. Argentina PVDF membrane market size, by technology, 2018 - 2032 (Kilo Tons)
- TABLE 146. Argentina PVDF membrane market size, by material type, 2018 - 2032 (USD Billion)
- TABLE 147. Argentina PVDF membrane market size, by material type, 2018 - 2032 (Kilo Tons)
- TABLE 148. Argentina PVDF membrane market size, by end-use, 2018 - 2032 (USD Billion)
- TABLE 149. Argentina PVDF membrane market size, by end-use, 2018 - 2032 (Kilo Tons)
- TABLE 150. MEA PVDF membrane market size, by country, 2018 - 2032 (USD Billion)
- TABLE 151. MEA PVDF membrane market size, by country, 2018 - 2032 (Kilo Tons)
- TABLE 152. MEA PVDF membrane market size, by technology, 2018 - 2032 (USD Billion)
- TABLE 153. MEA PVDF membrane market size, by technology, 2018 - 2032 (Kilo Tons)
- TABLE 154. MEA PVDF membrane market size, by material type, 2018 - 2032 (USD Billion)
- TABLE 155. MEA PVDF membrane market size, by material type, 2018 - 2032 (Kilo Tons)
- TABLE 156. MEA PVDF membrane market size, by end-use, 2018 - 2032 (USD Billion)
- TABLE 157. MEA PVDF membrane market size, by end-use, 2018 - 2032 (Kilo Tons)
- TABLE 158. South Africa PVDF membrane market size, by technology, 2018 - 2032 (USD Billion)
- TABLE 159. South Africa PVDF membrane market size, by technology, 2018 - 2032 (Kilo Tons)
- TABLE 160. South Africa PVDF membrane market size, by material type, 2018 - 2032 (USD Billion)
- TABLE 161. South Africa PVDF membrane market size, by material type, 2018 - 2032 (Kilo Tons)
- TABLE 162. South Africa PVDF membrane market size, by end-use, 2018 - 2032 (USD Billion)
- TABLE 163. South Africa PVDF membrane market size, by end-use, 2018 - 2032 (Kilo Tons)
- TABLE 164. Saudi Arabia PVDF membrane market size, by technology, 2018 - 2032 (USD Billion)
- TABLE 165. Saudi Arabia PVDF membrane market size, by technology, 2018 - 2032 (Kilo Tons)
- TABLE 166. Saudi Arabia PVDF membrane market size, by material type, 2018 - 2032 (USD Billion)
- TABLE 167. Saudi Arabia PVDF membrane market size, by material type, 2018 - 2032 (Kilo Tons)
- TABLE 168. Saudi Arabia PVDF membrane market size, by end-use, 2018 - 2032 (USD Billion)
- TABLE 169. Saudi Arabia PVDF membrane market size, by end-use, 2018 - 2032 (Kilo Tons)
- TABLE 170. UAE PVDF membrane market size, by technology, 2018 - 2032 (USD Billion)
- TABLE 171. UAE PVDF membrane market size, by technology, 2018 - 2032 (Kilo Tons)
- TABLE 172. UAE PVDF membrane market size, by material type, 2018 - 2032 (USD Billion)
- TABLE 173. UAE PVDF membrane market size, by material type, 2018 - 2032 (Kilo Tons)
- TABLE 174. UAE PVDF membrane market size, by end-use, 2018 - 2032 (USD Billion)
- TABLE 175. UAE PVDF membrane market size, by end-use, 2018 - 2032 (Kilo Tons)
- TABLE 176. Egypt PVDF membrane market size, by technology, 2018 - 2032 (USD Billion)
- TABLE 177. Egypt PVDF membrane market size, by technology, 2018 - 2032 (Kilo Tons)
- TABLE 178. Egypt PVDF membrane market size, by material type, 2018 - 2032 (USD Billion)
- TABLE 179. Egypt PVDF membrane market size, by material type, 2018 - 2032 (Kilo Tons)
- TABLE 180. Egypt PVDF membrane market size, by end-use, 2018 - 2032 (USD Billion)
- TABLE 181. Egypt PVDF membrane market size, by end-use, 2018 - 2032 (Kilo Tons)
Charts & Figures
- FIG. 1 Industry segmentation
- FIG. 2 Market estimation and forecast methodology
- FIG. 3 Breakdown of primary participants
- FIG. 4 PVDF membrane industry, 360 degree synopsis, 2018 - 2032
- FIG. 5 Industry landscape, 2018-2032 (USD Million)
- FIG. 6 Growth potential analysis
- FIG. 7 Porter's analysis
- FIG. 8 PESTEL analysis
- FIG. 9 Company matrix analysis, 2022
- FIG. 10 Strategy dashboard, 2022
Global PVDF Membrane Market size will expand at 7.5% CAGR from 2023 to 2032, driven by the healthy growth of the electronics sector. According to the Economic Survey of 2022-23, the electronics industry in India was valued at $118 billion in FY20 and is steadily progressing, driven by mobile phones, consumer electronics, and industrial electronics. In FY23 (April-November), electronics exports surged by 13.8%, marking the highest growth in six years. India is striving to attain $120 billion in electronics exports by FY26, buoyed by this strong growth trajectory.
PVDF membranes find extensive applications in electronics for tasks like filtration and separation processes in semiconductor manufacturing and electronics assembly. As the electronics industry continues witnessing robust growth, the demand for PVDF membranes as a crucial component for various processes is expected to rise, driving market expansion.
The overall PVDF membrane market is segregated based on material type, technology, end-use, and region.
Hydrophobic PVDF membrane industry will record a sizeable valuation by 2032 due to the exceptional water-repelling properties of hydrophobic PVDF membranes. These membranes are highly sought after for water and wastewater treatment, pharmaceuticals, and biotechnology applications. Their hydrophobic nature allows them to filter and separate non-aqueous substances, making them essential in various industrial processes and research applications. As industries continue seeking efficient and reliable filtration solutions, the demand for hydrophobic PVDF membranes remains high.
The food & beverage segment will account for a modest PVDF membrane market share by 2032. The demand for PVDF (Polyvinylidene fluoride) membranes in the food and beverage industry is driven by their outstanding chemical resistance, durability, and ability to maintain product quality. PVDF membranes are used for filtration and separation processes, ensuring the removal of contaminants, microorganisms, and impurities from food and beverages. This is crucial for maintaining product safety and extending shelf life, making PVDF membranes indispensable in ensuring high-quality food and beverage production.
Asia Pacific PVDF membrane industry will exhibit significant growth over 2023-2032 due to the increasing demand for clean water in populous countries, rapid industrialization, and the expanding pharmaceutical and biotechnology sectors. Additionally, stringent environmental regulations and a growing awareness of water and air purification are propelling the demand for PVDF membranes, making the Asia-Pacific market a high-growth hub for this technology.
Table of Contents
Chapter 1 Methodology & Scope
- 1.1 Industry coverage
- 1.2 Market scope & definition
- 1.3 Base estimates & calculations
- 1.3.1 Data collection
- 1.4 Forecast parameters
- 1.5 COVID-19 impact analysis at global level
- 1.6 Data validation
- 1.7 Data Sources
- 1.7.1 Primary
- 1.7.2 Secondary
- 1.7.2.1 Paid sources
- 1.7.2.2 Unpaid sources
Chapter 2 Executive Summary
- 2.1 PVDF membrane industry 360 degree synopsis, 2018 - 2032
- 2.2 Business trends
- 2.3 Material type trends
- 2.4 Technology trends
- 2.5 End-use trends
- 2.6 Regional trends
Chapter 3 PVDF membrane Industry Insights
- 3.1 Industry ecosystem analysis
- 3.2 Industry impact forces
- 3.2.1 Growth drivers
- 3.2.2 Industry pitfalls & challenges
- 3.3 Growth potential analysis
- 3.3.1 By material type
- 3.3.2 By technology
- 3.3.3 By end-use
- 3.4 COVID- 19 impact analysis
- 3.5 Regulatory landscape
- 3.5.1 U.S.
- 3.5.2 Europe
- 3.6 Pricing analysis, 2022
- 3.7 Reimbursement scenario
- 3.8 Technology landscape
- 3.8.1 Future market trends
- 3.9 Porter's analysis
- 3.10 PESTEL analysis
- 3.11 Impact of Russia Ukraine war
Chapter 4 Competitive Landscape, 2022
- 4.1 Introduction
- 4.2 Company matrix analysis, 2022
- 4.3 Global company market share analysis, 2022
- 4.4 Competitive positioning matrix
- 4.5 Strategy dashboard
Chapter 5 PVDF membrane Market Size and Forecast, By Material Type 2018 - 2032
- 5.1 Hydrophilic PVDF Membrane
- 5.2 Hydrophobic PVDF Membrane
Chapter 6 PVDF membrane Market Size and Forecast, By Technology 2018 - 2032
- 6.1 Microfiltration (MF) PVDF Membrane
- 6.2 Ultrafiltration (UF) PVDF Membrane
- 6.3 Nanofiltration (NF) PVDF Membrane
- 6.4 Others
Chapter 7 PVDF membrane Market Size and Forecast, By End-use 2018 - 2032
- 7.1 Pharmaceutical and Biotechnology
- 7.2 Food and Beverage
- 7.3 Electronics and Semiconductor
- 7.4 Water and Wastewater Treatment
- 7.5 Chemical Processing
- 7.6 Oil & gas
- 7.7 Automotive
Chapter 8 PVDF membrane Market Size and Forecast, By Region 2018 - 2032
- 8.1 Key trends, by region
- 8.2 North America
- 8.2.1 U.S.
- 8.2.2 Canada
- 8.3 Europe
- 8.3.1 Germany
- 8.3.2 UK
- 8.3.3 France
- 8.3.4 Spain
- 8.3.5 Italy
- 8.4 Asia Pacific
- 8.4.1 Japan
- 8.4.2 China
- 8.4.3 India
- 8.4.4 Australia
- 8.4.5 South Korea
- 8.4.6 Indonesia
- 8.4.7 Malaysia
- 8.5 Latin America
- 8.5.1 Brazil
- 8.5.2 Mexico
- 8.5.3 Argentina
- 8.6 MEA
- 8.6.1 South Africa
- 8.6.2 Saudi Arabia
- 8.6.3 UAE
- 8.6.4 Egypt
Chapter 9 Company Profiles
- 9.1 Merck KGaA (MilliporeSigma) - Germany
- 9.2 Pall Corporation (a division of Danaher Corporation) - USA
- 9.3 GE Healthcare (now Cytiva, a Danaher company) - USA
- 9.4 Sartorius AG - Germany
- 9.5 Thermo Fisher Scientific Inc. - USA
- 9.6 Koch Membrane Systems, Inc. - USA
- 9.7 Sterlitech Corporation - USA
- 9.8 Hangzhou Cobetter Filtration Equipment Co., Ltd. - China
- 9.9 GVS Group - Italy
- 9.10 Asahi Kasei Corporation - Japan
- 9.11 Membrane Solutions LLC - USA
- 9.12 Microdyn-Nadir GmbH - Germany
- 9.13 Synder Filtration Inc. - USA
- 9.14 CITIC Envirotech Ltd. - China
- 9.15 Axiva Sichem Biotech - India
- 9.16 Axiva Sichem Biotech - India
