|
|
市場調査レポート
商品コード
1351529
石油・ガス向け電動水中ポンプ市場:用途別、動作別、予測、2023年~2032年Oil & Gas Electric Submersible Pump Market - By Application (Onshore, offshore), By Operation (Single Stage, Multistage) & Forecast, 2023 - 2032 |
||||||
|
|
|||||||
カスタマイズ可能
|
|||||||


| 石油・ガス向け電動水中ポンプ市場:用途別、動作別、予測、2023年~2032年 |
|
出版日: 2023年07月10日
発行: Global Market Insights Inc.
ページ情報: 英文 240 Pages
納期: 2~3営業日
|

- 全表示
- 概要
- 図表
- 目次
世界の石油・ガス向け電動水中ポンプ市場規模は2023-2032年にCAGR 8%以上で拡大します。
石油・ガス分野では、事業者が業務効率の改善とエネルギー消費の抑制に向けた取り組みを強化しており、これが業界成長の原動力となっています。近年、電動水中ポンプメーカーは、コスト削減と環境への影響緩和のために、よりエネルギー効率の高いポンプとモーターシステムを継続的に発表しており、製品採用に拍車をかけています。
石油・ガス向け電動水中ポンプ業界全体は、用途、動作、地域によって二分されます。
動作に関しては、多段式セグメントの市場シェアが2032年から2032年にかけて7%以上の成長率を示すと予測されています。多段式石油・ガス向け電動水中ポンプは、油井からの石油・ガス生産を最大化するための人工揚水システムにおいて重要なコンポーネントとして浮上しています。その効率性、適応性、信頼性から、深くて課題の多い貯留層で利用されています。ポンプ速度と性能を正確に制御するための可変速駆動装置(VSD)との統合が進んでいることも、市場の成長に拍車をかけています。
石油・ガス向け電動水中ポンプ市場は、オフショア用途分野で2023年から2032年にかけて7%以上のCAGRを記録すると思われます。水中環境での石油・ガス生産強化や海洋掘削・生産作業の重要性の高まりは、このセグメントの成長に有利に働くと思われます。
地域的には、欧州の石油・ガス向け電動水中ポンプ産業規模は、IoTなどのデジタル技術の統合が進んでいることから、2032年までのCAGRは5%を超えると予想されます。厳しい環境規制の流入により、石油・ガスセクターはよりクリーンで環境に優しい技術を採用するようになっています。例えば、2023年3月、英国政府は、主要な環境対策を削減しながら化石燃料部門を後押しするため、同国の石油・ガスの首都アバディーンから、刷新されたネットゼロ戦略を打ち出す計画を発表しました。
目次
第1章 調査手法と調査範囲
第2章 エグゼクティブサマリー
第3章 石油・ガス向け電動水中ポンプ業界洞察
- エコシステム分析
- ベンダーマトリックス
- 規制状況
- 業界への影響要因
- 促進要因
- 業界の潜在的リスク&課題
- 業界の展望に対するCOVID-19の影響
- 成長可能性分析
- ポーター分析
- PESTEL分析
第4章 競合ベンチマーキング
- 競合情勢、2022年
- 戦略ダッシュボード
- イノベーションと持続可能性の展望
第5章 石油・ガス向け電動水中ポンプ市場:用途別
- 主要動向
- オンショア
- オフショア
第6章 石油・ガス向け電動水中ポンプ市場:動作別
- 主要動向
- 単段式
- 多段式
第7章 石油・ガス向け電動水中ポンプ市場:地域別
- 主要動向
- 北米
- 米国
- カナダ
- メキシコ
- 欧州
- ロシア
- 英国
- イタリア
- フランス
- ドイツ
- アジア太平洋
- 中国
- インド
- オーストラリア
- インドネシア
- マレーシア
- 中東・アフリカ
- サウジアラビア
- トルコ
- クウェート
- ラテンアメリカ
- ブラジル
- アルゼンチン
- チリ
第8章 企業プロファイル
- Schlumberger Ltd.
- Weatherford
- Baker Hughes
- Flowserve Corporation
- EBARA CORPORATION
- Atlas Copco AB
- WILO SE
- Grundfos Holding A/S
- Gorman-Rupp Pumps
- Crompton Greaves Consumer Electricals Limited
- Sulzer Ltd
- Tsurumi Manufacturing Co., Ltd.
- Novomet
- Halliburton
Data Tables
- TABLE 1 Global market, 2019 - 2022 (Revenue)
- TABLE 2 Global market, 2023 - 2027 (Revenue)
- TABLE 3 Global market, 2028 - 2032 (Revenue)
- TABLE 4 Global market by application, 2019 - 2022 (USD Million)
- TABLE 5 Global market by application, 2023 - 2027 (USD Million)
- TABLE 6 Global market by application, 2028 - 2032 (USD Million)
- TABLE 7 Global market by operation, 2019 - 2022 (USD Million)
- TABLE 8 Global market by operation, 2023 - 2027 (USD Million)
- TABLE 9 Global market by operation, 2028 - 2032 (USD Million)
- TABLE 10 Global market by region, 2019 - 2022 (USD Million)
- TABLE 11 Global market by region, 2023 - 2027 (USD Million)
- TABLE 12 Global market by region, 2028 - 2032 (USD Million)
- TABLE 13 Industry impact forces
- TABLE 14 Global market from onshore, 2019 - 2022 (Revenue)
- TABLE 15 Global market from onshore, 2023 - 2027 (Revenue)
- TABLE 16 Global market from onshore, 2028 - 2032 (Revenue)
- TABLE 17 Global market from onshore, by region, 2019 - 2022 (USD Million)
- TABLE 18 Global market from onshore, by region, 2023 - 2027 (USD Million)
- TABLE 19 Global market from onshore, by region, 2028 - 2032 (USD Million)
- TABLE 20 Global market from offshore, 2019 - 2022 (Revenue)
- TABLE 21 Global market from offshore, 2023 - 2027 (Revenue)
- TABLE 22 Global market from offshore, 2028 - 2032 (Revenue)
- TABLE 23 Global market from offshore, by region, 2019 - 2022 (USD Million)
- TABLE 24 Global market from offshore, by region, 2023 - 2027 (USD Million)
- TABLE 25 Global market from offshore, by region, 2028 - 2032 (USD Million)
- TABLE 26 Global market from single stage, 2019 - 2022 (Revenue)
- TABLE 27 Global market from single stage, 2023 - 2027 (Revenue)
- TABLE 28 Global market from single stage, 2028 - 2032 (Revenue)
- TABLE 29 Global market from single stage, by region, 2019 - 2022 (USD Million)
- TABLE 30 Global market from single stage, by region, 2023 - 2027 (USD Million)
- TABLE 31 Global market from single stage, by region, 2028 - 2032 (USD Million)
- TABLE 32 Global market from multistage, 2019 - 2022 (Revenue)
- TABLE 33 Global market from multistage, 2023 - 2027 (Revenue)
- TABLE 34 Global market from multistage, 2028 - 2032 (Revenue)
- TABLE 35 Global market from multistage, by region, 2019 - 2022 (USD Million)
- TABLE 36 Global market from multistage, by region, 2023 - 2027 (USD Million)
- TABLE 37 Global market from multistage, by region, 2028 - 2032 (USD Million)
- TABLE 38 North America market, 2019 - 2022 (Revenue)
- TABLE 39 North America market, 2023 - 2027 (Revenue)
- TABLE 40 North America market, 2028 - 2032 (Revenue)
- TABLE 41 North America market by application, 2019 - 2022 (USD Million)
- TABLE 42 North America market by application, 2023 - 2027 (USD Million)
- TABLE 43 North America market by application, 2028 - 2032 (USD Million)
- TABLE 44 North America market by operation, 2019 - 2022 (USD Million)
- TABLE 45 North America market by operation, 2023 - 2027 (USD Million)
- TABLE 46 North America market by operation, 2028 - 2032 (USD Million)
- TABLE 47 U.S. market, 2019 - 2022 (Revenue)
- TABLE 48 U.S. market, 2023 - 2027 (Revenue)
- TABLE 49 U.S. market, 2028 - 2032 (Revenue)
- TABLE 50 U.S. market by application, 2019 - 2022 (USD Million)
- TABLE 51 U.S. market by application, 2023 - 2027 (USD Million)
- TABLE 52 U.S. market by application, 2028 - 2032 (USD Million)
- TABLE 53 U.S. market by operation, 2019 - 2022 (USD Million)
- TABLE 54 U.S. market by operation, 2023 - 2027 (USD Million)
- TABLE 55 U.S. market by operation, 2028 - 2032 (USD Million)
- TABLE 56 Canada market, 2019 - 2022 (Revenue)
- TABLE 57 Canada market, 2023 - 2027 (Revenue)
- TABLE 58 Canada market, 2028 - 2032 (Revenue)
- TABLE 59 Canada market by application, 2019 - 2022 (USD Million)
- TABLE 60 Canada market by application, 2023 - 2027 (USD Million)
- TABLE 61 Canada market by application, 2028 - 2032 (USD Million)
- TABLE 62 Canada market by operation, 2019 - 2022 (USD Million)
- TABLE 63 Canada market by operation, 2023 - 2027 (USD Million)
- TABLE 64 Canada market by operation, 2028 - 2032 (USD Million)
- TABLE 65 Mexico market, 2019 - 2022 (Revenue)
- TABLE 66 Mexico market, 2023 - 2027 (Revenue)
- TABLE 67 Mexico market, 2028 - 2032 (Revenue)
- TABLE 68 Mexico market by application, 2019 - 2022 (USD Million)
- TABLE 69 Mexico market by application, 2023 - 2027 (USD Million)
- TABLE 70 Mexico market by application, 2028 - 2032 (USD Million)
- TABLE 71 Mexico market by operation, 2019 - 2022 (USD Million)
- TABLE 72 Mexico market by operation, 2023 - 2027 (USD Million)
- TABLE 73 Mexico market by operation, 2028 - 2032 (USD Million)
- TABLE 74 Europe market, 2019 - 2022 (Revenue)
- TABLE 75 Europe market, 2023 - 2027 (Revenue)
- TABLE 76 Europe market, 2028 - 2032 (Revenue)
- TABLE 77 Europe market by application, 2019 - 2022 (USD Million)
- TABLE 78 Europe market by application, 2023 - 2027 (USD Million)
- TABLE 79 Europe market by application, 2028 - 2032 (USD Million)
- TABLE 80 Europe market by operation, 2019 - 2022 (USD Million)
- TABLE 81 Europe market by operation, 2023 - 2027 (USD Million)
- TABLE 82 Europe market by operation, 2028 - 2032 (USD Million)
- TABLE 83 Russia market, 2019 - 2022 (Revenue)
- TABLE 84 Russia market, 2023 - 2027 (Revenue)
- TABLE 85 Russia market, 2028 - 2032 (Revenue)
- TABLE 86 Russia market by application, 2019 - 2022 (USD Million)
- TABLE 87 Russia market by application, 2023 - 2027 (USD Million)
- TABLE 88 Russia market by application, 2028 - 2032 (USD Million)
- TABLE 89 Russia market by operation, 2019 - 2022 (USD Million)
- TABLE 90 Russia market by operation, 2023 - 2027 (USD Million)
- TABLE 91 Russia market by operation, 2028 - 2032 (USD Million)
- TABLE 92 UK market, 2019 - 2022 (Revenue)
- TABLE 93 UK market, 2023 - 2027 (Revenue)
- TABLE 94 UK market, 2028 - 2032 (Revenue)
- TABLE 95 UK market by application, 2019 - 2022 (USD Million)
- TABLE 96 UK market by application, 2023 - 2027 (USD Million)
- TABLE 97 UK market by application, 2028 - 2032 (USD Million)
- TABLE 98 UK market by operation, 2019 - 2022 (USD Million)
- TABLE 99 UK market by operation, 2023 - 2027 (USD Million)
- TABLE 100 UK market by operation, 2028 - 2032 (USD Million)
- TABLE 101 France market, 2019 - 2022 (Revenue)
- TABLE 102 France market, 2023 - 2027 (Revenue)
- TABLE 103 France market, 2028 - 2032 (Revenue)
- TABLE 104 France market by application, 2019 - 2022 (USD Million)
- TABLE 105 France market by application, 2023 - 2027 (USD Million)
- TABLE 106 France market by application, 2028 - 2032 (USD Million)
- TABLE 107 France market by operation, 2019 - 2022 (USD Million)
- TABLE 108 France market by operation, 2023 - 2027 (USD Million)
- TABLE 109 France market by operation, 2028 - 2032 (USD Million)
- TABLE 110 Italy market, 2019 - 2022 (Revenue)
- TABLE 111 Italy market, 2023 - 2027 (Revenue)
- TABLE 112 Italy market, 2028 - 2032 (Revenue)
- TABLE 113 Italy market by application, 2019 - 2022 (USD Million)
- TABLE 114 Italy market by application, 2023 - 2027 (USD Million)
- TABLE 115 Italy market by application, 2028 - 2032 (USD Million)
- TABLE 116 Italy market by operation, 2019 - 2022 (USD Million)
- TABLE 117 Italy market by operation, 2023 - 2027 (USD Million)
- TABLE 118 Italy market by operation, 2028 - 2032 (USD Million)
- TABLE 119 Germany market, 2019 - 2022 (Revenue)
- TABLE 120 Germany market, 2023 - 2027 (Revenue)
- TABLE 121 Germany market, 2028 - 2032 (Revenue)
- TABLE 122 Germany market by application, 2019 - 2022 (USD Million)
- TABLE 123 Germany market by application, 2023 - 2027 (USD Million)
- TABLE 124 Germany market by application, 2028 - 2032 (USD Million)
- TABLE 125 Germany market by operation, 2019 - 2022 (USD Million)
- TABLE 126 Germany market by operation, 2023 - 2027 (USD Million)
- TABLE 127 Germany market by operation, 2028 - 2032 (USD Million)
- TABLE 128 Asia Pacific market, 2019 - 2022 (Revenue)
- TABLE 129 Asia Pacific market, 2023 - 2027 (Revenue)
- TABLE 130 Asia Pacific market, 2028 - 2032 (Revenue)
- TABLE 131 Asia Pacific market by application, 2019 - 2022 (USD Million)
- TABLE 132 Asia Pacific market by application, 2023 - 2027 (USD Million)
- TABLE 133 Asia Pacific market by application, 2028 - 2032 (USD Million)
- TABLE 134 Asia Pacific market by operation, 2019 - 2022 (USD Million)
- TABLE 135 Asia Pacific market by operation, 2023 - 2027 (USD Million)
- TABLE 136 Asia Pacific market by operation, 2028 - 2032 (USD Million)
- TABLE 137 China market, 2019 - 2022 (Revenue)
- TABLE 138 China market, 2023 - 2027 (Revenue)
- TABLE 139 China market, 2028 - 2032 (Revenue)
- TABLE 140 China market by application, 2019 - 2022 (USD Million)
- TABLE 141 China market by application, 2023 - 2027 (USD Million)
- TABLE 142 China market by application, 2028 - 2032 (USD Million)
- TABLE 143 China market by operation, 2019 - 2022 (USD Million)
- TABLE 144 China market by operation, 2023 - 2027 (USD Million)
- TABLE 145 China market by operation, 2028 - 2032 (USD Million)
- TABLE 146 India market, 2019 - 2022 (Revenue)
- TABLE 147 India market, 2023 - 2027 (Revenue)
- TABLE 148 India market, 2028 - 2032 (Revenue)
- TABLE 149 India market by application, 2019 - 2022 (USD Million)
- TABLE 150 India market by application, 2023 - 2027 (USD Million)
- TABLE 151 India market by application, 2028 - 2032 (USD Million)
- TABLE 152 India market by operation, 2019 - 2022 (USD Million)
- TABLE 153 India market by operation, 2023 - 2027 (USD Million)
- TABLE 154 India market by operation, 2028 - 2032 (USD Million)
- TABLE 155 Australia market, 2019 - 2022 (Revenue)
- TABLE 156 Australia market, 2023 - 2027 (Revenue)
- TABLE 157 Australia market, 2028 - 2032 (Revenue)
- TABLE 158 Australia market by application, 2019 - 2022 (USD Million)
- TABLE 159 Australia market by application, 2023 - 2027 (USD Million)
- TABLE 160 Australia market by application, 2028 - 2032 (USD Million)
- TABLE 161 Australia market by operation, 2019 - 2022 (USD Million)
- TABLE 162 Australia market by operation, 2023 - 2027 (USD Million)
- TABLE 163 Australia market by operation, 2028 - 2032 (USD Million)
- TABLE 164 Indonesia market, 2019 - 2022 (Revenue)
- TABLE 165 Indonesia market, 2023 - 2027 (Revenue)
- TABLE 166 Indonesia market, 2028 - 2032 (Revenue)
- TABLE 167 Indonesia market by application, 2019 - 2022 (USD Million)
- TABLE 168 Indonesia market by application, 2023 - 2027 (USD Million)
- TABLE 169 Indonesia market by application, 2028 - 2032 (USD Million)
- TABLE 170 Indonesia market by operation, 2019 - 2022 (USD Million)
- TABLE 171 Indonesia market by operation, 2023 - 2027 (USD Million)
- TABLE 172 Indonesia market by operation, 2028 - 2032 (USD Million)
- TABLE 173 Malaysia market, 2019 - 2022 (Revenue)
- TABLE 174 Malaysia market, 2023 - 2027 (Revenue)
- TABLE 175 Malaysia market, 2028 - 2032 (Revenue)
- TABLE 176 Malaysia market by application, 2019 - 2022 (USD Million)
- TABLE 177 Malaysia market by application, 2023 - 2027 (USD Million)
- TABLE 178 Malaysia market by application, 2028 - 2032 (USD Million)
- TABLE 179 Malaysia market by operation, 2019 - 2022 (USD Million)
- TABLE 180 Malaysia market by operation, 2023 - 2027 (USD Million)
- TABLE 181 Malaysia market by operation, 2028 - 2032 (USD Million)
- TABLE 182 Middle East & Africa market, 2019 - 2022 (Revenue)
- TABLE 183 Middle East & Africa market, 2023 - 2027 (Revenue)
- TABLE 184 Middle East & Africa market, 2028 - 2032 (Revenue)
- TABLE 185 Middle East & Africa market by application, 2019 - 2022 (USD Million)
- TABLE 186 Middle East & Africa market by application, 2023 - 2027 (USD Million)
- TABLE 187 Middle East & Africa market by application, 2028 - 2032 (USD Million)
- TABLE 188 Middle East & Africa market by operation, 2019 - 2022 (USD Million)
- TABLE 189 Middle East & Africa market by operation, 2023 - 2027 (USD Million)
- TABLE 190 Middle East & Africa market by operation, 2028 - 2032 (USD Million)
- TABLE 191 Saudi Arabia market, 2019 - 2022 (Revenue)
- TABLE 192 Saudi Arabia market, 2023 - 2027 (Revenue)
- TABLE 193 Saudi Arabia market, 2028 - 2032 (Revenue)
- TABLE 194 Saudi Arabia market by application, 2019 - 2022 (USD Million)
- TABLE 195 Saudi Arabia market by application, 2023 - 2027 (USD Million)
- TABLE 196 Saudi Arabia market by application, 2028 - 2032 (USD Million)
- TABLE 197 Saudi Arabia market by operation, 2019 - 2022 (USD Million)
- TABLE 198 Saudi Arabia market by operation, 2023 - 2027 (USD Million)
- TABLE 199 Saudi Arabia market by operation, 2028 - 2032 (USD Million)
- TABLE 200 Turkey market, 2019 - 2022 (Revenue)
- TABLE 201 Turkey market, 2023 - 2027 (Revenue)
- TABLE 202 Turkey market, 2028 - 2032 (Revenue)
- TABLE 203 Turkey market by application, 2019 - 2022 (USD Million)
- TABLE 204 Turkey market by application, 2023 - 2027 (USD Million)
- TABLE 205 Turkey market by application, 2028 - 2032 (USD Million)
- TABLE 206 Turkey market by operation, 2019 - 2022 (USD Million)
- TABLE 207 Turkey market by operation, 2023 - 2027 (USD Million)
- TABLE 208 Turkey market by operation, 2028 - 2032 (USD Million)
- TABLE 209 Kuwait market, 2019 - 2022 (Revenue)
- TABLE 210 Kuwait market, 2023 - 2027 (Revenue)
- TABLE 211 Kuwait market, 2028 - 2032 (Revenue)
- TABLE 212 Kuwait market by application, 2019 - 2022 (USD Million)
- TABLE 213 Kuwait market by application, 2023 - 2027 (USD Million)
- TABLE 214 Kuwait market by application, 2028 - 2032 (USD Million)
- TABLE 215 Kuwait market by operation, 2019 - 2022 (USD Million)
- TABLE 216 Kuwait market by operation, 2023 - 2027 (USD Million)
- TABLE 217 Kuwait market by operation, 2028 - 2032 (USD Million)
- TABLE 218 Latin America market, 2019 - 2022 (Revenue)
- TABLE 219 Latin America market, 2023 - 2027 (Revenue)
- TABLE 220 Latin America market, 2028 - 2032 (Revenue)
- TABLE 221 Latin America market by application, 2019 - 2022 (USD Million)
- TABLE 222 Latin America market by application, 2023 - 2027 (USD Million)
- TABLE 223 Latin America market by application, 2028 - 2032 (USD Million)
- TABLE 224 Latin America market by operation, 2019 - 2022 (USD Million)
- TABLE 225 Latin America market by operation, 2023 - 2027 (USD Million)
- TABLE 226 Latin America market by operation, 2028 - 2032 (USD Million)
- TABLE 227 Brazil market, 2019 - 2022 (Revenue)
- TABLE 228 Brazil market, 2023 - 2027 (Revenue)
- TABLE 229 Brazil market, 2028 - 2032 (Revenue)
- TABLE 230 Brazil market by application, 2019 - 2022 (USD Million)
- TABLE 231 Brazil market by application, 2023 - 2027 (USD Million)
- TABLE 232 Brazil market by application, 2028 - 2032 (USD Million)
- TABLE 233 Brazil market by operation, 2019 - 2022 (USD Million)
- TABLE 234 Brazil market by operation, 2023 - 2027 (USD Million)
- TABLE 235 Brazil market by operation, 2028 - 2032 (USD Million)
- TABLE 236 Argentina market, 2019 - 2022 (Revenue)
- TABLE 237 Argentina market, 2023 - 2027 (Revenue)
- TABLE 238 Argentina market, 2028 - 2032 (Revenue)
- TABLE 239 Argentina market by application, 2019 - 2022 (USD Million)
- TABLE 240 Argentina market by application, 2023 - 2027 (USD Million)
- TABLE 241 Argentina market by application, 2028 - 2032 (USD Million)
- TABLE 242 Argentina market by operation, 2019 - 2022 (USD Million)
- TABLE 243 Argentina market by operation, 2023 - 2027 (USD Million)
- TABLE 244 Argentina market by operation, 2028 - 2032 (USD Million)
- TABLE 245 Chile market, 2019 - 2022 (Revenue)
- TABLE 246 Chile market, 2023 - 2027 (Revenue)
- TABLE 247 Chile market, 2028 - 2032 (Revenue)
- TABLE 248 Chile market by application, 2019 - 2022 (USD Million)
- TABLE 249 Chile market by application, 2023 - 2027 (USD Million)
- TABLE 250 Chile market by application, 2028 - 2032 (USD Million)
- TABLE 251 Chile market by operation, 2019 - 2022 (USD Million)
- TABLE 252 Chile market by operation, 2023 - 2027 (USD Million)
- TABLE 253 Chile market by operation, 2028 - 2032 (USD Million)
Charts & Figures
- FIG. 1 GMI report coverage: critical research elements
- FIG. 2 Industry segmentation
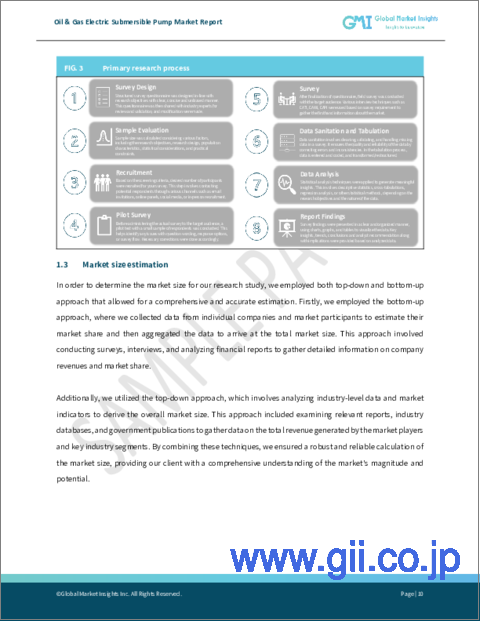
- FIG. 3 Market forecasting methodology
- FIG. 4 Profile break-up of primary respondents
- FIG. 5 Oil & Gas Electric submersible pump industry 360 degree synopsis, 2019 - 2032
- FIG. 6 Industry ecosystem analysis
- FIG. 7 Overall view of COVID- 19 effect, 2019 - 2032 (USD Million)
- FIG. 8 Growth potential analysis
- FIG. 9 Porter's Analysis
- FIG. 10 PESTEL Analysis
- FIG. 11 SWOT Analysis, Schlumberger Ltd.
- FIG. 12 SWOT Analysis, Weatherford
- FIG. 13 SWOT Analysis, Baker Hughes
- FIG. 14 SWOT Analysis, Flowserve Corporation
- FIG. 15 SWOT Analysis, Ebara Corporation
- FIG. 16 SWOT Analysis, Atlas Copco AB
- FIG. 17 SWOT Analysis, Wilo SE
- FIG. 18 SWOT Analysis, Grundfos Holding A/S
- FIG. 19 SWOT Analysis, Gorman-Rupp Pumps
- FIG. 20 SWOT Analysis, Crompton Greaves Consumer Electricals Limited
- FIG. 21 SWOT Analysis, Sulzer Ltd
- FIG. 22 SWOT Analysis, Tsurumi Manufacturing Co., Ltd.
- FIG. 23 SWOT Analysis, Novomet
- FIG. 24 SWOT Analysis, Halliburton
Global oil & gas electric submersible pump market size will expand at over 8% CAGR from 2023-2032.
The rising efforts led by operators in the oil & gas space on improving operational efficiency and limiting energy consumption will drive the industry growth. Of late, electric submersible pump (ESP) manufacturers are continuously coming up with more energy-efficient pumps and motor systems for cost savings and mitigated environmental impact, adding to the product adoption. To cite an instance, in March 2023, Atlas Copco Power partnered with Flow to launch Weda D95, its gen-next electric submersible dewatering pump for heavily abrasive environments, including mining, tunnelling and construction.
The overall oil & gas electric submersible pump industry is bifurcated based on application, operation and region.
With respect to operation, the market share from the multi-stage segment is poised to depict over 7% growth rate from 2032-2032. Multi-stage oil & gas ESPs have emerged as critical components in artificial lift systems for maximizing oil and gas production from wells. On account of their efficiency, adaptability, and reliability, they are utilized in deep and challenging reservoirs. Rising integration with variable speed drives (VSDs) for precise control of pump speed as well as performance will also add to the market growth.
Oil & gas electric submersible pump market from the offshore application segment will register more than 7% CAGR from 2023-2032 driven by rising utilization for subsea boosting. Increasing importance in enhancing oil & gas production in underwater environments as well as boosting offshore drilling and production operations will prove favorable for the segment growth.
Regionally, Europe oil & gas electric submersible pump industry size is expected to witness over 5% CAGR through 2032 on account of the rising integration of digital technologies, such as IoT. The influx of severe environmental regulations has pushed the oil & gas sector to adopt cleaner and environmentally friendly technologies. For instance, in March 2023, the U.K. government announced its plans to launch the revamped net zero strategy from the country's oil and gas capital, Aberdeen, to boost the fossil fuel sector while cutting key green measures.
Table of Contents
Chapter 1 Methodology & Scope
- 1.1 Market definitions
- 1.2 Base estimates & calculations
- 1.3 Forecast calculation
- 1.4 Data sources
- 1.4.1 Primary
- 1.4.2 Secondary
- 1.4.2.1 Paid
- 1.4.2.2 Unpaid
Chapter 2 Executive Summary
- 2.1 Oil & Gas electric submersible pump industry 360 degree synopsis, 2019 - 2032
- 2.1.1 Business trends
- 2.1.2 Application trends
- 2.1.3 Operation trends
- 2.1.4 Regional trends
Chapter 3 Oil & Gas Electric Submersible Pump Industry Insights
- 3.1 Industry ecosystem analysis
- 3.1.1 Vendor Matrix
- 3.2 Regulatory landscape
- 3.3 Industry impact forces
- 3.3.1 Growth drivers
- 3.3.2 Industry pitfalls & challenges
- 3.4 COVID- 19 impact on the industry outlook
- 3.5 Growth potential analysis
- 3.6 Porter's Analysis
- 3.6.1 Bargaining power of suppliers
- 3.6.2 Bargaining power of buyers
- 3.6.3 Threat of new entrants
- 3.6.4 Threat of substitutes
- 3.7 PESTEL Analysis
Chapter 4 Competitive Benchmarking
- 4.1 Competitive landscape, 2022
- 4.1.1 Strategic dashboard
- 4.2 Innovation & sustainability landscape
Chapter 5 Oil & Gas Electric Submersible Pump Market, By Application (USD Million)
- 5.1 Key application trends
- 5.2 Onshore
- 5.3 Offshore
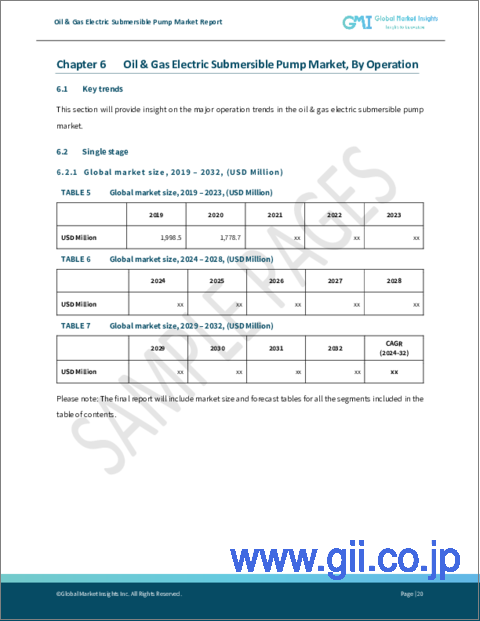
Chapter 6 Oil & Gas Electric Submersible Pump Market, By Operation (USD Million)
- 6.1 Key operation trends
- 6.2 Single Stage
- 6.3 Multistage
Chapter 7 Oil & Gas electric submersible pump Market, By Region (USD Million)
- 7.1 Key region trends
- 7.2 North America
- 7.2.1 U.S.
- 7.2.2 Canada
- 7.2.3 Mexico
- 7.3 Europe
- 7.3.1 Russia
- 7.3.2 UK
- 7.3.3 Italy
- 7.3.4 France
- 7.3.5 Germany
- 7.4 Asia Pacific
- 7.4.1 China
- 7.4.2 India
- 7.4.3 Australia
- 7.4.4 Indonesia
- 7.4.5 Malaysia
- 7.5 Middle East & Africa
- 7.5.1 Saudi Arabia
- 7.5.2 Turkey
- 7.5.3 Kuwait
- 7.6 Latin America
- 7.6.1 Brazil
- 7.6.2 Argentina
- 7.6.3 Chile
Chapter 8 Company Profiles
- 8.1 Schlumberger Ltd.
- 8.2 Weatherford
- 8.3 Baker Hughes
- 8.4 Flowserve Corporation
- 8.5 EBARA CORPORATION
- 8.6 Atlas Copco AB
- 8.7 WILO SE
- 8.8 Grundfos Holding A/S
- 8.9 Gorman-Rupp Pumps
- 8.10 Crompton Greaves Consumer Electricals Limited
- 8.11 Sulzer Ltd
- 8.12 Tsurumi Manufacturing Co., Ltd.
- 8.13 Novomet
- 8.14 Halliburton
