|
|
市場調査レポート
商品コード
1351515
LIBS(レーザー誘起ブレークダウン分光法)の市場規模:製品別、最終用途別、世界予測、2023-2032年Laser-induced Breakdown Spectroscopy (LIBS) Market Size - By Product (Handheld, Desktop), By End-use (Academic and Research Institutes, Pharmaceuticals and Biotechnology Companies) - Global Forecast, 2023-2032 |
||||||
カスタマイズ可能
|
|||||||


| LIBS(レーザー誘起ブレークダウン分光法)の市場規模:製品別、最終用途別、世界予測、2023-2032年 |
|
出版日: 2023年07月06日
発行: Global Market Insights Inc.
ページ情報: 英文 210 Pages
納期: 2~3営業日
|

- 全表示
- 概要
- 図表
- 目次
LIBS(レーザー誘起ブレークダウン分光法)の市場規模は、世界の環境問題の高まりに牽引され、2023-2032年のCAGRが6.2%になると見られています。
環境問題、汚染、資源枯渇に対する世界の意識の高まりに伴い、精密かつ迅速な分析技術の必要性が最も高まっています。このためLIBS技術は、さまざまな用途で正確な元素分析を提供することで、こうした懸念に対処する強力なソリューションを提供しています。
さらに、冶金、鉱業、製造業において、より速く、より正確で、破壊的な金属組成評価が不要な先進的なツールへの嗜好が高まっており、業界の成長を促進します。例えば、2023年7月、センサーベースの選別技術の世界的メーカーであるTOMRA Recycling Sorting社は、アルミニウム合金の高スループット選別のためのダイナミックLIBSを搭載した新型機AUTOSORTTM PULSEを発売しました。
LIBS市場は、製品、最終用途、地域によって区分されます。
製品に関しては、デスクトップLIBSの市場規模が2032年までCAGR 5.6%と予測されています。デスクトップLIBSのコンパクトサイズ、手頃な価格、ポータビリティ、使いやすさは、研究者から産業プロフェッショナルまで、より幅広いユーザーへのアクセシビリティを広げています。さらに、感度、精度、速度の面で最近のデスクトップの進歩は、鉱業、金属、環境モニタリングなど、この技術の応用範囲を広げています。
最終用途に基づくと、学術・研究機関セグメントの業界規模が、2023~2032年に6.2%の成長率を記録すると予測されています。これは、その汎用性と分析能力により、学術・研究機関の武器にLIBSの採用が増加しているためです。化学、地質学、環境科学、材料科学など、さまざまな科学分野の研究者がこの技術を元素分析に利用しており、この分野の成長にさらに貢献しています。
地域別では、アジア太平洋のLIBSの市場規模は、2023~2032年にCAGR 6.6%で拡大すると予測されています。この拡大は、業界情勢が進化し、高度な分析技術がより重視されていることに起因しています。さらに、学術・研究分野が急成長している新興経済国の存在が、LIBSアプリケーションのイノベーションを促進しています。
学術機関による継続的な研究開発投資も、この地域での科学的発見のための技術の受け入れを増やしています。
目次
第1章 調査手法と調査範囲
第2章 エグゼクティブサマリー
第3章 LIBS業界洞察
- エコシステム分析
- 業界への影響要因
- 促進要因
- 製薬業界におけるLIBS利用の増加
- 技術の進歩
- 規制枠組みの強化
- 様々な産業におけるアプリケーションの拡大
- 業界の潜在的リスク&課題
- 機器に関連する高コスト
- 標準化の欠如
- 促進要因
- 成長可能性分析
- 製品別
- 最終用途別
- COVID-19影響分析
- 技術情勢
- 規制状況
- 米国
- 欧州
- アジア太平洋
- ポーター分析
- PESTEL分析
第4章 競合情勢
- イントロダクション
- 企業マトリックス分析
- 競合ダッシュボード
- 企業の市場シェア分析
- ベンダーマトリックス分析
- 主要市場プレーヤーの競合分析
- 競合ポジショニングマトリックス
- 戦略展望マトリックス
第5章 LIBSの市場規模・予測:製品別
- 主要動向:製品別
- ハンドヘルド
- デスクトップ
第6章 LIBSの市場規模・予測:最終用途別
- 主要動向:最終用途別
- 学術・研究機関
- 製薬・バイオテクノロジー企業
- その他
第7章 LIBSの市場規模・予測:地域別
- 主要動向:地域別
- 北米
- 米国
- カナダ
- 欧州
- ドイツ
- 英国
- フランス
- イタリア
- スペイン
- スイス
- オランダ
- デンマーク
- ポーランド
- スウェーデン
- アジア太平洋
- 中国
- 日本
- インド
- オーストラリア
- 韓国
- ニュージーランド
- ベトナム
- インドネシア
- ラテンアメリカ
- ブラジル
- メキシコ
- アルゼンチン
- コロンビア
- チリ
- 中東・アフリカ
- サウジアラビア
- 南アフリカ
- アラブ首長国連邦
- トルコ
第8章 企業プロファイル
- Thermo Fisher Scientific Inc.
- Hitachi High-Tech Analytical Science
- SciAps, Inc.
- Rigaku, Bruker Corporation
- TSI Incorporated
- Princeton Instruments
- Avantes
- B&W Tek
- Applied Spectra
- SECOPTA analytics GmbH
Data Tables
- TABLE 1 Product mapping
- TABLE 2 Market revenue, by product (2022)
- TABLE 3 Market share, by end-use (2022)
- TABLE 4 Market share, by region (2022)
- TABLE 5 Global laser-induced breakdown spectroscopy (LIBS) market size, by region, 2018 - 2024 (USD Million)
- TABLE 6 Global laser-induced breakdown spectroscopy (LIBS) market size, by region, 2025 - 2032 (USD Million)
- TABLE 7 Global laser-induced breakdown spectroscopy (LIBS) market volume, by region, 2018 - 2024 (Units)
- TABLE 8 Global laser-induced breakdown spectroscopy (LIBS) market volume, by region, 2025 - 2032 (Units)
- TABLE 9 Global laser-induced breakdown spectroscopy (LIBS) market size, by product, 2018- 2024 (USD Million)
- TABLE 10 Global laser-induced breakdown spectroscopy (LIBS) market size, by product, 2025- 2032 (USD Million)
- TABLE 11 Global laser-induced breakdown spectroscopy (LIBS) market volume, by product, 2018- 2024 (Units)
- TABLE 12 Global laser-induced breakdown spectroscopy (LIBS) market volume, by product, 2025- 2032 (Units)
- TABLE 13 Global laser-induced breakdown spectroscopy (LIBS) market size, by end-use, 2018 - 2024 (USD Million)
- TABLE 14 Global laser-induced breakdown spectroscopy (LIBS) market size, by end-use, 2025 - 2032 (USD Million)
- TABLE 15 Industry impact forces
- TABLE 16 Handheld market size, 2018 - 2024 (USD Million)
- TABLE 17 Handheld market size, 2025 - 2032 (USD Million)
- TABLE 18 Handheld market volume, 2018 - 2024 (Units)
- TABLE 19 Handheld market volume, 2025 - 2032 (Units)
- TABLE 20 Desktop market size, 2018 - 2024 (USD Million)
- TABLE 21 Desktop market size, 2025 - 2032 (USD Million)
- TABLE 22 Desktop market volume, 2018 - 2024 (Units)
- TABLE 23 Desktop market volume, 2025 - 2032 (Units)
- TABLE 24 Academic and research institutes market size, 2018 - 2024 (USD Million)
- TABLE 25 Academic and research institutes market size, 2025 - 2032 (USD Million)
- TABLE 26 Pharmaceuticals and biotechnology companies market size, 2018 - 2024 (USD Million)
- TABLE 27 Pharmaceuticals and biotechnology companies market size, 2025 - 2032 (USD Million)
- TABLE 28 Others market size, 2018 - 2024 (USD Million)
- TABLE 29 Others market size, 2025 - 2032 (USD Million)
- TABLE 30 North America laser-induced breakdown spectroscopy (LIBS) market size, by country, 2018 - 2024 (USD Million)
- TABLE 31 North America laser-induced breakdown spectroscopy (LIBS) market size, by country, 2025 - 2032 (USD Million)
- TABLE 32 North America laser-induced breakdown spectroscopy (LIBS) market volume, by country, 2018 - 2024 (Units)
- TABLE 33 North America laser-induced breakdown spectroscopy (LIBS) market volume, by country, 2025 - 2032 (Units)
- TABLE 34 North America laser-induced breakdown spectroscopy (LIBS) market size, by product, 2018- 2024 (USD Million)
- TABLE 35 North America laser-induced breakdown spectroscopy (LIBS) market size, by product, 2025- 2032 (USD Million)
- TABLE 36 North America laser-induced breakdown spectroscopy (LIBS) market volume, by product, 2018- 2024 (Units)
- TABLE 37 North America laser-induced breakdown spectroscopy (LIBS) market volume, by product, 2025- 2032 (Units)
- TABLE 38 North America laser-induced breakdown spectroscopy (LIBS) market size, by end-use, 2018 - 2024 (USD Million)
- TABLE 39 North America laser-induced breakdown spectroscopy (LIBS) market size, by end-use, 2025 - 2032 (USD Million)
- TABLE 40 U.S. laser-induced breakdown spectroscopy (LIBS) market size, by product, 2018- 2024 (USD Million)
- TABLE 41 U.S. laser-induced breakdown spectroscopy (LIBS) market size, by product, 2025- 2032 (USD Million)
- TABLE 42 U.S. laser-induced breakdown spectroscopy (LIBS) market volume, by product, 2018- 2024 (Units)
- TABLE 43 U.S. laser-induced breakdown spectroscopy (LIBS) market volume, by product, 2025- 2032 (Units)
- TABLE 44 U.S. laser-induced breakdown spectroscopy (LIBS) market size, by end-use, 2018 - 2024 (USD Million)
- TABLE 45 U.S. laser-induced breakdown spectroscopy (LIBS) market size, by end-use, 2025 - 2032 (USD Million)
- TABLE 46 Canada laser-induced breakdown spectroscopy (LIBS) market size, by product, 2018- 2024 (USD Million)
- TABLE 47 Canada laser-induced breakdown spectroscopy (LIBS) market size, by product, 2025- 2032 (USD Million)
- TABLE 48 Canada laser-induced breakdown spectroscopy (LIBS) market volume, by product, 2018- 2024 (Units)
- TABLE 49 Canada laser-induced breakdown spectroscopy (LIBS) market volume, by product, 2025- 2032 (Units)
- TABLE 50 Canada laser-induced breakdown spectroscopy (LIBS) market size, by end-use, 2018 - 2024 (USD Million)
- TABLE 51 Canada laser-induced breakdown spectroscopy (LIBS) market size, by end-use, 2025 - 2032 (USD Million)
- TABLE 52 Europe laser-induced breakdown spectroscopy (LIBS) market size, by country, 2018 - 2024 (USD Million)
- TABLE 53 Europe laser-induced breakdown spectroscopy (LIBS) market size, by country, 2025 - 2032 (USD Million)
- TABLE 54 Europe laser-induced breakdown spectroscopy (LIBS) market volume, by country, 2018 - 2024 (Units)
- TABLE 55 Europe laser-induced breakdown spectroscopy (LIBS) market volume, by country, 2025 - 2032 (Units)
- TABLE 56 Europe laser-induced breakdown spectroscopy (LIBS) market size, by product, 2018- 2024 (USD Million)
- TABLE 57 Europe laser-induced breakdown spectroscopy (LIBS) market size, by product, 2025- 2032 (USD Million)
- TABLE 58 Europe laser-induced breakdown spectroscopy (LIBS) market volume, by product, 2018- 2024 (Units)
- TABLE 59 Europe laser-induced breakdown spectroscopy (LIBS) market volume, by product, 2025- 2032 (Units)
- TABLE 60 Europe laser-induced breakdown spectroscopy (LIBS) market size, by end-use, 2018 - 2024 (USD Million)
- TABLE 61 Europe laser-induced breakdown spectroscopy (LIBS) market size, by end-use, 2025 - 2032 (USD Million)
- TABLE 62 Germany laser-induced breakdown spectroscopy (LIBS) market size, by product, 2018- 2024 (USD Million)
- TABLE 63 Germany laser-induced breakdown spectroscopy (LIBS) market size, by product, 2025- 2032 (USD Million)
- TABLE 64 Germany laser-induced breakdown spectroscopy (LIBS) market volume, by product, 2018- 2024 (Units)
- TABLE 65 Germany laser-induced breakdown spectroscopy (LIBS) market volume, by product, 2025- 2032 (Units)
- TABLE 66 Germany laser-induced breakdown spectroscopy (LIBS) market size, by end-use, 2018 - 2024 (USD Million)
- TABLE 67 Germany laser-induced breakdown spectroscopy (LIBS) market size, by end-use, 2025 - 2032 (USD Million)
- TABLE 68 UK laser-induced breakdown spectroscopy (LIBS) market size, by product, 2018- 2024 (USD Million)
- TABLE 69 UK laser-induced breakdown spectroscopy (LIBS) market size, by product, 2025- 2032 (USD Million)
- TABLE 70 UK laser-induced breakdown spectroscopy (LIBS) market volume, by product, 2018- 2024 (Units)
- TABLE 71 UK laser-induced breakdown spectroscopy (LIBS) market volume, by product, 2025- 2032 (Units)
- TABLE 72 UK laser-induced breakdown spectroscopy (LIBS) market size, by end-use, 2018 - 2024 (USD Million)
- TABLE 73 UK laser-induced breakdown spectroscopy (LIBS) market size, by end-use, 2025 - 2032 (USD Million)
- TABLE 74 France laser-induced breakdown spectroscopy (LIBS) market size, by product, 2018- 2024 (USD Million)
- TABLE 75 France laser-induced breakdown spectroscopy (LIBS) market size, by product, 2025- 2032 (USD Million)
- TABLE 76 France laser-induced breakdown spectroscopy (LIBS) market volume, by product, 2018- 2024 (Units)
- TABLE 77 France laser-induced breakdown spectroscopy (LIBS) market volume, by product, 2025- 2032 (Units)
- TABLE 78 France laser-induced breakdown spectroscopy (LIBS) market size, by end-use, 2018 - 2024 (USD Million)
- TABLE 79 France laser-induced breakdown spectroscopy (LIBS) market size, by end-use, 2025 - 2032 (USD Million)
- TABLE 80 Italy laser-induced breakdown spectroscopy (LIBS) market size, by product, 2018- 2024 (USD Million)
- TABLE 81 Italy laser-induced breakdown spectroscopy (LIBS) market size, by product, 2025- 2032 (USD Million)
- TABLE 82 Italy laser-induced breakdown spectroscopy (LIBS) market volume, by product, 2018- 2024 (Units)
- TABLE 83 Italy laser-induced breakdown spectroscopy (LIBS) market volume, by product, 2025- 2032 (Units)
- TABLE 84 Italy laser-induced breakdown spectroscopy (LIBS) market size, by end-use, 2018 - 2024 (USD Million)
- TABLE 85 Italy laser-induced breakdown spectroscopy (LIBS) market size, by end-use, 2025 - 2032 (USD Million)
- TABLE 86 Spain laser-induced breakdown spectroscopy (LIBS) market size, by product, 2018- 2024 (USD Million)
- TABLE 87 Spain laser-induced breakdown spectroscopy (LIBS) market size, by product, 2025- 2032 (USD Million)
- TABLE 88 Spain laser-induced breakdown spectroscopy (LIBS) market volume, by product, 2018- 2024 (Units)
- TABLE 89 Spain laser-induced breakdown spectroscopy (LIBS) market volume, by product, 2025- 2032 (Units)
- TABLE 90 Spain laser-induced breakdown spectroscopy (LIBS) market size, by end-use, 2018 - 2024 (USD Million)
- TABLE 91 Spain laser-induced breakdown spectroscopy (LIBS) market size, by end-use, 2025 - 2032 (USD Million)
- TABLE 92 Switzerland laser-induced breakdown spectroscopy (LIBS) market size, by product, 2018- 2024 (USD Million)
- TABLE 93 Switzerland laser-induced breakdown spectroscopy (LIBS) market size, by product, 2025- 2032 (USD Million)
- TABLE 94 Switzerland laser-induced breakdown spectroscopy (LIBS) market volume, by product, 2018- 2024 (Units)
- TABLE 95 Switzerland laser-induced breakdown spectroscopy (LIBS) market volume, by product, 2025- 2032 (Units)
- TABLE 96 Switzerland laser-induced breakdown spectroscopy (LIBS) market size, by end-use, 2018 - 2024 (USD Million)
- TABLE 97 Switzerland laser-induced breakdown spectroscopy (LIBS) market size, by end-use, 2025 - 2032 (USD Million)
- TABLE 98 The Netherlands laser-induced breakdown spectroscopy (LIBS) market size, by product, 2018- 2024 (USD Million)
- TABLE 99 The Netherlands laser-induced breakdown spectroscopy (LIBS) market size, by product, 2025- 2032 (USD Million)
- TABLE 100 The Netherlands laser-induced breakdown spectroscopy (LIBS) market volume, by product, 2018- 2024 (Units)
- TABLE 101 The Netherlands laser-induced breakdown spectroscopy (LIBS) market volume, by product, 2025- 2032 (Units)
- TABLE 102 The Netherlands laser-induced breakdown spectroscopy (LIBS) market size, by end-use, 2018 - 2024 (USD Million)
- TABLE 103 The Netherlands laser-induced breakdown spectroscopy (LIBS) market size, by end-use, 2025 - 2032 (USD Million)
- TABLE 104 Poland laser-induced breakdown spectroscopy (LIBS) market size, by product, 2018- 2024 (USD Million)
- TABLE 105 Poland laser-induced breakdown spectroscopy (LIBS) market size, by product, 2025- 2032 (USD Million)
- TABLE 106 Poland laser-induced breakdown spectroscopy (LIBS) market volume, by product, 2018- 2024 (Units)
- TABLE 107 Poland laser-induced breakdown spectroscopy (LIBS) market volume, by product, 2025- 2032 (Units)
- TABLE 108 Poland laser-induced breakdown spectroscopy (LIBS) market size, by end-use, 2018 - 2024 (USD Million)
- TABLE 109 Poland laser-induced breakdown spectroscopy (LIBS) market size, by end-use, 2025 - 2032 (USD Million)
- TABLE 110 Denmark laser-induced breakdown spectroscopy (LIBS) market size, by product, 2018- 2024 (USD Million)
- TABLE 111 Denmark laser-induced breakdown spectroscopy (LIBS) market size, by product, 2025- 2032 (USD Million)
- TABLE 112 Denmark laser-induced breakdown spectroscopy (LIBS) market volume, by product, 2018- 2024 (Units)
- TABLE 113 Denmark laser-induced breakdown spectroscopy (LIBS) market volume, by product, 2025- 2032 (Units)
- TABLE 114 Denmark laser-induced breakdown spectroscopy (LIBS) market size, by end-use, 2018 - 2024 (USD Million)
- TABLE 115 Denmark laser-induced breakdown spectroscopy (LIBS) market size, by end-use, 2025 - 2032 (USD Million)
- TABLE 116 Sweden laser-induced breakdown spectroscopy (LIBS) market size, by product, 2018- 2024 (USD Million)
- TABLE 117 Sweden laser-induced breakdown spectroscopy (LIBS) market size, by product, 2025- 2032 (USD Million)
- TABLE 118 Sweden laser-induced breakdown spectroscopy (LIBS) market volume, by product, 2018- 2024 (Units)
- TABLE 119 Sweden laser-induced breakdown spectroscopy (LIBS) market volume, by product, 2025- 2032 (Units)
- TABLE 120 Sweden laser-induced breakdown spectroscopy (LIBS) market size, by end-use, 2018 - 2024 (USD Million)
- TABLE 121 Sweden laser-induced breakdown spectroscopy (LIBS) market size, by end-use, 2025 - 2032 (USD Million)
- TABLE 122 Asia Pacific laser-induced breakdown spectroscopy (LIBS) market size, by country, 2018 - 2024 (USD Million)
- TABLE 123 Asia Pacific laser-induced breakdown spectroscopy (LIBS) market size, by country, 2025 - 2032 (USD Million)
- TABLE 124 Asia Pacific laser-induced breakdown spectroscopy (LIBS) market volume, by country, 2018 - 2024 (Units)
- TABLE 125 Asia Pacific laser-induced breakdown spectroscopy (LIBS) market volume, by country, 2025 - 2032 (Units)
- TABLE 126 Asia Pacific laser-induced breakdown spectroscopy (LIBS) market size, by product, 2018- 2024 (USD Million)
- TABLE 127 Asia Pacific laser-induced breakdown spectroscopy (LIBS) market size, by product, 2025- 2032 (USD Million)
- TABLE 128 Asia Pacific laser-induced breakdown spectroscopy (LIBS) market volume, by product, 2018- 2024 (Units)
- TABLE 129 Asia Pacific laser-induced breakdown spectroscopy (LIBS) market volume, by product, 2025- 2032 (Units)
- TABLE 130 Asia Pacific laser-induced breakdown spectroscopy (LIBS) market size, by end-use, 2018 - 2024 (USD Million)
- TABLE 131 Asia Pacific laser-induced breakdown spectroscopy (LIBS) market size, by end-use, 2025 - 2032 (USD Million)
- TABLE 132 China laser-induced breakdown spectroscopy (LIBS) market size, by product, 2018- 2024 (USD Million)
- TABLE 133 China laser-induced breakdown spectroscopy (LIBS) market size, by product, 2025- 2032 (USD Million)
- TABLE 134 China laser-induced breakdown spectroscopy (LIBS) market volume, by product, 2018- 2024 (Units)
- TABLE 135 China laser-induced breakdown spectroscopy (LIBS) market volume, by product, 2025- 2032 (Units)
- TABLE 136 China laser-induced breakdown spectroscopy (LIBS) market size, by end-use, 2018 - 2024 (USD Million)
- TABLE 137 China laser-induced breakdown spectroscopy (LIBS) market size, by end-use, 2025 - 2032 (USD Million)
- TABLE 138 Japan laser-induced breakdown spectroscopy (LIBS) market size, by product, 2018- 2024 (USD Million)
- TABLE 139 Japan laser-induced breakdown spectroscopy (LIBS) market size, by product, 2025- 2032 (USD Million)
- TABLE 140 Japan laser-induced breakdown spectroscopy (LIBS) market volume, by product, 2018- 2024 (Units)
- TABLE 141 Japan laser-induced breakdown spectroscopy (LIBS) market volume, by product, 2025- 2032 (Units)
- TABLE 142 Japan laser-induced breakdown spectroscopy (LIBS) market size, by end-use, 2018 - 2024 (USD Million)
- TABLE 143 Japan laser-induced breakdown spectroscopy (LIBS) market size, by end-use, 2025 - 2032 (USD Million)
- TABLE 144 India laser-induced breakdown spectroscopy (LIBS) market size, by product, 2018- 2024 (USD Million)
- TABLE 145 India laser-induced breakdown spectroscopy (LIBS) market size, by product, 2025- 2032 (USD Million)
- TABLE 146 India laser-induced breakdown spectroscopy (LIBS) market volume, by product, 2018- 2024 (Units)
- TABLE 147 India laser-induced breakdown spectroscopy (LIBS) market volume, by product, 2025- 2032 (Units)
- TABLE 148 India laser-induced breakdown spectroscopy (LIBS) market size, by end-use, 2018 - 2024 (USD Million)
- TABLE 149 India laser-induced breakdown spectroscopy (LIBS) market size, by end-use, 2025 - 2032 (USD Million)
- TABLE 150 Australia laser-induced breakdown spectroscopy (LIBS) market size, by product, 2018- 2024 (USD Million)
- TABLE 151 Australia laser-induced breakdown spectroscopy (LIBS) market size, by product, 2025- 2032 (USD Million)
- TABLE 152 Australia laser-induced breakdown spectroscopy (LIBS) market volume, by product, 2018- 2024 (Units)
- TABLE 153 Australia laser-induced breakdown spectroscopy (LIBS) market volume, by product, 2025- 2032 (Units)
- TABLE 154 Australia laser-induced breakdown spectroscopy (LIBS) market size, by end-use, 2018 - 2024 (USD Million)
- TABLE 155 Australia laser-induced breakdown spectroscopy (LIBS) market size, by end-use, 2025 - 2032 (USD Million)
- TABLE 156 South Korea laser-induced breakdown spectroscopy (LIBS) market size, by product, 2018- 2024 (USD Million)
- TABLE 157 South Korea laser-induced breakdown spectroscopy (LIBS) market size, by product, 2025- 2032 (USD Million)
- TABLE 158 South Korea laser-induced breakdown spectroscopy (LIBS) market volume, by product, 2018- 2024 (Units)
- TABLE 159 South Korea laser-induced breakdown spectroscopy (LIBS) market volume, by product, 2025- 2032 (Units)
- TABLE 160 South Korea laser-induced breakdown spectroscopy (LIBS) market size, by end-use, 2018 - 2024 (USD Million)
- TABLE 161 South Korea laser-induced breakdown spectroscopy (LIBS) market size, by end-use, 2025 - 2032 (USD Million)
- TABLE 162 New Zealand laser-induced breakdown spectroscopy (LIBS) market size, by product, 2018- 2024 (USD Million)
- TABLE 163 New Zealand laser-induced breakdown spectroscopy (LIBS) market size, by product, 2025- 2032 (USD Million)
- TABLE 164 New Zealand laser-induced breakdown spectroscopy (LIBS) market volume, by product, 2018- 2024 (Units)
- TABLE 165 New Zealand laser-induced breakdown spectroscopy (LIBS) market volume, by product, 2025- 2032 (Units)
- TABLE 166 New Zealand laser-induced breakdown spectroscopy (LIBS) market size, by end-use, 2018 - 2024 (USD Million)
- TABLE 167 New Zealand laser-induced breakdown spectroscopy (LIBS) market size, by end-use, 2025 - 2032 (USD Million)
- TABLE 168 Thailand laser-induced breakdown spectroscopy (LIBS) market size, by product, 2018- 2024 (USD Million)
- TABLE 169 Thailand laser-induced breakdown spectroscopy (LIBS) market size, by product, 2025- 2032 (USD Million)
- TABLE 170 Thailand laser-induced breakdown spectroscopy (LIBS) market volume, by product, 2018- 2024 (Units)
- TABLE 171 Thailand laser-induced breakdown spectroscopy (LIBS) market volume, by product, 2025- 2032 (Units)
- TABLE 172 Thailand laser-induced breakdown spectroscopy (LIBS) market size, by end-use, 2018 - 2024 (USD Million)
- TABLE 173 Thailand laser-induced breakdown spectroscopy (LIBS) market size, by end-use, 2025 - 2032 (USD Million)
- TABLE 174 Vietnam laser-induced breakdown spectroscopy (LIBS) market size, by product, 2018- 2024 (USD Million)
- TABLE 175 Vietnam laser-induced breakdown spectroscopy (LIBS) market size, by product, 2025- 2032 (USD Million)
- TABLE 176 Vietnam laser-induced breakdown spectroscopy (LIBS) market volume, by product, 2018- 2024 (Units)
- TABLE 177 Vietnam laser-induced breakdown spectroscopy (LIBS) market volume, by product, 2025- 2032 (Units)
- TABLE 178 Vietnam laser-induced breakdown spectroscopy (LIBS) market size, by end-use, 2018 - 2024 (USD Million)
- TABLE 179 Vietnam laser-induced breakdown spectroscopy (LIBS) market size, by end-use, 2025 - 2032 (USD Million)
- TABLE 180 Indonesia laser-induced breakdown spectroscopy (LIBS) market size, by product, 2018- 2024 (USD Million)
- TABLE 181 Indonesia laser-induced breakdown spectroscopy (LIBS) market size, by product, 2025- 2032 (USD Million)
- TABLE 182 Indonesia laser-induced breakdown spectroscopy (LIBS) market volume, by product, 2018- 2024 (Units)
- TABLE 183 Indonesia laser-induced breakdown spectroscopy (LIBS) market volume, by product, 2025- 2032 (Units)
- TABLE 184 Indonesia laser-induced breakdown spectroscopy (LIBS) market size, by end-use, 2018 - 2024 (USD Million)
- TABLE 185 Indonesia laser-induced breakdown spectroscopy (LIBS) market size, by end-use, 2025 - 2032 (USD Million)
- TABLE 186 Latin America laser-induced breakdown spectroscopy (LIBS) market size, by country, 2018 - 2024 (USD Million)
- TABLE 187 Latin America laser-induced breakdown spectroscopy (LIBS) market size, by country, 2025 - 2032 (USD Million)
- TABLE 188 Latin America laser-induced breakdown spectroscopy (LIBS) market volume, by country, 2018 - 2024 (Units)
- TABLE 189 Latin America laser-induced breakdown spectroscopy (LIBS) market volume, by country, 2025 - 2032 (Units)
- TABLE 190 Latin America laser-induced breakdown spectroscopy (LIBS) market size, by product, 2018- 2024 (USD Million)
- TABLE 191 Latin America laser-induced breakdown spectroscopy (LIBS) market size, by product, 2025- 2032 (USD Million)
- TABLE 192 Latin America laser-induced breakdown spectroscopy (LIBS) market volume, by product, 2018- 2024 (Units)
- TABLE 193 Latin America laser-induced breakdown spectroscopy (LIBS) market volume, by product, 2025- 2032 (Units)
- TABLE 194 Latin America laser-induced breakdown spectroscopy (LIBS) market size, by end-use, 2018 - 2024 (USD Million)
- TABLE 195 Latin America laser-induced breakdown spectroscopy (LIBS) market size, by end-use, 2025 - 2032 (USD Million)
- TABLE 196 Brazil laser-induced breakdown spectroscopy (LIBS) market size, by product, 2018- 2024 (USD Million)
- TABLE 197 Brazil laser-induced breakdown spectroscopy (LIBS) market size, by product, 2025- 2032 (USD Million)
- TABLE 198 Brazil laser-induced breakdown spectroscopy (LIBS) market volume, by product, 2018- 2024 (Units)
- TABLE 199 Brazil laser-induced breakdown spectroscopy (LIBS) market volume, by product, 2025- 2032 (Units)
- TABLE 200 Brazil laser-induced breakdown spectroscopy (LIBS) market size, by end-use, 2018 - 2024 (USD Million)
- TABLE 201 Brazil laser-induced breakdown spectroscopy (LIBS) market size, by end-use, 2025 - 2032 (USD Million)
- TABLE 202 Mexico laser-induced breakdown spectroscopy (LIBS) market size, by product, 2018- 2024 (USD Million)
- TABLE 203 Mexico laser-induced breakdown spectroscopy (LIBS) market size, by product, 2025- 2032 (USD Million)
- TABLE 204 Mexico laser-induced breakdown spectroscopy (LIBS) market volume, by product, 2018- 2024 (Units)
- TABLE 205 Mexico laser-induced breakdown spectroscopy (LIBS) market volume, by product, 2025- 2032 (Units)
- TABLE 206 Mexico laser-induced breakdown spectroscopy (LIBS) market size, by end-use, 2018 - 2024 (USD Million)
- TABLE 207 Mexico laser-induced breakdown spectroscopy (LIBS) market size, by end-use, 2025 - 2032 (USD Million)
- TABLE 208 Argentina laser-induced breakdown spectroscopy (LIBS) market size, by product, 2018- 2024 (USD Million)
- TABLE 209 Argentina laser-induced breakdown spectroscopy (LIBS) market size, by product, 2025- 2032 (USD Million)
- TABLE 210 Argentina laser-induced breakdown spectroscopy (LIBS) market volume, by product, 2018- 2024 (Units)
- TABLE 211 Argentina laser-induced breakdown spectroscopy (LIBS) market volume, by product, 2025- 2032 (Units)
- TABLE 212 Argentina laser-induced breakdown spectroscopy (LIBS) market size, by end-use, 2018 - 2024 (USD Million)
- TABLE 213 Argentina laser-induced breakdown spectroscopy (LIBS) market size, by end-use, 2025 - 2032 (USD Million)
- TABLE 214 Colombia laser-induced breakdown spectroscopy (LIBS) market size, by product, 2018- 2024 (USD Million)
- TABLE 215 Colombia laser-induced breakdown spectroscopy (LIBS) market size, by product, 2025- 2032 (USD Million)
- TABLE 216 Colombia laser-induced breakdown spectroscopy (LIBS) market volume, by product, 2018- 2024 (Units)
- TABLE 217 Colombia laser-induced breakdown spectroscopy (LIBS) market volume, by product, 2025- 2032 (Units)
- TABLE 218 Colombia laser-induced breakdown spectroscopy (LIBS) market size, by end-use, 2018 - 2024 (USD Million)
- TABLE 219 Colombia laser-induced breakdown spectroscopy (LIBS) market size, by end-use, 2025 - 2032 (USD Million)
- TABLE 220 Chile laser-induced breakdown spectroscopy (LIBS) market size, by product, 2018- 2024 (USD Million)
- TABLE 221 Chile laser-induced breakdown spectroscopy (LIBS) market size, by product, 2025- 2032 (USD Million)
- TABLE 222 Chile laser-induced breakdown spectroscopy (LIBS) market volume, by product, 2018- 2024 (Units)
- TABLE 223 Chile laser-induced breakdown spectroscopy (LIBS) market volume, by product, 2025- 2032 (Units)
- TABLE 224 Chile laser-induced breakdown spectroscopy (LIBS) market size, by end-use, 2018 - 2024 (USD Million)
- TABLE 225 Chile laser-induced breakdown spectroscopy (LIBS) market size, by end-use, 2025 - 2032 (USD Million)
- TABLE 226 Middle East & Africa laser-induced breakdown spectroscopy (LIBS) market size, by country, 2018 - 2024 (USD Million)
- TABLE 227 Middle East & Africa laser-induced breakdown spectroscopy (LIBS) market size, by country, 2025 - 2032 (USD Million)
- TABLE 228 Middle East & Africa laser-induced breakdown spectroscopy (LIBS) market volume, by country, 2018 - 2024 (Units)
- TABLE 229 Middle East & Africa laser-induced breakdown spectroscopy (LIBS) market volume, by country, 2025 - 2032 (Units)
- TABLE 230 Middle East & Africa laser-induced breakdown spectroscopy (LIBS) market size, by product, 2018- 2024 (USD Million)
- TABLE 231 Middle East & Africa laser-induced breakdown spectroscopy (LIBS) market size, by product, 2025- 2032 (USD Million)
- TABLE 232 Middle East & Africa laser-induced breakdown spectroscopy (LIBS) market volume, by product, 2018- 2024 (Units)
- TABLE 233 Middle East & Africa laser-induced breakdown spectroscopy (LIBS) market volume, by product, 2025- 2032 (Units)
- TABLE 234 Middle East & Africa laser-induced breakdown spectroscopy (LIBS) market size, by end-use, 2018 - 2024 (USD Million)
- TABLE 235 Middle East & Africa laser-induced breakdown spectroscopy (LIBS) market size, by end-use, 2025 - 2032 (USD Million)
- TABLE 236 South Africa laser-induced breakdown spectroscopy (LIBS) market size, by product, 2018- 2024 (USD Million)
- TABLE 237 South Africa laser-induced breakdown spectroscopy (LIBS) market size, by product, 2025- 2032 (USD Million)
- TABLE 238 South Africa laser-induced breakdown spectroscopy (LIBS) market volume, by product, 2018- 2024 (Units)
- TABLE 239 South Africa laser-induced breakdown spectroscopy (LIBS) market volume, by product, 2025- 2032 (Units)
- TABLE 240 South Africa laser-induced breakdown spectroscopy (LIBS) market size, by end-use, 2018 - 2024 (USD Million)
- TABLE 241 South Africa laser-induced breakdown spectroscopy (LIBS) market size, by end-use, 2025 - 2032 (USD Million)
- TABLE 242 Saudi Arabia laser-induced breakdown spectroscopy (LIBS) market size, by product, 2018- 2024 (USD Million)
- TABLE 243 Saudi Arabia laser-induced breakdown spectroscopy (LIBS) market size, by product, 2025- 2032 (USD Million)
- TABLE 244 Saudi Arabia laser-induced breakdown spectroscopy (LIBS) market volume, by product, 2018- 2024 (Units)
- TABLE 245 Saudi Arabia laser-induced breakdown spectroscopy (LIBS) market volume, by product, 2025- 2032 (Units)
- TABLE 246 Saudi Arabia laser-induced breakdown spectroscopy (LIBS) market size, by end-use, 2018 - 2024 (USD Million)
- TABLE 247 Saudi Arabia laser-induced breakdown spectroscopy (LIBS) market size, by end-use, 2025 - 2032 (USD Million)
- TABLE 248 UAE laser-induced breakdown spectroscopy (LIBS) market size, by product, 2018- 2024 (USD Million)
- TABLE 249 UAE laser-induced breakdown spectroscopy (LIBS) market size, by product, 2025- 2032 (USD Million)
- TABLE 250 UAE laser-induced breakdown spectroscopy (LIBS) market volume, by product, 2018- 2024 (Units)
- TABLE 251 UAE laser-induced breakdown spectroscopy (LIBS) market volume, by product, 2025- 2032 (Units)
- TABLE 252 UAE laser-induced breakdown spectroscopy (LIBS) market size, by end-use, 2018 - 2024 (USD Million)
- TABLE 253 UAE laser-induced breakdown spectroscopy (LIBS) market size, by end-use, 2025 - 2032 (USD Million)
- TABLE 254 Turkey laser-induced breakdown spectroscopy (LIBS) market size, by product, 2018- 2024 (USD Million)
- TABLE 255 Turkey laser-induced breakdown spectroscopy (LIBS) market size, by product, 2025- 2032 (USD Million)
- TABLE 256 Turkey laser-induced breakdown spectroscopy (LIBS) market volume, by product, 2018- 2024 (Units)
- TABLE 257 Turkey laser-induced breakdown spectroscopy (LIBS) market volume, by product, 2025- 2032 (Units)
- TABLE 258 Turkey laser-induced breakdown spectroscopy (LIBS) market size, by end-use, 2018 - 2024 (USD Million)
- TABLE 259 Turkey laser-induced breakdown spectroscopy (LIBS) market size, by end-use, 2025 - 2032 (USD Million)
Charts & Figures
- FIG. 1 Top-down approach
- FIG. 2 Market estimation and forecast methodology
- FIG. 3 Market forecasting methodology
- FIG. 4 Breakdown of primary participants
- FIG. 5 Global laser-induced breakdown spectroscopy industry 360 degree synopsis, 2018 - 2032
- FIG. 6 Industry ecosystem analysis
- FIG. 7 Growth potential analysis, by product
- FIG. 8 Growth potential analysis, by end-use
- FIG. 9 Porter's analysis
- FIG. 10 PESTEL analysis
- FIG. 11 Company matrix analysis, 2022
- FIG. 12 Competitive dashboard, 2022
- FIG. 13 Company market share analysis, 2022
- FIG. 14 Competitive analysis of major market players
- FIG. 15 Competitive positioning matrix
- FIG. 16 Strategic outlook matrix
Laser-induced Breakdown Spectroscopy (LIBS) Market size is set to witness 6.2% CAGR from 2023-2032, driven by the escalating environmental concerns worldwide. With the surging global awareness of environmental issues, pollution, and resource depletion, the need for precise and rapid analytical techniques has become paramount. LIBS technology thus offers powerful solutions to address these concerns by offering accurate elemental analysis in various applications.
Moreover, the rising preference for advanced tools that are faster, more accurate with no destructive metal composition assessment in metallurgy, mining, and manufacturing will propel the industry growth. For instance, in July 2023, TOMRA Recycling Sorting, a global manufacturer of sensor-based sorting technology, launched AUTOSORTTM PULSE, a new machine with dynamic LIBS for high throughput sorting of aluminum alloys.
Laser-induced breakdown spectroscopy market is segmented based on product, end-use, and region.
With respect to product, the desktop LIBS market size is anticipated to witness 5.6% CAGR through 2032. The compact size, affordability, portability, and ease of use of desktop laser-induced breakdown spectroscopy devices have expanded their accessibility to broader range of users, from researchers to industrial professionals. Moreover, recent advancements in desktops in terms of sensitivity, precision, and speed have extended the scope of applications of the technology across mining, metals, and environmental monitoring.
Based on end-use, the industry size from the academic and research institutes segment is expected to record 6.2% growth rate from 2023-2032. This is due to the increasing adoption of LIBS in the arsenal of academic and research institutions due to its versatility and analytical capabilities. Researchers across various scientific disciplines, including chemistry, geology, environmental science, and materials science, rely on this technology for elemental analysis, further contributing to the segment growth.
Regionally, Asia Pacific laser-induced breakdown spectroscopy market size is expected to expand at 6.6% CAGR from 2023-2032. This expansion can be attributed to the evolving industrial landscape and higher emphasis on advanced analytical technologies. Moreover, the presence of emerging economies with fast-growing academic and research sectors are fostering innovations in LIBS applications.
The ongoing R&D investments by academic institutions have also increased the acceptance of the technology for scientific discovery in the region. To cite an instance, in August 2023, the Indian Chandrayaan-3 Rover's Laser-Induced Breakdown Spectroscopy instrument took the first in-situ measurements of the lunar surface's elemental composition close to the south pole.
Table of Contents
Chapter 1 Methodology & Scope
- 1.1 Market definitions
- 1.2 Base estimates & working
- 1.2.1 Data collection
- 1.3 Forecast calculations
- 1.4 COVID-19 impact analysis at global level
- 1.5 Data validation
- 1.6 Data sources
- 1.6.1 Primary
- 1.6.2 Secondary
- 1.6.2.1 Paid sources
- 1.6.2.2 Unpaid sources
Chapter 2 Executive Summary
- 2.1 Laser-induced breakdown spectroscopy industry 360 degree synopsis, 2018 - 2032 (USD Million)
- 2.2 Business trends
- 2.3 Regional trends (USD Million & Units)
- 2.4 Product trends (USD Million & Units)
- 2.5 End-use trends
Chapter 3 Laser-induced Breakdown Spectroscopy (LIBS) Industry Insights
- 3.1 Industry ecosystem analysis
- 3.2 Industry impact forces
- 3.2.1 Growth drivers
- 3.2.1.1 Increasing use of LIBS in the pharmaceutical industry
- 3.2.1.2 Technological advancements
- 3.2.1.3 Enhanced regulatory framework.
- 3.2.1.4 Expanding applications in various industries
- 3.2.2 Industry pitfalls & challenges
- 3.2.2.1 High cost associated with devices
- 3.2.2.2 Lack of standardization
- 3.2.1 Growth drivers
- 3.3 Growth potential analysis
- 3.3.1 By product
- 3.3.2 By end-use
- 3.4 COVID-19 impact analysis
- 3.5 Technology landscape
- 3.6 Regulatory landscape
- 3.6.1 U.S.
- 3.6.2 Europe
- 3.6.3 Asia Pacific
- 3.7 Porter's analysis
- 3.8 PESTEL analysis
Chapter 4 Competitive landscape, 2022
- 4.1 Introduction
- 4.2 Company matrix analysis, 2022
- 4.3 Competitive dashboard, 2022
- 4.4 Company market share analysis, 2022
- 4.5 Vendor matrix analysis, 2022
- 4.6 Competitive analysis of major market players
- 4.7 Competitive positioning matrix
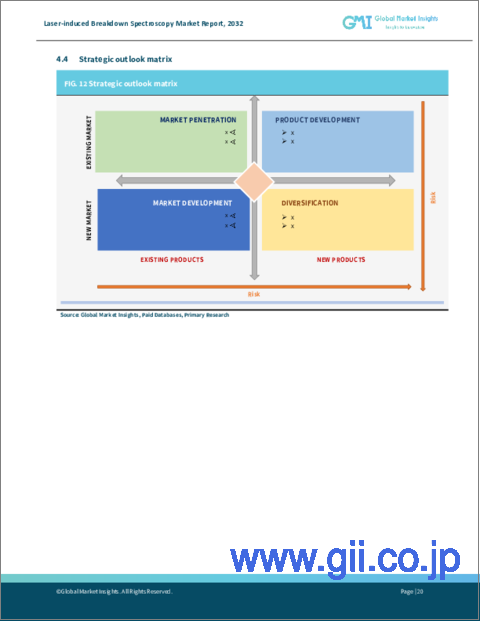
- 4.8 Strategic outlook matrix
Chapter 5 Laser-induced Breakdown Spectroscopy (LIBS) Market Size and Forecast, By Product (USD Million & Units)
- 5.1 Key trends, by product
- 5.2 Handheld
- 5.3 Desktop
Chapter 6 Laser-induced Breakdown Spectroscopy (LIBS) Market Size and Forecast, By End-use (USD Million)
- 6.1 Key trends, by end-use
- 6.2 Academic and research institutes
- 6.3 Pharmaceuticals and biotechnology companies
- 6.4 Others
Chapter 7 Laser-induced Breakdown Spectroscopy (LIBS) Market Size and Forecast, By Region (USD Million & Units)
- 7.1 Key trends, by region
- 7.2 North America
- 7.2.1 U.S.
- 7.2.2 Canada
- 7.3 Europe
- 7.3.1 Germany
- 7.3.2 UK
- 7.3.3 France
- 7.3.4 Italy
- 7.3.5 Spain
- 7.3.6 Switzerland
- 7.3.7 The Netherlands
- 7.3.8 Denmark
- 7.3.9 Poland
- 7.3.10 Sweden
- 7.4 Asia Pacific
- 7.4.1 China
- 7.4.2 Japan
- 7.4.3 India
- 7.4.4 Australia
- 7.4.5 South Korea
- 7.4.6 New Zealand
- 7.4.7 Vietnam
- 7.4.8 Indonesia
- 7.5 Latin America
- 7.5.1 Brazil
- 7.5.2 Mexico
- 7.5.3 Argentina
- 7.5.4 Colombia
- 7.5.5 Chile
- 7.6 Middle East & Africa
- 7.6.1 Saudi Arabia
- 7.6.2 South Africa
- 7.6.3 UAE
- 7.6.4 Turkey
Chapter 8 Company Profiles
- 8.1 Thermo Fisher Scientific Inc.
- 8.2 Hitachi High-Tech Analytical Science
- 8.3 SciAps, Inc.
- 8.4 Rigaku, Bruker Corporation
- 8.5 TSI Incorporated
- 8.6 Princeton Instruments
- 8.7 Avantes
- 8.8 B&W Tek
- 8.9 Applied Spectra
- 8.10 SECOPTA analytics GmbH
