
|
市場調査レポート
商品コード
1666664
電圧変換器市場の機会、成長促進要因、産業動向分析、2025~2034年の予測Voltage Transducer Market Opportunity, Growth Drivers, Industry Trend Analysis, and Forecast 2025 - 2034 |
||||||
カスタマイズ可能
|
|||||||
| 電圧変換器市場の機会、成長促進要因、産業動向分析、2025~2034年の予測 |
|
出版日: 2024年12月27日
発行: Global Market Insights Inc.
ページ情報: 英文 110 Pages
納期: 2~3営業日
|

全表示
- 概要
- 目次
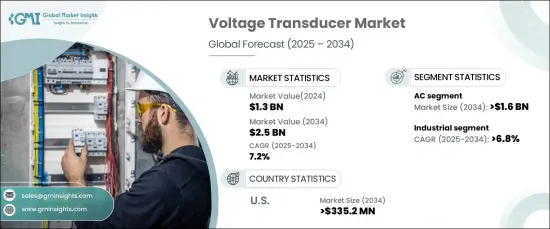
電圧変換器の世界市場は、2024年に13億米ドルと評価され、2025年から2034年にかけてCAGR 7.2%で成長すると予測されています。
市場成長の原動力は、様々な産業における電気システムの精密な監視と制御に対する需要の高まりです。電圧変換器は、高電圧信号を自動化、計測、保護システムで使用される安全で測定可能な出力に変換するために重要です。
電圧変換器の統合は、システム性能を高め、運用の信頼性を確保するために、産業界全体でますます一般的になってきています。さらに、高度な電気インフラとスマートグリッドの採用が拡大していることも、市場の需要を加速しています。電圧変換器は、効率的なエネルギー管理、リアルタイムのシステム監視、安全性の向上を可能にし、最新の電気ネットワークに不可欠なものとなっています。
| 市場範囲 | |
|---|---|
| 開始年 | 2024 |
| 予測年 | 2025-2034 |
| 開始金額 | 13億米ドル |
| 予測金額 | 25億米ドル |
| CAGR | 7.2% |
技術革新により、電圧トランスデューサの状況は変化しており、新しい開発では精度の向上、コンパクトな設計、信頼性が重視されています。デジタル・ワイヤレス変換器の登場は、特にIoT対応システムや遠隔監視ソリューションへの応用を拡大しました。これらの進歩は、より優れたデータ収集と分析プラットフォームとの統合をサポートし、予知保全機能と業務効率の改善につながります。
市場は製品別にAC電圧変換器とDC電圧変換器に区分されます。AC電圧変換器セグメントは大きな成長を遂げ、2034年には160万米ドルを超えると予想されています。この成長の原動力となっているのは、さまざまな分野で交流電圧信号を正確に監視・管理する必要性です。効率的なエネルギー利用と保護のために出力を標準化するAC変換器の能力は、いくつかの用途で不可欠なものとなっています。
用途別では、産業、自動車、鉄道、再生可能エネルギー、その他の分野があります。産業用セグメントは予測期間中にCAGR 6.8%以上で成長すると予測されています。製造および自動化システムにおける正確な電圧管理への注目の高まりが、この成長を後押ししています。デジタルおよびIoT対応変換器は、産業環境におけるリアルタイムモニタリング、予知保全、エネルギー最適化を可能にする上で極めて重要な役割を果たしています。
米国では、電圧変換器市場は2034年までに3億3,520万米ドルを超えると予測されています。産業オートメーションの進歩、スマート電力網、最新のエネルギーシステムの採用などの要因が市場拡大を後押ししています。電圧変換器は、電力システムの信頼性、効率性、安全性を確保するために不可欠です。
目次
第1章 調査手法と調査範囲
- 市場の定義
- 基本推定と計算
- 予測計算
- データソース
- 1次データ
- 2次データ
- 有償
- 公的
第2章 エグゼクティブサマリー
第3章 業界洞察
- エコシステム分析
- 規制状況
- 業界への影響要因
- 促進要因
- 業界の潜在的リスク&課題
- 成長可能性分析
- ポーターの分析
- 供給企業の交渉力
- 買い手の交渉力
- 新規参入業者の脅威
- 代替品の脅威
- PESTEL分析
第4章 競合情勢
- 戦略ダッシュボード
- イノベーションと持続可能性の展望
第5章 市場規模・予測:製品別、2021年~2034年
- 主要動向
- 交流
- 直流
第6章 市場規模・予測:用途別、2021~2034年
- 主要動向
- 鉄道
- 再生可能エネルギー
- 産業用
- 自動車
- その他
第7章 市場規模・予測:地域別、2021~2034年
- 主要動向
- 北米
- 米国
- カナダ
- メキシコ
- 欧州
- 英国
- フランス
- ドイツ
- イタリア
- ロシア
- スペイン
- アジア太平洋
- 中国
- オーストラリア
- インド
- 日本
- 韓国
- 中東・アフリカ
- サウジアラビア
- アラブ首長国連邦
- トルコ
- 南アフリカ
- エジプト
- ラテンアメリカ
- ブラジル
- アルゼンチン
第8章 企業プロファイル
- ABB
- Analog Devices
- Carlo Gavazzi
- CR Magnetics
- LEM International
- NK Technologies
- Phoenix Contact
- Schneider Electric
- Siemens
- Socomec
The Global Voltage Transducer Market was valued at USD 1.3 billion in 2024 and is projected to grow at a CAGR of 7.2% from 2025 to 2034. The market's growth is fueled by the rising demand for precise monitoring and control of electrical systems across various industries. Voltage transducers are critical for transforming high-voltage signals into safe, measurable outputs used in automation, metering, and protection systems.
The integration of voltage transducers is becoming increasingly common across industries to enhance system performance and ensure operational reliability. Additionally, the growing adoption of advanced electrical infrastructure and smart grids is accelerating market demand. Voltage transducers enable efficient energy management, real-time system monitoring, and improved safety, making them indispensable in modern electrical networks.
| Market Scope | |
|---|---|
| Start Year | 2024 |
| Forecast Year | 2025-2034 |
| Start Value | $1.3 Billion |
| Forecast Value | $2.5 Billion |
| CAGR | 7.2% |
Innovations in technology are reshaping the voltage transducer landscape, with new developments emphasizing enhanced accuracy, compact design, and reliability. The advent of digital and wireless transducers has expanded their applications, particularly in IoT-enabled systems and remote monitoring solutions. These advancements support better data collection and integration with analytics platforms, leading to predictive maintenance capabilities and improved operational efficiency.
The market is segmented by product into AC and DC voltage transducers. The AC voltage transducer segment is expected to achieve significant growth, surpassing USD 1.6 million by 2034. This growth is driven by the need for accurate monitoring and management of alternating voltage signals in various sectors. The ability of AC transducers to standardize outputs for efficient energy use and protection makes them vital in several applications.
By application, the market includes industrial, automotive, railway, renewables, and other sectors. The industrial segment is anticipated to grow at a CAGR of over 6.8% during the forecast period. The increasing focus on precise voltage management in manufacturing and automation systems is propelling this growth. Digital and IoT-enabled transducers are playing a pivotal role in enabling real-time monitoring, predictive maintenance, and energy optimization in industrial settings.
In the U.S., the voltage transducer market is projected to surpass USD 335.2 million by 2034. Factors such as advancements in industrial automation, smart electrical grids, and the adoption of modern energy systems are driving market expansion. Voltage transducers are essential for ensuring reliability, efficiency, and safety in power systems.
Table of Contents
Chapter 1 Methodology & Scope
- 1.1 Market definitions
- 1.2 Base estimates & calculations
- 1.3 Forecast calculation
- 1.4 Data sources
- 1.4.1 Primary
- 1.4.2 Secondary
- 1.4.2.1 Paid
- 1.4.2.2 Public
Chapter 2 Executive Summary
- 2.1 Industry synopsis, 2021 – 2034
Chapter 3 Industry Insights
- 3.1 Industry ecosystem analysis
- 3.2 Regulatory landscape
- 3.3 Industry impact forces
- 3.3.1 Growth drivers
- 3.3.2 Industry pitfalls & challenges
- 3.4 Growth potential analysis
- 3.5 Porter's Analysis
- 3.5.1 Bargaining power of suppliers
- 3.5.2 Bargaining power of buyers
- 3.5.3 Threat of new entrants
- 3.5.4 Threat of substitutes
- 3.6 PESTEL Analysis
Chapter 4 Competitive landscape, 2024
- 4.1 Strategic dashboard
- 4.2 Innovation & sustainability landscape
Chapter 5 Market Size and Forecast, By Product, 2021 – 2034 (USD Million)
- 5.1 Key trends
- 5.2 AC
- 5.3 DC
Chapter 6 Market Size and Forecast, By Application, 2021 – 2034 (USD Million)
- 6.1 Key trends
- 6.2 Railway
- 6.3 Renewables
- 6.4 Industrial
- 6.5 Automotive
- 6.6 Others
Chapter 7 Market Size and Forecast, By Region, 2021 – 2034 (USD million)
- 7.1 Key trends
- 7.2 North America
- 7.2.1 U.S.
- 7.2.2 Canada
- 7.2.3 Mexico
- 7.3 Europe
- 7.3.1 UK
- 7.3.2 France
- 7.3.3 Germany
- 7.3.4 Italy
- 7.3.5 Russia
- 7.3.6 Spain
- 7.4 Asia Pacific
- 7.4.1 China
- 7.4.2 Australia
- 7.4.3 India
- 7.4.4 Japan
- 7.4.5 South Korea
- 7.5 Middle East & Africa
- 7.5.1 Saudi Arabia
- 7.5.2 UAE
- 7.5.3 Turkey
- 7.5.4 South Africa
- 7.5.5 Egypt
- 7.6 Latin America
- 7.6.1 Brazil
- 7.6.2 Argentina
Chapter 8 Company Profiles
- 8.1 ABB
- 8.2 Analog Devices
- 8.3 Carlo Gavazzi
- 8.4 CR Magnetics
- 8.5 LEM International
- 8.6 NK Technologies
- 8.7 Phoenix Contact
- 8.8 Schneider Electric
- 8.9 Siemens
- 8.10 Socomec

