
|
市場調査レポート
商品コード
1666957
VRLA SLIバッテリー市場の機会、成長促進要因、産業動向分析、2025~2034年の予測VRLA SLI Battery Market Opportunity, Growth Drivers, Industry Trend Analysis, and Forecast 2025 - 2034 |
||||||
カスタマイズ可能
|
|||||||
| VRLA SLIバッテリー市場の機会、成長促進要因、産業動向分析、2025~2034年の予測 |
|
出版日: 2024年12月09日
発行: Global Market Insights Inc.
ページ情報: 英文 100 Pages
納期: 2~3営業日
|

全表示
- 概要
- 目次
VRLA SLIバッテリーの世界市場は2024年に96億米ドルに達し、2025年から2034年にかけてCAGR 3.6%で成長すると予測されています。
この成長の原動力となっているのは、特に自動車分野での、信頼性が高くメンテナンスの少ないエネルギー貯蔵ソリューションに対する需要の高まりです。耐久性と効率で知られるVRLA電池は、最新の自動車に不可欠な部品となっています。
技術の中では、吸収ガラスマット(AGM)バッテリーが市場を独占し、2034年までに105億米ドルを生み出すと予想されています。低メンテナンス設計と、スタート・ストップ車やハイブリッド車を含む先進自動車システムとの互換性により、AGM電池は好ましい選択肢となっています。優れたディープサイクル性能と耐振動性が認められているGEL電池も支持を集めています。メーカーはこれらの技術を継続的に革新し、リアルタイム・モニタリングや予知保全などのスマート機能を統合して、進化する消費者ニーズや業界標準に合わせています。
| 市場範囲 | |
|---|---|
| 開始年 | 2024 |
| 予測年 | 2025-2034 |
| 開始金額 | 96億米ドル |
| 予測金額 | 138億米ドル |
| CAGR | 3.6% |
アフターマーケット販売チャネルは、2025~2034年のCAGRが3.5%と推定され、大幅な成長が見込まれています。この拡大の背景には、老朽化した自動車のバッテリー交換ニーズの増加と、利便性と競合価格を提供するeコマース・プラットフォームの人気の高まりがあります。消費者はアフターマーケット製品の購入にサービスセンター、小売店、オンラインストアを選ぶようになっています。メーカー各社は、OEM(相手先ブランド製造)チャネルとアフターマーケットチャネルの両方を活用して市場への浸透を図り、製品の普及とコスト効率と信頼性の高いバッテリーソリューションの需要に応えています。
米国のVRLA SLIバッテリー市場は、2034年まで25億米ドルを生み出すと予測されており、スタート・ストップ車やハイブリッド車の採用が増加していることがその要因となっています。バッテリーメーカーと自動車メーカーのパートナーシップは、最新の自動車システムの厳しい要件を満たす高性能AGMおよびGELバッテリーの供給に重点を置いて強化されています。米国市場ではオンライン販売も伸びており、消費者はその利便性と手頃な価格からバッテリー交換をデジタル・プラットフォームで行うようになっています。
業界では持続可能性が重要な焦点として浮上しており、生産者はリサイクル可能な物質やエネルギー効率の高い生産方法を模索しています。こうした取り組みは、環境への影響を減らすための世界の取り組みと一致しており、持続可能なエネルギー貯蔵ソリューションとしてのVRLA電池の魅力を高めています。
目次
第1章 調査手法と調査範囲
- 市場の定義
- 基本推定と計算
- 予測計算
- データソース
- 1次データ
- 2次データ
- 有償
- 公的
第2章 エグゼクティブサマリー
第3章 業界洞察
- エコシステム分析
- 規制状況
- 業界への影響要因
- 促進要因
- 業界の潜在的リスク&課題
- 成長可能性分析
- ポーターの分析
- 供給企業の交渉力
- 買い手の交渉力
- 新規参入業者の脅威
- 代替品の脅威
- PESTEL分析
第4章 競合情勢
- 戦略ダッシュボード
- イノベーションと持続可能性の展望
第5章 市場規模・予測:技術別、2021年~2034年
- 主要動向
- AGM
- GEL
第6章 市場規模・予測:販売チャネル別、2021年~2034年
- 主要動向
- OEM
- アフターマーケット
第7章 市場規模・予測:地域別、2021年~2034年
- 主要動向
- 北米
- 米国
- カナダ
- 欧州
- ロシア
- フランス
- ドイツ
- イタリア
- 英国
- アジア太平洋
- 中国
- 日本
- インド
- オーストラリア
- 韓国
- 中東・アフリカ
- サウジアラビア
- アラブ首長国連邦
- イラン
- トルコ
- ラテンアメリカ
- アルゼンチン
- ブラジル
第8章 企業プロファイル
- ACDelco
- Accumulators Moura
- Amara Raja Group
- Banner Batteries
- Clarios
- Continental Battery Systems
- Crown Battery
- East Penn Manufacturing
- Enersys
- Exide Technologies
- FIAMM Energy Technology
- GS Yuasa International
- Hankook &Company
- Interstate Batteries
- Leoch International Technology
- MOLL Batterien
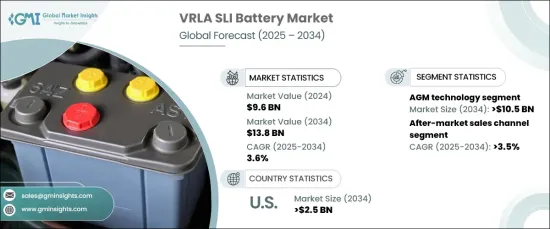
The Global VRLA SLI Battery Market reached USD 9.6 billion in 2024 and is projected to grow at a CAGR of 3.6% during 2025-2034. This growth is fueled by the rising demand for reliable, low-maintenance energy storage solutions, particularly in the automotive sector. VRLA batteries, known for their durability and efficiency, are becoming essential components in modern vehicles.
Among the technologies, Absorbent Glass Mat (AGM) batteries are expected to dominate the market, generating USD 10.5 billion through 2034. Their low-maintenance design and compatibility with advanced automotive systems, including start-stop and hybrid vehicles, make them a preferred choice. GEL batteries, recognized for their superior deep-cycle performance and resistance to vibrations, are also gaining traction. Manufacturers are continuously innovating these technologies, integrating smart features like real-time monitoring and predictive maintenance to align with evolving consumer needs and industry standards.
| Market Scope | |
|---|---|
| Start Year | 2024 |
| Forecast Year | 2025-2034 |
| Start Value | $9.6 Billion |
| Forecast Value | $13.8 Billion |
| CAGR | 3.6% |
The aftermarket sales channel is poised for significant growth, with an estimated CAGR of 3.5% between 2025 and 2034. This expansion is driven by the increasing need for replacement batteries in aging vehicles and the growing popularity of e-commerce platforms, which offer convenience and competitive pricing. Consumers are increasingly opting for service centers, retail outlets, and online stores to purchase aftermarket products. Manufacturers are leveraging both original equipment manufacturer (OEM) and aftermarket channels to enhance market penetration, ensuring widespread product availability and meeting the demand for cost-effective and dependable battery solutions.
U.S. VRLA SLI battery market is anticipated to generate USD 2.5 billion through 2034, fueled by the rising adoption of start-stop and hybrid vehicles. Partnerships between battery manufacturers and automakers are intensifying, with a focus on supplying high-performance AGM and GEL batteries that meet the stringent requirements of modern automotive systems. The U.S. market is also witnessing growth in online sales as consumers increasingly turn to digital platforms for battery replacements due to their convenience and affordability.
Sustainability is emerging as a critical focus in the industry, with producers exploring recyclable substances and energy-effective production methods. These initiatives align with global efforts to reduce environmental impact, enhancing the appeal of VRLA batteries as a sustainable energy storage solution.
Table of Contents
Chapter 1 Methodology & Scope
- 1.1 Market definitions
- 1.2 Base estimates & calculations
- 1.3 Forecast calculation
- 1.4 Data sources
- 1.4.1 Primary
- 1.4.2 Secondary
- 1.4.2.1 Paid
- 1.4.2.2 Public
Chapter 2 Executive Summary
- 2.1 Industry synopsis, 2021 - 2034
Chapter 3 Industry Insights
- 3.1 Industry ecosystem analysis
- 3.2 Regulatory landscape
- 3.3 Industry impact forces
- 3.3.1 Growth drivers
- 3.3.2 Industry pitfalls & challenges
- 3.4 Growth potential analysis
- 3.5 Porter's analysis
- 3.5.1 Bargaining power of suppliers
- 3.5.2 Bargaining power of buyers
- 3.5.3 Threat of new entrants
- 3.5.4 Threat of substitutes
- 3.6 PESTEL analysis
Chapter 4 Competitive Landscape, 2024
- 4.1 Strategic dashboard
- 4.2 Innovation & sustainability landscape
Chapter 5 Market Size and Forecast, By Technology, 2021 – 2034 (USD Million, Million Units)
- 5.1 Key trends
- 5.2 AGM
- 5.3 GEL
Chapter 6 Market Size and Forecast, By Sales Channel, 2021 – 2034 (USD Million, Million Units)
- 6.1 Key trends
- 6.2 OEM
- 6.3 Aftermarket
Chapter 7 Market Size and Forecast, By Region, 2021 – 2034 (USD Million, Million Units)
- 7.1 Key trends
- 7.2 North America
- 7.2.1 U.S.
- 7.2.2 Canada
- 7.3 Europe
- 7.3.1 Russia
- 7.3.2 France
- 7.3.3 Germany
- 7.3.4 Italy
- 7.3.5 UK
- 7.4 Asia Pacific
- 7.4.1 China
- 7.4.2 Japan
- 7.4.3 India
- 7.4.4 Australia
- 7.4.5 South Korea
- 7.5 Middle East & Africa
- 7.5.1 Saudi Arabia
- 7.5.2 UAE
- 7.5.3 Iran
- 7.5.4 Turkey
- 7.6 Latin America
- 7.6.1 Argentina
- 7.6.2 Brazil
Chapter 8 Company Profiles
- 8.1 ACDelco
- 8.2 Accumulators Moura
- 8.3 Amara Raja Group
- 8.4 Banner Batteries
- 8.5 Clarios
- 8.6 Continental Battery Systems
- 8.7 Crown Battery
- 8.8 East Penn Manufacturing
- 8.9 Enersys
- 8.10 Exide Technologies
- 8.11 FIAMM Energy Technology
- 8.12 GS Yuasa International
- 8.13 Hankook & Company
- 8.14 Interstate Batteries
- 8.15 Leoch International Technology
- 8.16 MOLL Batterien

