
|
市場調査レポート
商品コード
1685206
衛星IoT市場の機会、成長促進要因、産業動向分析、2025年~2034年の予測Satellite IoT Market Opportunity, Growth Drivers, Industry Trend Analysis, and Forecast 2025 - 2034 |
||||||
カスタマイズ可能
|
|||||||
| 衛星IoT市場の機会、成長促進要因、産業動向分析、2025年~2034年の予測 |
|
出版日: 2025年01月09日
発行: Global Market Insights Inc.
ページ情報: 英文 180 Pages
納期: 2~3営業日
|

全表示
- 概要
- 目次
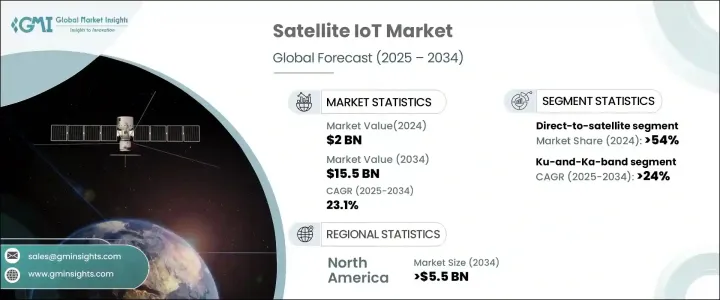
世界の衛星IoT市場は2024年に20億米ドルに達し、2025年から2034年にかけて23.1%のCAGRで顕著に成長すると予測されています。
遠隔地やアクセスしにくい地域での中断のないIoT接続への依存の高まりが、この成長の主要な推進力となっています。従来の通信ネットワークは、そのような地域では信頼性の高いカバレッジを提供できないことが多く、リアルタイムのデータ伝送に依存する産業にとって衛星ベースのソリューションが不可欠となっています。物流、農業、エネルギー分野の企業は、衛星IoTを活用して業務の最適化、効率性の向上、リアルタイム分析による意思決定の改善を図っています。企業が資産追跡、環境監視、緊急対応能力を優先するにつれて、シームレスな通信に対する需要が高まっており、市場拡大にさらに拍車をかけています。
衛星技術の進歩、低軌道(LEO)衛星ネットワークの展開拡大、宇宙ベースのIoT接続の採用拡大が市場の成長を加速させています。従来の衛星ネットワークとは異なり、LEO衛星は大規模な地上インフラを必要とせず、シームレスで低遅延の接続性を提供するため、カバレッジの拡大を目指す企業にとって好ましい選択肢となっています。衛星IoTソリューションの手頃な価格と拡張性により、あらゆる規模の企業が高度な通信システムを業務に組み込むことが可能になっています。政府や民間宇宙機関は、世界な接続性を強化するために衛星コンステレーションに多額の投資を行っており、業界の成長をさらに後押ししています。さらに、衛星と地上の接続性を組み合わせたハイブリッド・ネットワーク・モデルの台頭は、遠隔地で事業を展開する企業に新たな機会をもたらしています。
| 市場範囲 | |
|---|---|
| 開始年 | 2024 |
| 予測年 | 2025-2034 |
| 開始金額 | 20億米ドル |
| 予測金額 | 155億米ドル |
| CAGR | 23.1% |
市場はサービスタイプ別に衛星IoTバックホールと衛星間直接接続に区分されます。衛星間直接接続サービスは2024年の市場シェアの54%を占め、今後数年で大きく成長すると予想されます。LEO衛星ネットワークの展開が拡大していることが、この動向を後押ししています。これらの衛星は、大規模な地上インフラを必要とすることなく、信頼性が高く、中断のない接続性を提供するからです。環境モニタリング、資産追跡、緊急対応など、さまざまな業界の企業が、その効率性と費用対効果の高さから衛星直行サービスを採用するケースが増えています。
周波数帯別では、Ku-and-Ka-band、L-band、S-band、その他に分類されます。Ku-and-Kaバンド・セグメントは、高速データ転送と信頼性の高い長距離通信の必要性によって、2034年までCAGR 24%で成長する見通しです。海事、航空、石油・ガスなどの業界では、厳しい環境下でのリアルタイムのモニタリングやシームレスな運用を確保するために、これらの周波数帯を利用するケースが増えています。強化された帯域幅と接続信頼性により、これらの周波数帯は中断のない通信を必要とするビジネスにとって好ましい選択肢となっています。
北米の衛星IoT市場は、2034年までに55億米ドルを生み出すと予想されており、米国が採用推進で主導的な役割を果たしています。LEO衛星技術の継続的な進歩により接続性能が向上している一方、衛星と地上のハイブリッドネットワークへのシフトにより、業界全体でシームレスな通信が確保されています。次世代衛星ネットワークによる遅延の低減と運用コストの削減への注目の高まりは、採用をさらに加速させています。企業が地理的な障壁を克服し、IoT機能を拡大しようとする中、衛星ベースのソリューションは現代の通信インフラに不可欠なものとなりつつあります。
目次
第1章 調査手法と調査範囲
- 市場範囲と定義
- 基本推定と計算
- 予測計算
- データソース
第2章 エグゼクティブサマリー
第3章 業界洞察
- エコシステム分析
- バリューチェーンに影響を与える要因
- 利益率分析
- 破壊
- 将来の展望
- メーカー
- 流通業者
- サプライヤーの状況
- 利益率分析
- 主要ニュース
- 規制状況
- 影響要因
- 促進要因
- 低軌道(LEO)衛星ネットワークの拡大
- 衛星IoTと地上ネットワークの統合により、シームレスな接続が可能に。
- 世界な接続性への需要の高まり
- 衛星IoTシステムへのAIとエッジコンピューティングの組み込みの増加
- IoTデバイス普及率の上昇
- 業界の潜在的リスク&課題
- データ・セキュリティへの懸念
- メンテナンスコストの高さ
- 促進要因
- 成長可能性分析
- ポーター分析
- PESTEL分析
第4章 競合情勢
- イントロダクション
- 企業シェア分析
- 競合のポジショニング・マトリックス
- 戦略展望マトリックス
第5章 市場推計・予測:サービスタイプ別、2021年~2034年
- 主要動向
- 衛星IoTバックホール
- 衛星ダイレクト通信
第6章 市場推計・予測:周波数帯別、2021年~2034年
- 主要動向
- Lバンド
- Ku-Kaバンド
- Sバンド
- その他
第7章 市場推計・予測:組織規模別、2021年~2034年
- 主要動向
- 大企業
- 中小企業
第8章 市場推計・予測:用途別、2021年~2034年
- 主要動向
- 海運
- 石油・ガス
- エネルギー・公益事業
- 運輸・物流
- ヘルスケア
- 農業
- 軍事・防衛
- その他
第9章 市場推計・予測:地域別、2021年~2034年
- 主要動向
- 北米
- 米国
- カナダ
- 欧州
- 英国
- ドイツ
- フランス
- イタリア
- スペイン
- ロシア
- アジア太平洋
- 中国
- インド
- 日本
- 韓国
- オーストラリア
- ラテンアメリカ
- ブラジル
- メキシコ
- 中東・アフリカ
- 南アフリカ
- サウジアラビア
- アラブ首長国連邦
第10章 企業プロファイル
- AAC Clyde Space
- Airbus
- BAE Systems
- Blue Origin
- China Aerospace Science and Technology Corporation
- Exolaunch
- GomSpace
- Lockheed Martin
- Maxar Technologies
- Millennium Space Systems
- Mitsubishi Electric
- Northrop Grumman
- OHB
- OneWeb
- RTX
- Sierra Nevada
- SpaceX
- Thales Alenia Space
The Global Satellite IoT Market reached USD 2 billion in 2024 and is projected to grow at a remarkable CAGR of 23.1% between 2025 and 2034. The increasing reliance on uninterrupted IoT connectivity in remote and inaccessible regions is a key driver of this growth. Traditional communication networks often fail to provide reliable coverage in such areas, making satellite-based solutions indispensable for industries that depend on real-time data transmission. Companies in logistics, agriculture, and energy are leveraging satellite IoT to optimize operations, enhance efficiency, and improve decision-making through real-time analytics. The demand for seamless communication is rising as businesses prioritize asset tracking, environmental monitoring, and emergency response capabilities, further fueling market expansion.
Advancements in satellite technology, the increasing deployment of Low Earth Orbit (LEO) satellite networks, and the growing adoption of space-based IoT connectivity are accelerating the market's growth. Unlike conventional satellite networks, LEO satellites offer seamless, low-latency connectivity without requiring extensive ground infrastructure, making them a preferred choice for companies looking to expand coverage. The affordability and scalability of satellite IoT solutions are enabling enterprises of all sizes to integrate advanced communication systems into their operations. Governments and private space agencies are investing heavily in satellite constellations to enhance global connectivity, further boosting industry growth. Additionally, the rise of hybrid network models that combine satellite and terrestrial connectivity is creating new opportunities for businesses operating in remote locations.
| Market Scope | |
|---|---|
| Start Year | 2024 |
| Forecast Year | 2025-2034 |
| Start Value | $2 Billion |
| Forecast Value | $15.5 Billion |
| CAGR | 23.1% |
The market is segmented by service type into satellite IoT backhaul and direct-to-satellite. Direct-to-satellite services accounted for 54% of the market share in 2024 and are expected to grow significantly in the coming years. The growing deployment of LEO satellite networks is driving this trend, as these satellites provide reliable, uninterrupted connectivity without the need for extensive ground-based infrastructure. Businesses across multiple industries, including environmental monitoring, asset tracking, and emergency response, are increasingly adopting direct-to-satellite services for their efficiency and cost-effectiveness.
By frequency band, the market is categorized into Ku-and-Ka-band, L-band, S-band, and others. The Ku-and-Ka-band segment is poised to grow at a CAGR of 24% through 2034, driven by the need for high-speed data transfer and reliable long-distance communication. Industries such as maritime, aviation, and oil and gas are increasingly utilizing these frequency bands to ensure real-time monitoring and seamless operations in challenging environments. Enhanced bandwidth and connectivity reliability are making these bands the preferred choice for businesses that require uninterrupted communication.
North America satellite IoT market is expected to generate USD 5.5 billion by 2034, with the United States playing a leading role in driving adoption. The continuous advancements in LEO satellite technology are enhancing connectivity performance, while the shift toward hybrid satellite-terrestrial networks is ensuring seamless communication across industries. The growing focus on reducing latency and lowering operational costs through next-generation satellite networks is further accelerating adoption. As enterprises seek to overcome geographic barriers and expand their IoT capabilities, satellite-based solutions are becoming an integral part of modern communication infrastructure.
Table of Contents
Chapter 1 Methodology & Scope
- 1.1 Market scope & definitions
- 1.2 Base estimates & calculations
- 1.3 Forecast calculations
- 1.4 Data sources
- 1.4.1 Primary
- 1.4.2 Secondary
- 1.4.2.1 Paid sources
- 1.4.2.2 Public sources
Chapter 2 Executive Summary
- 2.1 Industry synopsis, 2021-2034
Chapter 3 Industry Insights
- 3.1 Industry ecosystem analysis
- 3.1.1 Factor affecting the value chain
- 3.1.2 Profit margin analysis
- 3.1.3 Disruptions
- 3.1.4 Future outlook
- 3.1.5 Manufacturers
- 3.1.6 Distributors
- 3.2 Supplier landscape
- 3.3 Profit margin analysis
- 3.4 Key news & initiatives
- 3.5 Regulatory landscape
- 3.6 Impact forces
- 3.6.1 Growth drivers
- 3.6.1.1 Expansion of Low Earth Orbit (LEO) satellite networks
- 3.6.1.2 Integration of satellite IoT with terrestrial networks enables seamless connectivity
- 3.6.1.3 Increasing demand for global connectivity
- 3.6.1.4 Growing incorporation of AI and edge computing into satellite IoT systems
- 3.6.1.5 Rise in IoT device penetration
- 3.6.2 Industry pitfalls & challenges
- 3.6.2.1 Data security concerns
- 3.6.2.2 High cost of maintenance
- 3.6.1 Growth drivers
- 3.7 Growth potential analysis
- 3.8 Porter’s analysis
- 3.9 PESTEL analysis
Chapter 4 Competitive Landscape, 2024
- 4.1 Introduction
- 4.2 Company market share analysis
- 4.3 Competitive positioning matrix
- 4.4 Strategic outlook matrix
Chapter 5 Market Estimates & Forecast, By Services Type, 2021-2034 (USD Million)
- 5.1 Key trends
- 5.2 Satellite IoT backhaul
- 5.3 Direct-to-Satellite
Chapter 6 Market Estimates & Forecast, By Frequency Band, 2021-2034 (USD Million)
- 6.1 Key trends
- 6.2 L-Band
- 6.3 Ku-and-Ka-Band
- 6.4 S-Band
- 6.5 Others
Chapter 7 Market Estimates & Forecast, By Organization Size, 2021-2034 (USD Million)
- 7.1 Key trends
- 7.2 Large enterprises
- 7.3 SME
Chapter 8 Market Estimates & Forecast, By Application, 2021-2034 (USD Million)
- 8.1 Key trends
- 8.2 Maritime
- 8.3 Oil & gas
- 8.4 Energy & utilities
- 8.5 Transportation & logistics
- 8.6 Healthcare
- 8.7 Agriculture
- 8.8 Military & defense
- 8.9 Others
Chapter 9 Market Estimates & Forecast, By Region, 2021-2034 (USD Million)
- 9.1 Key trends
- 9.2 North America
- 9.2.1 U.S.
- 9.2.2 Canada
- 9.3 Europe
- 9.3.1 UK
- 9.3.2 Germany
- 9.3.3 France
- 9.3.4 Italy
- 9.3.5 Spain
- 9.3.6 Russia
- 9.4 Asia Pacific
- 9.4.1 China
- 9.4.2 India
- 9.4.3 Japan
- 9.4.4 South Korea
- 9.4.5 Australia
- 9.5 Latin America
- 9.5.1 Brazil
- 9.5.2 Mexico
- 9.6 MEA
- 9.6.1 South Africa
- 9.6.2 Saudi Arabia
- 9.6.3 UAE
Chapter 10 Company Profiles
- 10.1 AAC Clyde Space
- 10.2 Airbus
- 10.3 BAE Systems
- 10.4 Blue Origin
- 10.5 China Aerospace Science and Technology Corporation
- 10.6 Exolaunch
- 10.7 GomSpace
- 10.8 Lockheed Martin
- 10.9 Maxar Technologies
- 10.10 Millennium Space Systems
- 10.11 Mitsubishi Electric
- 10.12 Northrop Grumman
- 10.13 OHB
- 10.14 OneWeb
- 10.15 RTX
- 10.16 Sierra Nevada
- 10.17 SpaceX
- 10.18 Thales Alenia Space

