
|
市場調査レポート
商品コード
1666590
極低温ポンプの市場機会、成長促進要因、産業動向分析、2025年~2034年予測Cryogenic Pumps Market Opportunity, Growth Drivers, Industry Trend Analysis, and Forecast 2025 - 2034 |
||||||
カスタマイズ可能
|
|||||||
| 極低温ポンプの市場機会、成長促進要因、産業動向分析、2025年~2034年予測 |
|
出版日: 2024年12月02日
発行: Global Market Insights Inc.
ページ情報: 英文 100 Pages
納期: 2~3営業日
|

全表示
- 概要
- 目次
世界の極低温ポンプ市場は2024年に23億米ドルに達し、2025年から2034年にかけてCAGR5.5%で成長すると予測されています。
この成長の原動力は、新興国における海外直接投資の増加と産業インフラの拡大です。貯蔵や輸送における水素、LNG、酸素を含む極低温物質の用途の増加が、極低温ポンプの需要をさらに煽ります。持続可能な技術革新と取扱技術の向上が、この業界における事業成長の新たな道を切り開いています。
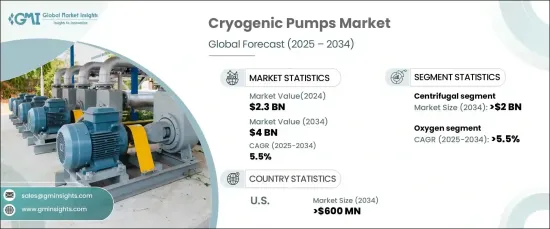
遠心式極低温ポンプは、窒素やアルゴンのような寒剤を含む工業プロセスでの広範な採用によって支えられ、2034年までに20億米ドルを生み出すと予想されています。ヘルスケア、食品・飲料、化学などの分野でLNGの利用が拡大していることが、市場の拡大に大きく寄与しています。より高い効率を実現する超伝導磁気軸受や、極端な温度や圧力に耐えるように設計された複合材料などの技術的進歩が、遠心ポンプの機能を強化し、市場での存在感を高めています。
| 市場範囲 | |
|---|---|
| 開始年 | 2024年 |
| 予測年 | 2025年~2034年 |
| 開始金額 | 23億米ドル |
| 予測金額 | 40億米ドル |
| CAGR | 5.5% |
酸素用極低温ポンプ分野は、2034年までのCAGRが5.5%と予測され、力強い成長が見込まれています。この需要の原動力となっているのは、特に都市部におけるヘルスケアニーズの高まりであり、人口の増加と健康への関心の高まりが液体酸素用極低温機器の使用に拍車をかけています。医療インフラの改善と信頼性の高い極低温システムへの資金提供を目的とした政府の取り組みが、市場のさらなる拡大を後押しすると予想されます。
米国の極低温ポンプ市場は、2034年までに6億米ドルを創出すると予測されています。この成長は、様々な産業におけるLNG用途の拡大と、LNGターミナルや貯蔵サービスなどのエネルギーインフラにおける資産の増加によって促進されます。さらに、ヘルスケア分野では、液体酸素や液体窒素を含む重要な用途で極低温ポンプに大きく依存しています。航空宇宙産業と宇宙開発産業も、極低温推進システムと関連技術への注目の高まりとともに、市場成長に貢献しています。
技術の進歩、多様な用途での採用の増加、産業およびヘルスケア開拓に対する政府の強力な支援により、極低温ポンプ市場は今後10年間で着実な成長を遂げると思われます。
目次
第1章 調査手法と調査範囲
- 市場範囲と定義
- 市場推計・予測パラメータ
- 予測計算
- データソース
- 一次
- 二次
- 有料
- 公的
第2章 エグゼクティブサマリー
第3章 業界洞察
- 業界エコシステム分析
- 規制状況
- 業界への影響要因
- 成長促進要因
- 業界の潜在的リスク・課題
- 成長ポテンシャル分析
- ポーター分析
- 供給企業の交渉力
- 買い手の交渉力
- 新規参入業者の脅威
- 代替品の脅威
- PESTEL分析
第4章 競合情勢
- イントロダクション
- 戦略的展望
- イノベーションと持続可能性の展望
第5章 市場規模・予測:製品別、2021年~2034年
- 主要動向
- 遠心式
- 往復動
- サブマージ
第6章 市場規模・予測:寒剤タイプ別、2021年~2034年
- 主要動向
- 窒素
- 酸素
- 天然ガス
- アルゴン
- その他の寒剤
第7章 市場規模・予測:最終用途別、2021年~2034年
- 主要動向
- 石油・ガス産業
- 電力
- 食品・飲料
- 化学
- ゴム・プラスチック
- 冶金
- ヘルスケア
- 海運業
- 農業、林業、漁業
- その他産業
第8章 市場規模・予測:地域別、2021年~2034年
- 主要動向
- 北米
- 米国
- カナダ
- 欧州
- 英国
- ドイツ
- イタリア
- フランス
- スペイン
- ロシア
- アジア太平洋
- 中国
- 日本
- 韓国
- インド
- オーストラリア
- 中東・アフリカ
- サウジアラビア
- アラブ首長国連邦
- トルコ
- 南アフリカ
- エジプト
- ラテンアメリカ
- ブラジル
- アルゼンチン
第9章 企業プロファイル
- Cryomec LLC
- Cryostar
- Ebara Corporation
- Fives
- Flowserve Corporation
- Huzhou Baihui Cryogenic Equipment Co., Ltd
- Indian Compressors Ltd
- Nikkiso Co., Ltd.
- PACKO Industry
- SHI Cryogenics Group
- SMS Pumps &Engineers
- Sumitomo Heavy Industries Ltd
- The Weir Group PLC
- Trillium Flow Technologies
- Vanzetti Engineering
The Global Cryogenic Pumps Market reached USD 2.3 billion in 2024 and is projected to grow at a CAGR of 5.5% between 2025 and 2034. This growth is driven by increasing foreign direct investments in emerging economies and the expansion of industrial infrastructure. Rising applications for cryogens, including hydrogen, LNG, and oxygen, in storage and transportation further fuel the demand for cryogenic pumps. Innovations in sustainable technologies and improved handling techniques are creating new avenues for business growth in the industry.
Centrifugal cryogenic pumps are expected to generate USD 2 billion by 2034, supported by their widespread adoption in industrial processes involving cryogens like nitrogen and argon. The growing utilization of LNG across sectors such as healthcare, food and beverages, and chemicals is contributing significantly to the market's expansion. Technological advancements, including superconducting magnetic bearings for higher efficiency and composite materials designed to withstand extreme temperatures and pressures, are enhancing the capabilities of centrifugal pumps, bolstering their market presence.
| Market Scope | |
|---|---|
| Start Year | 2024 |
| Forecast Year | 2025-2034 |
| Start Value | $2.3 Billion |
| Forecast Value | $4 Billion |
| CAGR | 5.5% |
The oxygen cryogenic pumps segment is poised for strong growth, with a projected CAGR of 5.5% through 2034. This demand is driven by increasing healthcare needs, particularly in urban centers, as population growth and rising health concerns spur the use of cryogenic equipment for liquid oxygen. Government initiatives aimed at improving medical infrastructure and funding reliable cryogenic systems are expected to support market expansion further.
U.S. cryogenic pumps market is forecasted to generate USD 600 million through 2034. This growth is fueled by expanding LNG applications across various industries and increasing assets in energy infrastructure, such as LNG terminals and storage services. Additionally, the healthcare sector heavily relies on cryogenic pumps for critical applications involving liquid oxygen and nitrogen. The aerospace and space exploration industries also contribute to market growth, with a rising focus on cryogenic propulsion systems and related technologies.
With advancements in technology, increasing adoption across diverse applications, and strong government support for industrial and healthcare developments, the cryogenic pumps market is set to achieve steady growth over the coming decade.
Table of Contents
Chapter 1 Methodology & Scope
- 1.1 Market scope & definitions
- 1.2 Market estimates & forecast parameters
- 1.3 Forecast calculation
- 1.4 Data sources
- 1.4.1 Primary
- 1.4.2 Secondary
- 1.4.2.1 Paid
- 1.4.2.2 Public
Chapter 2 Executive Summary
- 2.1 Industry synopsis, 2021 - 2034
Chapter 3 Industry Insights
- 3.1 Industry ecosystem analysis
- 3.2 Regulatory landscape
- 3.3 Industry impact forces
- 3.3.1 Growth drivers
- 3.3.2 Industry pitfalls & challenges
- 3.4 Growth potential analysis
- 3.5 Porter's analysis
- 3.5.1 Bargaining power of suppliers
- 3.5.2 Bargaining power of buyers
- 3.5.3 Threat of new entrants
- 3.5.4 Threat of substitutes
- 3.6 PESTEL analysis
Chapter 4 Competitive Landscape, 2024
- 4.1 Introduction
- 4.2 Strategic outlook
- 4.3 Innovation & sustainability landscape
Chapter 5 Market Size and Forecast, By Product, 2021 – 2034 (USD Million)
- 5.1 Key trends
- 5.2 Centrifugal
- 5.3 Reciprocating
- 5.4 Submerged
Chapter 6 Market Size and Forecast, By Cryogens Type, 2021 – 2034 (USD Million)
- 6.1 Key trends
- 6.2 Nitrogen
- 6.3 Oxygen
- 6.4 Natural gas
- 6.5 Argon
- 6.6 Other cryogens
Chapter 7 Market Size and Forecast, By End Use, 2021 – 2034 (USD Million)
- 7.1 Key trends
- 7.2 O&G industry
- 7.3 Power
- 7.4 Food & beverage
- 7.5 Chemical
- 7.6 Rubber & plastics
- 7.7 Metallurgy
- 7.8 Healthcare
- 7.9 Shipping
- 7.10 Agriculture, forestry & fishing
- 7.11 Other industries
Chapter 8 Market Size and Forecast, By Region, 2021 – 2034 (USD Million)
- 8.1 Key trends
- 8.2 North America
- 8.2.1 U.S.
- 8.2.2 Canada
- 8.3 Europe
- 8.3.1 UK
- 8.3.2 Germany
- 8.3.3 Italy
- 8.3.4 France
- 8.3.5 Spain
- 8.3.6 Russia
- 8.4 Asia Pacific
- 8.4.1 China
- 8.4.2 Japan
- 8.4.3 South Korea
- 8.4.4 India
- 8.4.5 Australia
- 8.5 Middle East & Africa
- 8.5.1 Saudi Arabia
- 8.5.2 UAE
- 8.5.3 Turkey
- 8.5.4 South Africa
- 8.5.5 Egypt
- 8.6 Latin America
- 8.6.1 Brazil
- 8.6.2 Argentina
Chapter 9 Company Profiles
- 9.1 Cryomec LLC
- 9.2 Cryostar
- 9.3 Ebara Corporation
- 9.4 Fives
- 9.5 Flowserve Corporation
- 9.6 Huzhou Baihui Cryogenic Equipment Co., Ltd
- 9.7 Indian Compressors Ltd
- 9.8 Nikkiso Co., Ltd.
- 9.9 PACKO Industry
- 9.10 SHI Cryogenics Group
- 9.11 SMS Pumps & Engineers
- 9.12 Sumitomo Heavy Industries Ltd
- 9.13 The Weir Group PLC
- 9.14 Trillium Flow Technologies
- 9.15 Vanzetti Engineering

