
|
市場調査レポート
商品コード
1667033
石油・ガス炭素回収・貯留市場の機会、成長促進要因、産業動向分析、2025年~2034年の予測Oil and Gas Carbon Capture and Storage Market Opportunity, Growth Drivers, Industry Trend Analysis, and Forecast 2025 - 2034 |
||||||
カスタマイズ可能
|
|||||||
| 石油・ガス炭素回収・貯留市場の機会、成長促進要因、産業動向分析、2025年~2034年の予測 |
|
出版日: 2024年12月18日
発行: Global Market Insights Inc.
ページ情報: 英文 110 Pages
納期: 2~3営業日
|

全表示
- 概要
- 目次
石油・ガス炭素回収・貯留の世界市場は2024年に39億米ドルに達し、2025年から2034年までのCAGRは14.5%になると予測されています。
この急成長は、環境規制の強化や世界のカーボンニュートラル目標の達成に向けた取り組みの活発化が大きな要因となっています。炭素回収技術は、特に石油・ガスセクターにおいて、CO2排出を緩和するために不可欠なものとなりつつあります。気候変動に対する懸念が強まるにつれ、より多くの政府や組織が、こうした目標を達成するための持続可能な技術の開発と導入を優先しています。CCSは、特に石油・ガスのような排出量の多い産業において、二酸化炭素排出量を削減する効果的な手段を提供します。
今後10年間で、この市場は飛躍的に成長すると予想され、2034年までに150億米ドルを生み出すと予測されています。エネルギー需要の増大とともに、二酸化炭素排出量削減への関心が高まっていることが、CCS技術採用の原動力になると予想されます。石油・ガス産業における上流事業や、持続可能な発電に対するニーズの高まりが、市場の将来形成に大きな役割を果たすと予想されます。これらの産業はCO2排出の最大要因のひとつであるため、CCSソリューションの統合がより重要になります。二酸化炭素の回収と貯留は、石油・ガスの採掘と生産プロセスの中心的存在になりつつあり、CO2を大量に排出する大規模な探査活動を伴うことが多いです。酸素燃焼、予備燃焼、後燃焼を含む最も一般的なCCS技術は、天然ガス処理プラント、製油所、石油増進回収(EOR)事業からのCO2回収に採用されています。
| 市場範囲 | |
|---|---|
| 開始年 | 2024 |
| 予測年 | 2025-2034 |
| 開始金額 | 39億米ドル |
| 予測金額 | 151億米ドル |
| CAGR | 14.5% |
これらのCCS技術の中で、燃焼後技術が最も高い成長を見せ、2034年までのCAGRは18%と予測されます。ポストコンバッションは、化石燃料の燃焼時に発生する排ガスからCO2を回収するもので、発電、精製、石油化学産業の主要な製品別です。この技術は、石油・ガスに対する世界の需要が増加し続ける中、排出量削減の取り組みにおいて急速に重要な役割を果たすようになってきています。ポストコンバッション技術は、既存の操業を中断することなく持続可能性の目標を達成するための、産業界にとって実用的な解決策を提供します。
米国では、排出規制の強化と持続可能な技術への投資の増加により、石油・ガス炭素回収・貯留市場は2034年までに30億米ドルに達すると予測されています。石油増進回収法(EOR)と天然ガス処理に大きな焦点が当てられており、そこでは排出削減と生産向上の両方を実現するCCSソリューションが広く採用されています。さらに、官民の協力により大規模なCCSプロジェクトの開発が加速しており、米国は炭素回収業界の世界的リーダーとしての地位を固めています。こうした取り組みは、世界規模での排出削減において重要な役割を果たすと同時に、この分野での継続的な成長と技術革新を促進すると期待されています。
目次
第1章 調査手法と調査範囲
- 市場範囲と定義
- 市場推計・予測パラメータ
- 予測計算
- データソース
- 1次データ
- 2次データ
- 有料
- 公的
第2章 エグゼクティブサマリー
第3章 業界洞察
- エコシステム分析
- 規制状況
- 業界への影響要因
- 促進要因
- 業界の潜在的リスク&課題
- 成長可能性分析
- ポーターの分析
- 供給企業の交渉力
- 買い手の交渉力
- 新規参入業者の脅威
- 代替品の脅威
- PESTEL分析
第4章 競合情勢
- イントロダクション
- 戦略的展望
- イノベーションと持続可能性の展望
第5章 市場規模・予測:技術別、2021年~2034年
- 主要動向
- 予備燃焼
- ポスト燃焼
- 酸素燃焼
第6章 市場規模・予測:地域別、2021年~2034年
- 主要動向
- 北米
- 米国
- カナダ
- 欧州
- 英国
- ドイツ
- デンマーク
- アジア太平洋
- 中国
- オーストラリア
- 韓国
- 世界のその他の地域
第7章 企業プロファイル
- Air Products
- Aker Solutions
- Chevron
- Dakota Gasification Company
- Equinor
- Exxon Mobil
- Fluor
- General Electric
- Halliburton
- Linde
- Mitsubishi Heavy Industries
- NRG Energy
- Shell Cansolv
- Siemens
- SLB
- Sulzer
- TotalEnergies
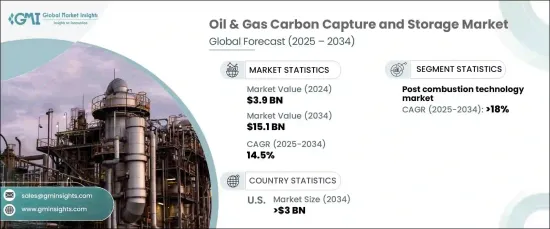
The Global Oil And Gas Carbon Capture And Storage Market reached USD 3.9 billion in 2024 and is projected to experience a CAGR of 14.5% from 2025 to 2034. This surge is largely driven by tightening environmental regulations and the increasing commitment to achieving global carbon neutrality goals. Carbon capture technology is becoming an indispensable part of mitigating CO2 emissions, especially in the oil and gas sector, one of the largest contributors to greenhouse gas emissions worldwide. As concerns about climate change intensify, more governments and organizations are prioritizing the development and implementation of sustainable technologies to meet these goals. CCS offers an effective means of reducing carbon footprints, particularly in industries with high emissions like oil and gas.
Over the next decade, the market is expected to grow exponentially, with projections estimating that it will generate USD 15 billion by 2034. The increased focus on reducing carbon emissions, along with the growing demand for energy, is expected to be a driving force for the adoption of CCS technologies. Upstream operations in the oil and gas industry, as well as the rising need for sustainable power generation, are expected to play a major role in shaping the market's future. These industries are among the largest contributors to CO2 emissions, making the integration of CCS solutions even more critical. The capture and storage of carbon dioxide are becoming central to oil and gas extraction and production processes, which often involve large-scale exploration activities that generate significant CO2 emissions. The most common CCS technologies, including oxy-fuel combustion, pre-combustion, and post-combustion, are being adopted to capture CO2 from natural gas processing plants, refineries, and enhanced oil recovery (EOR) operations.
| Market Scope | |
|---|---|
| Start Year | 2024 |
| Forecast Year | 2025-2034 |
| Start Value | $3.9 Billion |
| Forecast Value | $15.1 Billion |
| CAGR | 14.5% |
Among these CCS technologies, post-combustion is projected to see the highest growth, with an expected CAGR of 18% through 2034. Post-combustion captures CO2 from flue gases produced during the combustion of fossil fuels, a major byproduct of power generation, refining, and petrochemical industries. This technology is quickly becoming a key player in efforts to reduce emissions as global demand for oil and gas continues to rise. Post-combustion technology offers a practical solution for industries to meet sustainability goals without disrupting existing operations.
In the U.S., the oil and gas carbon capture and storage market is projected to reach USD 3 billion by 2034, driven by stricter emissions regulations and increased investments in sustainable technologies. Significant focus is being placed on enhanced oil recovery (EOR) and natural gas processing, where CCS solutions are being widely adopted to both reduce emissions and enhance production. Moreover, the collaboration between public and private sectors is accelerating the development of large-scale CCS projects, solidifying the U.S. position as a global leader in the carbon capture industry. These initiatives are expected to play a key role in reducing emissions on a global scale while also driving continued growth and innovation within the sector.
Table of Contents
Chapter 1 Methodology & Scope
- 1.1 Market scope & definitions
- 1.2 Market estimates & forecast parameters
- 1.3 Forecast calculation
- 1.4 Data sources
- 1.4.1 Primary
- 1.4.2 Secondary
- 1.4.2.1 Paid
- 1.4.2.2 Public
Chapter 2 Executive Summary
- 2.1 Industry synopsis, 2021 - 2034
Chapter 3 Industry Insights
- 3.1 Industry ecosystem analysis
- 3.2 Regulatory landscape
- 3.3 Industry impact forces
- 3.3.1 Growth drivers
- 3.3.2 Industry pitfalls & challenges
- 3.4 Growth potential analysis
- 3.5 Porter's analysis
- 3.5.1 Bargaining power of suppliers
- 3.5.2 Bargaining power of buyers
- 3.5.3 Threat of new entrants
- 3.5.4 Threat of substitutes
- 3.6 PESTEL analysis
Chapter 4 Competitive Landscape, 2024
- 4.1 Introduction
- 4.2 Strategic outlook
- 4.3 Innovation & sustainability landscape
Chapter 5 Market Size and Forecast, By Technology, 2021 – 2034 (MTPA, USD Billion)
- 5.1 Key trends
- 5.2 Pre combustion
- 5.3 Post combustion
- 5.4 Oxy-Fuel combustion
Chapter 6 Market Size and Forecast, By Region, 2021 – 2034 (MTPA, USD Billion)
- 6.1 Key trends
- 6.2 North America
- 6.2.1 U.S.
- 6.2.2 Canada
- 6.3 Europe
- 6.3.1 UK
- 6.3.2 Germany
- 6.3.3 Denmark
- 6.4 Asia Pacific
- 6.4.1 China
- 6.4.2 Australia
- 6.4.3 South Korea
- 6.5 Rest of World
Chapter 7 Company Profiles
- 7.1 Air Products
- 7.2 Aker Solutions
- 7.3 Chevron
- 7.4 Dakota Gasification Company
- 7.5 Equinor
- 7.6 Exxon Mobil
- 7.7 Fluor
- 7.8 General Electric
- 7.9 Halliburton
- 7.10 Linde
- 7.11 Mitsubishi Heavy Industries
- 7.12 NRG Energy
- 7.13 Shell Cansolv
- 7.14 Siemens
- 7.15 SLB
- 7.16 Sulzer
- 7.17 TotalEnergies
