|
|
市場調査レポート
商品コード
1289000
バイオPMMAの市場規模、タイプ別、製品別、用途別、業界分析レポート、地域展望、用途成長ポテンシャル、価格動向、競合情勢&予測、2023年~2032年Bio-based PMMA Market Size, By Type, By Product, By Application, Industry Analysis Report, Regional Outlook, Application Growth Potential, Price Trends, Competitive Landscape & Forecast, 2023 - 2032 |
||||||
|
|
|||||||
|
● お客様のご希望に応じて、既存データの加工や未掲載情報(例:国別セグメント)の追加などの対応が可能です。 詳細はお問い合わせください。 |
|||||||


| バイオPMMAの市場規模、タイプ別、製品別、用途別、業界分析レポート、地域展望、用途成長ポテンシャル、価格動向、競合情勢&予測、2023年~2032年 |
|
出版日: 2023年03月02日
発行: Global Market Insights Inc.
ページ情報: 英文 250 Pages
納期: 2~3営業日
|
- 全表示
- 概要
- 図表
- 目次
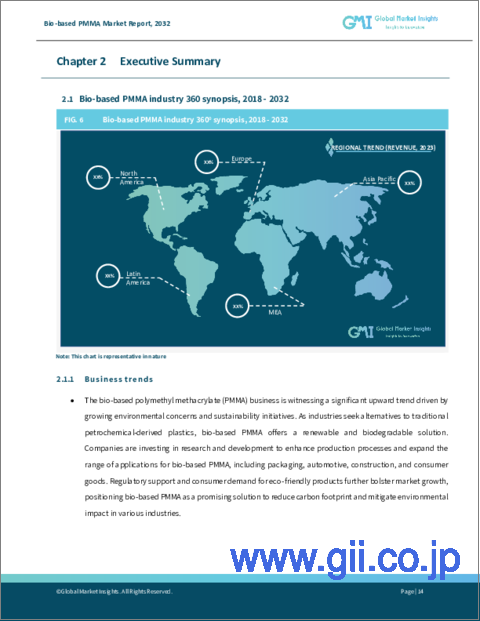
バイオPMMAの世界市場は、複数の産業における持続可能な材料への需要の高まりにより、2023年から2032年にかけて大きく成長する見通しです。
従来のPMMAは石油由来の原料を使用していますが、バイオPMMAは植物由来の原料やバイオベースのモノマーなどの再生可能な原料を使用して生産されています。このバイオPMMAへのシフトは、カーボンフットプリントの削減と環境に優しいソリューションの推進という世界の動向に合致しており、市場成長の主要な要因の一つとなっています。
プラスチックが環境に与える影響に対する認識や懸念が高まっていることも、バイオPMMA業界に十分な成長機会をもたらす要因となっています。バイオPMMAは、化石燃料への依存を減らし、温室効果ガスの排出を最小限に抑え、プラスチック廃棄物を軽減することで、持続可能なソリューションを提供します。バイオPMMAをさまざまな用途で急速に採用することで、製品の性能と品質を維持しながら持続可能な目標を達成することができます。また、自動車、エレクトロニクス、建築の各分野で製品の使用量が増加しており、2032年までの市場収益を押し上げると考えられます。
バイオPMMA市場は、製品タイプ、製品、用途、地域によって分類されます。
製品カテゴリーでは、射出成形、コーティング・接着剤、ファイバー、フィラメントなど、その他分野の市場シェアが2032年まで大きな収益を牽引すると考えられます。バイオPMMA射出成形品は、自動車部品、電気・電子機器筐体、消費財、各種工業部品などの製造に幅広く使用されています。これらの製品は、高い耐衝撃性、寸法安定性、良好な表面仕上げを備えています。また、バイオPMMAファイバーやフィラメントは、吸湿性、軽量性、耐久性などの特性を持つため、繊維・アパレル産業での採用が増加しており、この分野の成長を促進するものと考えられます。
タイプ別に見ると、耐熱性PMMAの市場規模は2023年から2032年にかけて約16%のCAGRで成長すると予測されます。耐熱性PMMAは、熱や極端な気象条件に対して優れた耐性を示し、優れた透明性を保持することができます。標準的なPMMAと比較すると、10℃以上の熱に耐えることができ、最終的には製品の硬度を高めることができます。このような特性から、光源から発生する熱によって耐熱性が要求される自動車用ランプレンズなどに広く使用されています。
用途別では、自動車用途が今後10年間で顕著に増加すると予想されています。燃費の向上と二酸化炭素排出量の抑制のため、自動車生産に軽量素材を使用することに対する意識の高まりが、自動車用途におけるバイオPMMAの需要を促進します。米国などでは、2025年までに燃費を向上させるという厳しい規制があり、2032年まで事業の成長をさらに加速させるでしょう。
地域別では、ラテンアメリカのバイオPMMA市場は、2032年までに1,650万米ドル規模になると予想されています。持続可能性への関心の高まりと環境意識の高まりが、同地域におけるバイオPMMAの普及を後押しする主要因の一つです。また、建設、自動車、エレクトロニクス、パッケージングなどの産業において、環境に優しい代替品の利用が重視されるようになったことも、ラテンアメリカでの製品需要を刺激するでしょう。
目次
第1章 調査手法とスコープ
第2章 エグゼクティブサマリー
第3章 バイオPMMA産業洞察
- イントロダクション
- COVID-19が業界情勢に与える影響
- エコシステム分析
- 利益率
- 付加価値
- 流通チャネル分析
- ベンダーマトリックス
- 主な原材料サプライヤーリスト
- 主要メーカー/ディストリビューター一覧
- 原材料の動向
- イノベーションとサステナビリティ
- 特許分析
- 生産プロセス
- 今後の動向
- 業界への影響要因
- 促進要因
- 業界の潜在的リスク&課題
- 法規制動向
- 成長ポテンシャル分析、2022年
- 地域別価格動向
- コスト構造分析
- 研究開発コスト
- 製造・設備コスト
- 原材料費
- 物流コスト
- 営業コスト
- その他コスト
- コスト構造分析
- ポーター分析
- PESTEL分析
- COVID-19がバイオPMMA市場に与える影響:用途別
- 看板・ディスプレイ
- 自動車
- エレクトロニクス
- 建築
- ヘルスケア
第4章 競合情勢、2021年
- イントロダクション
- 企業シェア分析、地域別
- 主要市場プレイヤーの競合分析
- 競合のポジショニングマトリックス
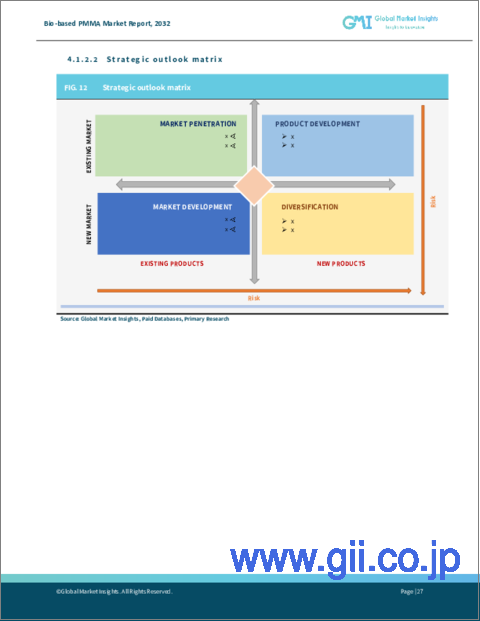
- 戦略的展望マトリックス
第5章 バイオPMMA市場:タイプ別
- バイオPMMA市場の材料シェア、タイプ別、2022年・2032年
- 一般PMMA
- 耐熱PMMA
- 耐衝撃PMMA
第6章 バイオPMMA市場:製品別
- バイオPMMA市場の材料シェア:製品別、2022年・2032年
- 押出しシート
- ペレット
- ビーズ
- その他
第7章 バイオPMMA市場:用途別
- バイオPMMA市場の材料シェア:用途別、2022年・2032年
- エレクトロニクス
- 自動車
- 消費財
- ヘルスケア
- 建築
- 看板・ディスプレイ
- その他
第8章 バイオPMMA市場:地域別
- バイオPMMA市場の地域別シェア(2022年・2032年)
- 北米
- 米国
- カナダ
- 欧州
- ドイツ
- 英国
- フランス
- イタリア
- スペイン
- ロシア
- アジア太平洋地域
- 中国
- インド
- 日本
- オーストラリア
- 韓国
- インドネシア
- ラテンアメリカ
- ブラジル
- メキシコ
- 中東・アフリカ
- サウジアラビア
- UAE
- 南アフリカ共和国
第9章 企業プロファイル
- Evonik Industries
- Arkema SA
- Mitsubishi Rayon Corp
- Altuglas International Sas
- Kuraray Group
- Asahi Kesei Corp
- Sumitomo Chemical Co., Ltd
- Sabic
- Makevale Group
- RTP Company
Data Tables
- TABLE 1 Bio-based PMMA industry 360° synopsis, 2018 - 2032
- TABLE 2 Global Bio-based PMMA market estimates and forecasts, 2018 - 2022, (Kilo Tons) (USD Million)
- TABLE 3 Global Bio-based PMMA market estimates and forecasts, 2023 - 2032, (Kilo Tons) (USD Million)
- TABLE 4 Global Bio-based PMMA market volume estimates and forecasts, by region, 2018-2022 (Kilo Tons)
- TABLE 5 Global Bio-based PMMA market volume estimates and forecasts, by region, 2023-2032 (Kilo Tons)
- TABLE 6 Global Bio-based PMMA market revenue estimates and forecasts, by region, 2018 - 2022 (USD Million)
- TABLE 7 Global Bio-based PMMA market revenue estimates and forecasts, by region, 2023 - 2032 (USD Million)
- TABLE 8 Global Bio-based PMMA market volume estimates and forecasts, by type, 2018 - 2022 (Kilo Tons)
- TABLE 9 Global Bio-based PMMA market volume estimates and forecasts, by type, 2023 - 2032 (Kilo Tons)
- TABLE 10 Global Bio-based PMMA market volume estimates and forecasts, by type, 2018 - 2022 (USD Million)
- TABLE 11 Global Bio-based PMMA market volume estimates and forecasts, by type, 2023 - 2032 (USD Million)
- TABLE 12 Global Bio-based PMMA market volume estimates and forecasts, by product, 2018 - 2022 (Kilo Tons)
- TABLE 13 Global Bio-based PMMA market volume estimates and forecasts, by product, 2023 - 2032 (Kilo Tons)
- TABLE 14 Global Bio-based PMMA market revenue estimates and forecasts, by product, 2018 - 2022 (USD Million)
- TABLE 15 Global Bio-based PMMA market revenue estimates and forecasts, by product, 2023 - 2032 (USD Million)
- TABLE 16 Global Bio-based PMMA market volume estimates and forecasts, by application, 2018 - 2022, (Kilo Tons)
- TABLE 17 Global Bio-based PMMA market volume estimates and forecasts, by application, 2023 - 2032, (Kilo Tons)
- TABLE 18 Global Bio-based PMMA market revenue estimates and forecasts, by application, 2018 - 2022 (USD Million)
- TABLE 19 Global Bio-based PMMA market revenue estimates and forecasts, by application, 2023 - 2032 (USD Million)
- TABLE 20 Vendor matrix
- TABLE 21 Bio-based PMMA distribution channel analysis
- TABLE 22 Industry impact forces
- TABLE 23 Asia Pacific automotive production in 2022
- TABLE 24 Global general PMMA market estimates and forecasts, 2018 - 2022 (Kilo Tons) (USD Million)
- TABLE 25 Global general PMMA market estimates and forecasts, 2023 - 2032 (Kilo Tons) (USD Million)
- TABLE 26 Global general PMMA market volume, by region, 2018 - 2022, (Kilo Tons)
- TABLE 27 Global general PMMA market volume, by region, 2023 - 2032, (Kilo Tons)
- TABLE 28 Global general PMMA market revenue, by region, 2018 - 2022, (USD Million)
- TABLE 29 Global general PMMA market revenue, by region, 2023 - 2032, (USD Million)
- TABLE 30 Global heat resistant PMMA market estimates and forecasts, 2018 - 2022 (Kilo Tons) (USD Million)
- TABLE 31 Global heat resistant PMMA market estimates and forecasts, 2023 - 2032 (Kilo Tons) (USD Million)
- TABLE 32 Global heat resistant PMMA market volume, by region, 2018 - 2022, (Kilo Tons)
- TABLE 33 Global heat resistant PMMA market volume, by region, 2023 - 2032, (Kilo Tons)
- TABLE 34 Global heat resistant PMMA market revenue, by region, 2018 - 2022, (USD Million)
- TABLE 35 Global heat resistant PMMA market revenue, by region, 2023 - 2032, (USD Million)
- TABLE 36 Global impact resistant PMMA market estimates and forecasts, 2018 - 2022 (Kilo Tons) (USD Million)
- TABLE 37 Global impact resistant PMMA market estimates and forecasts, 2023 - 2032 (Kilo Tons) (USD Million)
- TABLE 38 Global impact resistant PMMA market volume, by region, 2018 - 2022, (Kilo Tons)
- TABLE 39 Global impact resistant PMMA market volume, by region, 2023 - 2032, (Kilo Tons)
- TABLE 40 Global impact resistant PMMA market revenue, by region, 2018 - 2022, (USD Million)
- TABLE 41 Global impact resistant PMMA market revenue, by region, 2023 - 2032, (USD Million)
- TABLE 42 Global extruded sheets market estimates and forecasts, 2018 - 2022 (Kilo Tons) (USD Million)
- TABLE 43 Global extruded sheets market estimates and forecasts, 2023 - 2032 (Kilo Tons) (USD Million)
- TABLE 44 Global extruded sheets market volume, by region, 2018 - 2022, (Kilo Tons)
- TABLE 45 Global extruded sheets market volume, by region, 2023 - 2032, (Kilo Tons)
- TABLE 46 Global extruded sheets market revenue, by region, 2018 - 2022, (USD Million)
- TABLE 47 Global extruded sheets market revenue, by region, 2023 - 2032, (USD Million)
- TABLE 48 Global cell cast sheets & blocks market estimates and forecasts, 2018 - 2022 (Kilo Tons) (USD Million)
- TABLE 49 Global cell cast sheets & blocks market estimates and forecasts, 2023 - 2032 (Kilo Tons) (USD Million)
- TABLE 50 Global cell cast sheets & blocks market volume, by region, 2018 - 2022, (Kilo Tons)
- TABLE 51 Global cell cast sheets & blocks market volume, by region, 2023 - 2032, (Kilo Tons)
- TABLE 52 Global cell cast sheets & blocks market revenue, by region, 2018 - 2022, (USD Million)
- TABLE 53 Global cell cast sheets & blocks market revenue, by region, 2023 - 2032, (USD Million)
- TABLE 54 Global pellets market estimates and forecasts, 2018 - 2022 (Kilo Tons) (USD Million)
- TABLE 55 Global pellets market estimates and forecasts, 2023 - 2032 (Kilo Tons) (USD Million)
- TABLE 56 Global pellets market volume, by region, 2018 - 2022, (Kilo Tons)
- TABLE 57 Global pellets market volume, by region, 2023 - 2032, (Kilo Tons)
- TABLE 58 Global pellets market revenue, by region, 2018 - 2022, (USD Million)
- TABLE 59 Global pellets market revenue, by region, 2023 - 2032, (USD Million)
- TABLE 60 Global others market estimates and forecasts, 2018 - 2022 (Kilo Tons) (USD Million)
- TABLE 61 Global others market estimates and forecasts, 2023 - 2032 (Kilo Tons) (USD Million)
- TABLE 62 Global others market volume, by region, 2018 - 2022, (Kilo Tons)
- TABLE 63 Global others market volume, by region, 2023 - 2032, (Kilo Tons)
- TABLE 64 Global others market revenue, by region, 2018 - 2022, (USD Million)
- TABLE 65 Global others market revenue, by region, 2023 - 2032, (USD Million)
- TABLE 66 Global Bio-based PMMA market from construction, 2018-2022, (Kilo Tons) (USD Million)
- TABLE 67 Global Bio-based PMMA market from construction, 2023-2032, (Kilo Tons) (USD Million)
- TABLE 68 Global Bio-based PMMA market volume from construction, by region, 2018-2022, (Kilo Tons)
- TABLE 69 Global Bio-based PMMA market volume from construction, by region, 2023-2032, (Kilo Tons)
- TABLE 70 Global Bio-based PMMA market revenue from construction, by region, 2018-2022, (USD Million)
- TABLE 71 Global Bio-based PMMA market revenue from construction, by region, 2023-2032, (USD Million)
- TABLE 72 Global Bio-based PMMA market from electronics, 2018-2022, (Kilo Tons) (USD Million)
- TABLE 73 Global Bio-based PMMA market from electronics, 2023-2032, (Kilo Tons) (USD Million)
- TABLE 74 Global Bio-based PMMA market volume from electronics, by region, 2018-2022, (Kilo Tons)
- TABLE 75 Global Bio-based PMMA market volume from electronics, by region, 2023-2032, (Kilo Tons)
- TABLE 76 Global Bio-based PMMA market revenue from electronics, by region, 2018-2022, (USD Million)
- TABLE 77 Global Bio-based PMMA market revenue from electronics, by region, 2023-2032, (USD Million)
- TABLE 78 Global Bio-based PMMA market from automotive, 2018-2022, (Kilo Tons) (USD Million)
- TABLE 79 Global Bio-based PMMA market from automotive, 2023-2032, (Kilo Tons) (USD Million)
- TABLE 80 Global Bio-based PMMA market volume from automotive, by region, 2018-2022, (Kilo Tons)
- TABLE 81 Global Bio-based PMMA market volume from automotive, by region, 2023-2032, (Kilo Tons)
- TABLE 82 Global Bio-based PMMA market revenue from automotive, by region, 2018-2022, (USD Million)
- TABLE 83 Global Bio-based PMMA market revenue from automotive, by region, 2023-2032, (USD Million)
- TABLE 84 Global Bio-based PMMA market from signs & displays, 2018-2022, (Kilo Tons) (USD Million)
- TABLE 85 Global Bio-based PMMA market from signs & displays, 2023-2032, (Kilo Tons) (USD Million)
- TABLE 86 Global Bio-based PMMA market volume from signs & displays, by region, 2018-2022, (Kilo Tons)
- TABLE 87 Global Bio-based PMMA market volume from signs & displays, by region, 2023-2032, (Kilo Tons)
- TABLE 88 Global Bio-based PMMA market revenue from signs & displays, by region, 2018-2022, (USD Million)
- TABLE 89 Global Bio-based PMMA market revenue from signs & displays, by region, 2023-2032, (USD Million)
- TABLE 90 Global Bio-based PMMA market from healthcare, 2018-2022, (Kilo Tons) (USD Million)
- TABLE 91 Global Bio-based PMMA market from healthcare, 2023-2032, (Kilo Tons) (USD Million)
- TABLE 92 Global Bio-based PMMA market volume from healthcare, by region, 2018-2022, (Kilo Tons)
- TABLE 93 Global Bio-based PMMA market volume from healthcare, by region, 2023-2032, (Kilo Tons)
- TABLE 94 Global Bio-based PMMA market revenue from healthcare, by region, 2018-2022, (USD Million)
- TABLE 95 Global Bio-based PMMA market revenue from healthcare, by region, 2023-2032, (USD Million)
- TABLE 96 Global Bio-based PMMA market from consumer goods, 2018-2022, (Kilo Tons) (USD Million)
- TABLE 97 Global Bio-based PMMA market from consumer goods, 2023-2032, (Kilo Tons) (USD Million)
- TABLE 98 Global Bio-based PMMA market volume from consumer goods, by region, 2018-2022, (Kilo Tons)
- TABLE 99 Global Bio-based PMMA market volume from consumer goods, by region, 2023-2032, (Kilo Tons)
- TABLE 100 Global Bio-based PMMA market revenue from consumer goods, by region, 2018-2022, (USD Million)
- TABLE 101 Global Bio-based PMMA market revenue from consumer goods, by region, 2023-2032, (USD Million)
- TABLE 102 Global Bio-based PMMA market from others, 2018-2022, (Kilo Tons) (USD Million)
- TABLE 103 Global Bio-based PMMA market from others, 2023-2032, (Kilo Tons) (USD Million)
- TABLE 104 Global Bio-based PMMA market volume from others, by region, 2018-2022, (Kilo Tons)
- TABLE 105 Global Bio-based PMMA market volume from others, by region, 2023-2032, (Kilo Tons)
- TABLE 106 Global Bio-based PMMA market revenue from others, by region, 2018-2022, (USD Million)
- TABLE 107 Global Bio-based PMMA market revenue from others, by region, 2023-2032, (USD Million)
- TABLE 108 North America Bio-based PMMA market, 2018-2022, (Kilo Tons) (USD Million)
- TABLE 109 North America Bio-based PMMA market, 2023-2032, (Kilo Tons) (USD Million)
- TABLE 110 North America Bio-based PMMA market volume, by type, 2018 - 2022, (Kilo Tons)
- TABLE 111 North America Bio-based PMMA market volume, by type, 2023 - 2032, (Kilo Tons)
- TABLE 112 North America Bio-based PMMA market revenue, by type, 2018 - 2022, (USD Million)
- TABLE 113 North America Bio-based PMMA market revenue, by type, 2023 - 2032, (USD Million)
- TABLE 114 North America Bio-based PMMA market volume, by product, 2018 - 2022, (Kilo Tons)
- TABLE 115 North America Bio-based PMMA market volume, by product, 2023 - 2032, (Kilo Tons)
- TABLE 116 North America Bio-based PMMA market revenue, by product, 2018 - 2022, (USD Million)
- TABLE 117 North America Bio-based PMMA market revenue, by product, 2023 - 2032, (USD Million)
- TABLE 118 North America Bio-based PMMA market volume, by application, 2018 - 2022, (Kilo Tons)
- TABLE 119 North America Bio-based PMMA market volume, by application, 2023 - 2032, (Kilo Tons)
- TABLE 120 North America Bio-based PMMA market revenue, by application, 2018 - 2022, (USD Million)
- TABLE 121 North America BIO-BASED PMMA market revenue, by application, 2023 - 2032, (USD Million)
- TABLE 122 U.S. Bio-based PMMA market, 2018-2022, (Kilo Tons) (USD Million)
- TABLE 123 U.S. Bio-based PMMA market, 2023-2032, (Kilo Tons) (USD Million)
- TABLE 124 U.S. Bio-based PMMA market volume, by type, 2018 - 2022, (Kilo Tons)
- TABLE 125 U.S. Bio-based PMMA market volume, by type, 2023 - 2032, (Kilo Tons)
- TABLE 126 U.S. Bio-based PMMA market revenue, by type, 2018 - 2022, (USD Million)
- TABLE 127 U.S. Bio-based PMMA market revenue, by type, 2023 - 2032, (USD Million)
- TABLE 128 U.S. Bio-based PMMA market volume, by product, 2018 - 2022, (Kilo Tons)
- TABLE 129 U.S. Bio-based PMMA market volume, by product, 2023 - 2032, (Kilo Tons)
- TABLE 130 U.S. Bio-based PMMA market revenue, by product, 2018 - 2022, (USD Million)
- TABLE 131 U.S. Bio-based PMMA market revenue, by product, 2023 - 2032, (USD Million)
- TABLE 132 U.S. Bio-based PMMA market volume, by application, 2018 - 2022, (Kilo Tons)
- TABLE 133 U.S. Bio-based PMMA market volume, by application, 2023 - 2032, (Kilo Tons)
- TABLE 134 U.S. Bio-based PMMA market revenue, by application, 2018 - 2022, (USD Million)
- TABLE 135 U.S. BIO-BASED PMMA market revenue, by application, 2023 - 2032, (USD Million)
- TABLE 136 Canada Bio-based PMMA market, 2018-2022, (Kilo Tons) (USD Million)
- TABLE 137 Canada Bio-based PMMA market, 2023-2032, (Kilo Tons) (USD Million)
- TABLE 138 Canada Bio-based PMMA market volume, by type, 2018 - 2022, (Kilo Tons)
- TABLE 139 Canada Bio-based PMMA market volume, by type, 2023 - 2032, (Kilo Tons)
- TABLE 140 Canada Bio-based PMMA market revenue, by type, 2018 - 2022, (USD Million)
- TABLE 141 Canada Bio-based PMMA market revenue, by type, 2023 - 2032, (USD Million)
- TABLE 142 Canada Bio-based PMMA market volume, by product, 2018 - 2022, (Kilo Tons)
- TABLE 143 Canada Bio-based PMMA market volume, by product, 2023 - 2032, (Kilo Tons)
- TABLE 144 Canada Bio-based PMMA market revenue, by product, 2018 - 2022, (USD Million)
- TABLE 145 Canada Bio-based PMMA market revenue, by product, 2023 - 2032, (USD Million)
- TABLE 146 Canada Bio-based PMMA market volume, by application, 2018 - 2022, (Kilo Tons)
- TABLE 147 Canada Bio-based PMMA market volume, by application, 2023 - 2032, (Kilo Tons)
- TABLE 148 Canada Bio-based PMMA market revenue, by application, 2018 - 2022, (USD Million)
- TABLE 149 Canada BIO-BASED PMMA market revenue, by application, 2023 - 2032, (USD Million)
- TABLE 150 Europe Bio-based PMMA market, 2018-2022, (Kilo Tons) (USD Million)
- TABLE 151 Europe Bio-based PMMA market, 2023-2032, (Kilo Tons) (USD Million)
- TABLE 152 Europe Bio-based PMMA market volume, by type, 2018 - 2022, (Kilo Tons)
- TABLE 153 Europe Bio-based PMMA market volume, by type, 2023 - 2032, (Kilo Tons)
- TABLE 154 Europe Bio-based PMMA market revenue, by type, 2018 - 2022, (USD Million)
- TABLE 155 Europe Bio-based PMMA market revenue, by type, 2023 - 2032, (USD Million)
- TABLE 156 Europe Bio-based PMMA market volume, by product, 2018 - 2022, (Kilo Tons)
- TABLE 157 Europe Bio-based PMMA market volume, by product, 2023 - 2032, (Kilo Tons)
- TABLE 158 Europe Bio-based PMMA market revenue, by product, 2018 - 2022, (USD Million)
- TABLE 159 Europe Bio-based PMMA market revenue, by product, 2023 - 2032, (USD Million)
- TABLE 160 Europe Bio-based PMMA market volume, by application, 2018 - 2022, (Kilo Tons)
- TABLE 161 Europe Bio-based PMMA market volume, by application, 2023 - 2032, (Kilo Tons)
- TABLE 162 Europe Bio-based PMMA market revenue, by application, 2018 - 2022, (USD Million)
- TABLE 163 Europe BIO-BASED PMMA market revenue, by application, 2023 - 2032, (USD Million)
- TABLE 164 Germany Bio-based PMMA market, 2018-2022, (Kilo Tons) (USD Million)
- TABLE 165 Germany Bio-based PMMA market, 2023-2032, (Kilo Tons) (USD Million)
- TABLE 166 Germany Bio-based PMMA market volume, by type, 2018 - 2022, (Kilo Tons)
- TABLE 167 Germany Bio-based PMMA market volume, by type, 2023 - 2032, (Kilo Tons)
- TABLE 168 Germany Bio-based PMMA market revenue, by type, 2018 - 2022, (USD Million)
- TABLE 169 Germany Bio-based PMMA market revenue, by type, 2023 - 2032, (USD Million)
- TABLE 170 Germany Bio-based PMMA market volume, by product, 2018 - 2022, (Kilo Tons)
- TABLE 171 Germany Bio-based PMMA market volume, by product, 2023 - 2032, (Kilo Tons)
- TABLE 172 Germany Bio-based PMMA market revenue, by product, 2018 - 2022, (USD Million)
- TABLE 173 Germany Bio-based PMMA market revenue, by product, 2023 - 2032, (USD Million)
- TABLE 174 Germany Bio-based PMMA market volume, by application, 2018 - 2022, (Kilo Tons)
- TABLE 175 Germany Bio-based PMMA market volume, by application, 2023 - 2032, (Kilo Tons)
- TABLE 176 Germany Bio-based PMMA market revenue, by application, 2018 - 2022, (USD Million)
- TABLE 177 Germany BIO-BASED PMMA market revenue, by application, 2023 - 2032, (USD Million)
- TABLE 178 France Bio-based PMMA market, 2018-2022, (Kilo Tons) (USD Million)
- TABLE 179 France Bio-based PMMA market, 2023-2032, (Kilo Tons) (USD Million)
- TABLE 180 France Bio-based PMMA market volume, by type, 2018 - 2022, (Kilo Tons)
- TABLE 181 France Bio-based PMMA market volume, by type, 2023 - 2032, (Kilo Tons)
- TABLE 182 France Bio-based PMMA market revenue, by type, 2018 - 2022, (USD Million)
- TABLE 183 France Bio-based PMMA market revenue, by type, 2023 - 2032, (USD Million)
- TABLE 184 France Bio-based PMMA market volume, by product, 2018 - 2022, (Kilo Tons)
- TABLE 185 France Bio-based PMMA market volume, by product, 2023 - 2032, (Kilo Tons)
- TABLE 186 France Bio-based PMMA market revenue, by product, 2018 - 2022, (USD Million)
- TABLE 187 France Bio-based PMMA market revenue, by product, 2023 - 2032, (USD Million)
- TABLE 188 France Bio-based PMMA market volume, by application, 2018 - 2022, (Kilo Tons)
- TABLE 189 France Bio-based PMMA market volume, by application, 2023 - 2032, (Kilo Tons)
- TABLE 190 France Bio-based PMMA market revenue, by application, 2018 - 2022, (USD Million)
- TABLE 191 France BIO-BASED PMMA market revenue, by application, 2023 - 2032, (USD Million)
- TABLE 192 UK Bio-based PMMA market, 2018-2022, (Kilo Tons) (USD Million)
- TABLE 193 UK Bio-based PMMA market, 2023-2032, (Kilo Tons) (USD Million)
- TABLE 194 UK Bio-based PMMA market volume, by type, 2018 - 2022, (Kilo Tons)
- TABLE 195 UK Bio-based PMMA market volume, by type, 2023 - 2032, (Kilo Tons)
- TABLE 196 UK Bio-based PMMA market revenue, by type, 2018 - 2022, (USD Million)
- TABLE 197 UK Bio-based PMMA market revenue, by type, 2023 - 2032, (USD Million)
- TABLE 198 UK Bio-based PMMA market volume, by product, 2018 - 2022, (Kilo Tons)
- TABLE 199 UK Bio-based PMMA market volume, by product, 2023 - 2032, (Kilo Tons)
- TABLE 200 UK Bio-based PMMA market revenue, by product, 2018 - 2022, (USD Million)
- TABLE 201 UK Bio-based PMMA market revenue, by product, 2023 - 2032, (USD Million)
- TABLE 202 UK Bio-based PMMA market volume, by application, 2018 - 2022, (Kilo Tons)
- TABLE 203 UK Bio-based PMMA market volume, by application, 2023 - 2032, (Kilo Tons)
- TABLE 204 UK Bio-based PMMA market revenue, by application, 2018 - 2022, (USD Million)
- TABLE 205 UK BIO-BASED PMMA market revenue, by application, 2023 - 2032, (USD Million)
- TABLE 206 Italy Bio-based PMMA market, 2018-2022, (Kilo Tons) (USD Million)
- TABLE 207 Italy Bio-based PMMA market, 2023-2032, (Kilo Tons) (USD Million)
- TABLE 208 Italy Bio-based PMMA market volume, by type, 2018 - 2022, (Kilo Tons)
- TABLE 209 Italy Bio-based PMMA market volume, by type, 2023 - 2032, (Kilo Tons)
- TABLE 210 Italy Bio-based PMMA market revenue, by type, 2018 - 2022, (USD Million)
- TABLE 211 Italy Bio-based PMMA market revenue, by type, 2023 - 2032, (USD Million)
- TABLE 212 Italy Bio-based PMMA market volume, by product, 2018 - 2022, (Kilo Tons)
- TABLE 213 Italy Bio-based PMMA market volume, by product, 2023 - 2032, (Kilo Tons)
- TABLE 214 Italy Bio-based PMMA market revenue, by product, 2018 - 2022, (USD Million)
- TABLE 215 Italy Bio-based PMMA market revenue, by product, 2023 - 2032, (USD Million)
- TABLE 216 Italy Bio-based PMMA market volume, by application, 2018 - 2022, (Kilo Tons)
- TABLE 217 Italy Bio-based PMMA market volume, by application, 2023 - 2032, (Kilo Tons)
- TABLE 218 Italy Bio-based PMMA market revenue, by application, 2018 - 2022, (USD Million)
- TABLE 219 Italy BIO-BASED PMMA market revenue, by application, 2023 - 2032, (USD Million)
- TABLE 220 Spain Bio-based PMMA market, 2018-2022, (Kilo Tons) (USD Million)
- TABLE 221 Spain Bio-based PMMA market, 2023-2032, (Kilo Tons) (USD Million)
- TABLE 222 Spain Bio-based PMMA market volume, by type, 2018 - 2022, (Kilo Tons)
- TABLE 223 Spain Bio-based PMMA market volume, by type, 2023 - 2032, (Kilo Tons)
- TABLE 224 Spain Bio-based PMMA market revenue, by type, 2018 - 2022, (USD Million)
- TABLE 225 Spain Bio-based PMMA market revenue, by type, 2023 - 2032, (USD Million)
- TABLE 226 Spain Bio-based PMMA market volume, by product, 2018 - 2022, (Kilo Tons)
- TABLE 227 Spain Bio-based PMMA market volume, by product, 2023 - 2032, (Kilo Tons)
- TABLE 228 Spain Bio-based PMMA market revenue, by product, 2018 - 2022, (USD Million)
- TABLE 229 Spain Bio-based PMMA market revenue, by product, 2023 - 2032, (USD Million)
- TABLE 230 Spain Bio-based PMMA market volume, by application, 2018 - 2022, (Kilo Tons)
- TABLE 231 Spain Bio-based PMMA market volume, by application, 2023 - 2032, (Kilo Tons)
- TABLE 232 Spain Bio-based PMMA market revenue, by application, 2018 - 2022, (USD Million)
- TABLE 233 Spain BIO-BASED PMMA market revenue, by application, 2023 - 2032, (USD Million)
- TABLE 234 Russia Bio-based PMMA market, 2018-2022, (Kilo Tons) (USD Million)
- TABLE 235 Russia Bio-based PMMA market, 2023-2032, (Kilo Tons) (USD Million)
- TABLE 236 Russia Bio-based PMMA market volume, by type, 2018 - 2022, (Kilo Tons)
- TABLE 237 Russia Bio-based PMMA market volume, by type, 2023 - 2032, (Kilo Tons)
- TABLE 238 Russia Bio-based PMMA market revenue, by type, 2018 - 2022, (USD Million)
- TABLE 239 Russia Bio-based PMMA market revenue, by type, 2023 - 2032, (USD Million)
- TABLE 240 Russia Bio-based PMMA market volume, by product, 2018 - 2022, (Kilo Tons)
- TABLE 241 Russia Bio-based PMMA market volume, by product, 2023 - 2032, (Kilo Tons)
- TABLE 242 Russia Bio-based PMMA market revenue, by product, 2018 - 2022, (USD Million)
- TABLE 243 Russia Bio-based PMMA market revenue, by product, 2023 - 2032, (USD Million)
- TABLE 244 Russia Bio-based PMMA market volume, by application, 2018 - 2022, (Kilo Tons)
- TABLE 245 Russia Bio-based PMMA market volume, by application, 2023 - 2032, (Kilo Tons)
- TABLE 246 Russia Bio-based PMMA market revenue, by application, 2018 - 2022, (USD Million)
- TABLE 247 Russia BIO-BASED PMMA market revenue, by application, 2023 - 2032, (USD Million)
- TABLE 248 Asia Pacific Bio-based PMMA market, 2018-2022, (Kilo Tons) (USD Million)
- TABLE 249 Asia Pacific Bio-based PMMA market, 2023-2032, (Kilo Tons) (USD Million)
- TABLE 250 Asia Pacific Bio-based PMMA market volume, by type, 2018 - 2022, (Kilo Tons)
- TABLE 251 Asia Pacific Bio-based PMMA market volume, by type, 2023 - 2032, (Kilo Tons)
- TABLE 252 Asia Pacific Bio-based PMMA market revenue, by type, 2018 - 2022, (USD Million)
- TABLE 253 Asia Pacific Bio-based PMMA market revenue, by type, 2023 - 2032, (USD Million)
- TABLE 254 Asia Pacific Bio-based PMMA market volume, by product, 2018 - 2022, (Kilo Tons)
- TABLE 255 Asia Pacific Bio-based PMMA market volume, by product, 2023 - 2032, (Kilo Tons)
- TABLE 256 Asia Pacific Bio-based PMMA market revenue, by product, 2018 - 2022, (USD Million)
- TABLE 257 Asia Pacific Bio-based PMMA market revenue, by product, 2023 - 2032, (USD Million)
- TABLE 258 Asia Pacific Bio-based PMMA market volume, by application, 2018 - 2022, (Kilo Tons)
- TABLE 259 Asia Pacific Bio-based PMMA market volume, by application, 2023 - 2032, (Kilo Tons)
- TABLE 260 Asia Pacific Bio-based PMMA market revenue, by application, 2018 - 2022, (USD Million)
- TABLE 261 Asia Pacific BIO-BASED PMMA market revenue, by application, 2023 - 2032, (USD Million)
- TABLE 262 China Bio-based PMMA market, 2018-2022, (Kilo Tons) (USD Million)
- TABLE 263 China Bio-based PMMA market, 2023-2032, (Kilo Tons) (USD Million)
- TABLE 264 China Bio-based PMMA market volume, by type, 2018 - 2022, (Kilo Tons)
- TABLE 265 China Bio-based PMMA market volume, by type, 2023 - 2032, (Kilo Tons)
- TABLE 266 China Bio-based PMMA market revenue, by type, 2018 - 2022, (USD Million)
- TABLE 267 China Bio-based PMMA market revenue, by type, 2023 - 2032, (USD Million)
- TABLE 268 China Bio-based PMMA market volume, by product, 2018 - 2022, (Kilo Tons)
- TABLE 269 China Bio-based PMMA market volume, by product, 2023 - 2032, (Kilo Tons)
- TABLE 270 China Bio-based PMMA market revenue, by product, 2018 - 2022, (USD Million)
- TABLE 271 China Bio-based PMMA market revenue, by product, 2023 - 2032, (USD Million)
- TABLE 272 China Bio-based PMMA market volume, by application, 2018 - 2022, (Kilo Tons)
- TABLE 273 China Bio-based PMMA market volume, by application, 2023 - 2032, (Kilo Tons)
- TABLE 274 China Bio-based PMMA market revenue, by application, 2018 - 2022, (USD Million)
- TABLE 275 China BIO-BASED PMMA market revenue, by application, 2023 - 2032, (USD Million)
- TABLE 276 India Bio-based PMMA market, 2018-2022, (Kilo Tons) (USD Million)
- TABLE 277 India Bio-based PMMA market, 2023-2032, (Kilo Tons) (USD Million)
- TABLE 278 India Bio-based PMMA market volume, by type, 2018 - 2022, (Kilo Tons)
- TABLE 279 India Bio-based PMMA market volume, by type, 2023 - 2032, (Kilo Tons)
- TABLE 280 India Bio-based PMMA market revenue, by type, 2018 - 2022, (USD Million)
- TABLE 281 India Bio-based PMMA market revenue, by type, 2023 - 2032, (USD Million)
- TABLE 282 India Bio-based PMMA market volume, by product, 2018 - 2022, (Kilo Tons)
- TABLE 283 India Bio-based PMMA market volume, by product, 2023 - 2032, (Kilo Tons)
- TABLE 284 India Bio-based PMMA market revenue, by product, 2018 - 2022, (USD Million)
- TABLE 285 India Bio-based PMMA market revenue, by product, 2023 - 2032, (USD Million)
- TABLE 286 India Bio-based PMMA market volume, by application, 2018 - 2022, (Kilo Tons)
- TABLE 287 India Bio-based PMMA market volume, by application, 2023 - 2032, (Kilo Tons)
- TABLE 288 India Bio-based PMMA market revenue, by application, 2018 - 2022, (USD Million)
- TABLE 289 India BIO-BASED PMMA market revenue, by application, 2023 - 2032, (USD Million)
- TABLE 290 Japan Bio-based PMMA market, 2018-2022, (Kilo Tons) (USD Million)
- TABLE 291 Japan Bio-based PMMA market, 2023-2032, (Kilo Tons) (USD Million)
- TABLE 292 Japan Bio-based PMMA market volume, by type, 2018 - 2022, (Kilo Tons)
- TABLE 293 Japan Bio-based PMMA market volume, by type, 2023 - 2032, (Kilo Tons)
- TABLE 294 Japan Bio-based PMMA market revenue, by type, 2018 - 2022, (USD Million)
- TABLE 295 Japan Bio-based PMMA market revenue, by type, 2023 - 2032, (USD Million)
- TABLE 296 Japan Bio-based PMMA market volume, by product, 2018 - 2022, (Kilo Tons)
- TABLE 297 Japan Bio-based PMMA market volume, by product, 2023 - 2032, (Kilo Tons)
- TABLE 298 Japan Bio-based PMMA market revenue, by product, 2018 - 2022, (USD Million)
- TABLE 299 Japan Bio-based PMMA market revenue, by product, 2023 - 2032, (USD Million)
- TABLE 300 Japan Bio-based PMMA market volume, by application, 2018 - 2022, (Kilo Tons)
- TABLE 301 Japan Bio-based PMMA market volume, by application, 2023 - 2032, (Kilo Tons)
- TABLE 302 Japan Bio-based PMMA market revenue, by application, 2018 - 2022, (USD Million)
- TABLE 303 Japan BIO-BASED PMMA market revenue, by application, 2023 - 2032, (USD Million)
- TABLE 304 Australia Bio-based PMMA market, 2018-2022, (Kilo Tons) (USD Million)
- TABLE 305 Australia Bio-based PMMA market, 2023-2032, (Kilo Tons) (USD Million)
- TABLE 306 Australia Bio-based PMMA market volume, by type, 2018 - 2022, (Kilo Tons)
- TABLE 307 Australia Bio-based PMMA market volume, by type, 2023 - 2032, (Kilo Tons)
- TABLE 308 Australia Bio-based PMMA market revenue, by type, 2018 - 2022, (USD Million)
- TABLE 309 Australia Bio-based PMMA market revenue, by type, 2023 - 2032, (USD Million)
- TABLE 310 Australia Bio-based PMMA market volume, by product, 2018 - 2022, (Kilo Tons)
- TABLE 311 Australia Bio-based PMMA market volume, by product, 2023 - 2032, (Kilo Tons)
- TABLE 312 Australia Bio-based PMMA market revenue, by product, 2018 - 2022, (USD Million)
- TABLE 313 Australia Bio-based PMMA market revenue, by product, 2023 - 2032, (USD Million)
- TABLE 314 Australia Bio-based PMMA market volume, by application, 2018 - 2022, (Kilo Tons)
- TABLE 315 Australia Bio-based PMMA market volume, by application, 2023 - 2032, (Kilo Tons)
- TABLE 316 Australia Bio-based PMMA market revenue, by application, 2018 - 2022, (USD Million)
- TABLE 317 Australia BIO-BASED PMMA market revenue, by application, 2023 - 2032, (USD Million)
- TABLE 318 South Korea Bio-based PMMA market, 2018-2022, (Kilo Tons) (USD Million)
- TABLE 319 South Korea Bio-based PMMA market, 2023-2032, (Kilo Tons) (USD Million)
- TABLE 320 South Korea Bio-based PMMA market volume, by type, 2018 - 2022, (Kilo Tons)
- TABLE 321 South Korea Bio-based PMMA market volume, by type, 2023 - 2032, (Kilo Tons)
- TABLE 322 South Korea Bio-based PMMA market revenue, by type, 2018 - 2022, (USD Million)
- TABLE 323 South Korea Bio-based PMMA market revenue, by type, 2023 - 2032, (USD Million)
- TABLE 324 South Korea Bio-based PMMA market volume, by product, 2018 - 2022, (Kilo Tons)
- TABLE 325 South Korea Bio-based PMMA market volume, by product, 2023 - 2032, (Kilo Tons)
- TABLE 326 South Korea Bio-based PMMA market revenue, by product, 2018 - 2022, (USD Million)
- TABLE 327 South Korea Bio-based PMMA market revenue, by product, 2023 - 2032, (USD Million)
- TABLE 328 South Korea Bio-based PMMA market volume, by application, 2018 - 2022, (Kilo Tons)
- TABLE 329 South Korea Bio-based PMMA market volume, by application, 2023 - 2032, (Kilo Tons)
- TABLE 330 South Korea Bio-based PMMA market revenue, by application, 2018 - 2022, (USD Million)
- TABLE 331 South Korea BIO-BASED PMMA market revenue, by application, 2023 - 2032, (USD Million)
- TABLE 332 Indonesia Bio-based PMMA market, 2018-2022, (Kilo Tons) (USD Million)
- TABLE 333 Indonesia Bio-based PMMA market, 2023-2032, (Kilo Tons) (USD Million)
- TABLE 334 Indonesia Bio-based PMMA market volume, by type, 2018 - 2022, (Kilo Tons)
- TABLE 335 Indonesia Bio-based PMMA market volume, by type, 2023 - 2032, (Kilo Tons)
- TABLE 336 Indonesia Bio-based PMMA market revenue, by type, 2018 - 2022, (USD Million)
- TABLE 337 Indonesia Bio-based PMMA market revenue, by type, 2023 - 2032, (USD Million)
- TABLE 338 Indonesia Bio-based PMMA market volume, by product, 2018 - 2022, (Kilo Tons)
- TABLE 339 Indonesia Bio-based PMMA market volume, by product, 2023 - 2032, (Kilo Tons)
- TABLE 340 Indonesia Bio-based PMMA market revenue, by product, 2018 - 2022, (USD Million)
- TABLE 341 Indonesia Bio-based PMMA market revenue, by product, 2023 - 2032, (USD Million)
- TABLE 342 Indonesia Bio-based PMMA market volume, by application, 2018 - 2022, (Kilo Tons)
- TABLE 343 Indonesia Bio-based PMMA market volume, by application, 2023 - 2032, (Kilo Tons)
- TABLE 344 Indonesia Bio-based PMMA market revenue, by application, 2018 - 2022, (USD Million)
- TABLE 345 Indonesia BIO-BASED PMMA market revenue, by application, 2023 - 2032, (USD Million)
- TABLE 346 Latin America Bio-based PMMA market, 2018-2022, (Kilo Tons) (USD Million)
- TABLE 347 Latin America Bio-based PMMA market, 2023-2032, (Kilo Tons) (USD Million)
- TABLE 348 Latin America Bio-based PMMA market volume, by type, 2018 - 2022, (Kilo Tons)
- TABLE 349 Latin America Bio-based PMMA market volume, by type, 2023 - 2032, (Kilo Tons)
- TABLE 350 Latin America Bio-based PMMA market revenue, by type, 2018 - 2022, (USD Million)
- TABLE 351 Latin America Bio-based PMMA market revenue, by type, 2023 - 2032, (USD Million)
- TABLE 352 Latin America Bio-based PMMA market volume, by product, 2018 - 2022, (Kilo Tons)
- TABLE 353 Latin America Bio-based PMMA market volume, by product, 2023 - 2032, (Kilo Tons)
- TABLE 354 Latin America Bio-based PMMA market revenue, by product, 2018 - 2022, (USD Million)
- TABLE 355 Latin America Bio-based PMMA market revenue, by product, 2023 - 2032, (USD Million)
- TABLE 356 Latin America Bio-based PMMA market volume, by application, 2018 - 2022, (Kilo Tons)
- TABLE 357 Latin America Bio-based PMMA market volume, by application, 2023 - 2032, (Kilo Tons)
- TABLE 358 Latin America Bio-based PMMA market revenue, by application, 2018 - 2022, (USD Million)
- TABLE 359 Latin America BIO-BASED PMMA market revenue, by application, 2023 - 2032, (USD Million)
- TABLE 360 Brazil Bio-based PMMA market, 2018-2022, (Kilo Tons) (USD Million)
- TABLE 361 Brazil Bio-based PMMA market, 2023-2032, (Kilo Tons) (USD Million)
- TABLE 362 Brazil Bio-based PMMA market volume, by type, 2018 - 2022, (Kilo Tons)
- TABLE 363 Brazil Bio-based PMMA market volume, by type, 2023 - 2032, (Kilo Tons)
- TABLE 364 Brazil Bio-based PMMA market revenue, by type, 2018 - 2022, (USD Million)
- TABLE 365 Brazil Bio-based PMMA market revenue, by type, 2023 - 2032, (USD Million)
- TABLE 366 Brazil Bio-based PMMA market volume, by product, 2018 - 2022, (Kilo Tons)
- TABLE 367 Brazil Bio-based PMMA market volume, by product, 2023 - 2032, (Kilo Tons)
- TABLE 368 Brazil Bio-based PMMA market revenue, by product, 2018 - 2022, (USD Million)
- TABLE 369 Brazil Bio-based PMMA market revenue, by product, 2023 - 2032, (USD Million)
- TABLE 370 Brazil Bio-based PMMA market volume, by application, 2018 - 2022, (Kilo Tons)
- TABLE 371 Brazil Bio-based PMMA market volume, by application, 2023 - 2032, (Kilo Tons)
- TABLE 372 Brazil Bio-based PMMA market revenue, by application, 2018 - 2022, (USD Million)
- TABLE 373 Brazil BIO-BASED PMMA market revenue, by application, 2023 - 2032, (USD Million)
- TABLE 374 Mexico Bio-based PMMA market, 2018-2022, (Kilo Tons) (USD Million)
- TABLE 375 Mexico Bio-based PMMA market, 2023-2032, (Kilo Tons) (USD Million)
- TABLE 376 Mexico Bio-based PMMA market volume, by type, 2018 - 2022, (Kilo Tons)
- TABLE 377 Mexico Bio-based PMMA market volume, by type, 2023 - 2032, (Kilo Tons)
- TABLE 378 Mexico Bio-based PMMA market revenue, by type, 2018 - 2022, (USD Million)
- TABLE 379 Mexico Bio-based PMMA market revenue, by type, 2023 - 2032, (USD Million)
- TABLE 380 Mexico Bio-based PMMA market volume, by product, 2018 - 2022, (Kilo Tons)
- TABLE 381 Mexico Bio-based PMMA market volume, by product, 2023 - 2032, (Kilo Tons)
- TABLE 382 Mexico Bio-based PMMA market revenue, by product, 2018 - 2022, (USD Million)
- TABLE 383 Mexico Bio-based PMMA market revenue, by product, 2023 - 2032, (USD Million)
- TABLE 384 Mexico Bio-based PMMA market volume, by application, 2018 - 2022, (Kilo Tons)
- TABLE 385 Mexico Bio-based PMMA market volume, by application, 2023 - 2032, (Kilo Tons)
- TABLE 386 Mexico Bio-based PMMA market revenue, by application, 2018 - 2022, (USD Million)
- TABLE 387 Mexico BIO-BASED PMMA market revenue, by application, 2023 - 2032, (USD Million)
- TABLE 388 Middle East & Africa Bio-based PMMA market, 2018-2022, (Kilo Tons) (USD Million)
- TABLE 389 Middle East & Africa Bio-based PMMA market, 2023-2032, (Kilo Tons) (USD Million)
- TABLE 390 Middle East & Africa Bio-based PMMA market volume, by type, 2018 - 2022, (Kilo Tons)
- TABLE 391 Middle East & Africa Bio-based PMMA market volume, by type, 2023 - 2032, (Kilo Tons)
- TABLE 392 Middle East & Africa Bio-based PMMA market revenue, by type, 2018 - 2022, (USD Million)
- TABLE 393 Middle East & Africa Bio-based PMMA market revenue, by type, 2023 - 2032, (USD Million)
- TABLE 394 Middle East & Africa Bio-based PMMA market volume, by product, 2018 - 2022, (Kilo Tons)
- TABLE 395 Middle East & Africa Bio-based PMMA market volume, by product, 2023 - 2032, (Kilo Tons)
- TABLE 396 Middle East & Africa Bio-based PMMA market revenue, by product, 2018 - 2022, (USD Million)
- TABLE 397 Middle East & Africa Bio-based PMMA market revenue, by product, 2023 - 2032, (USD Million)
- TABLE 398 Middle East & Africa Bio-based PMMA market volume, by application, 2018 - 2022, (Kilo Tons)
- TABLE 399 Middle East & Africa Bio-based PMMA market volume, by application, 2023 - 2032, (Kilo Tons)
- TABLE 400 Middle East & Africa Bio-based PMMA market revenue, by application, 2018 - 2022, (USD Million)
- TABLE 401 Middle East & Africa BIO-BASED PMMA market revenue, by application, 2023 - 2032, (USD Million)
- TABLE 402 Saudi Arabia Bio-based PMMA market, 2018-2022, (Kilo Tons) (USD Million)
- TABLE 403 Saudi Arabia Bio-based PMMA market, 2023-2032, (Kilo Tons) (USD Million)
- TABLE 404 Saudi Arabia Bio-based PMMA market volume, by type, 2018 - 2022, (Kilo Tons)
- TABLE 405 Saudi Arabia Bio-based PMMA market volume, by type, 2023 - 2032, (Kilo Tons)
- TABLE 406 Saudi Arabia Bio-based PMMA market revenue, by type, 2018 - 2022, (USD Million)
- TABLE 407 Saudi Arabia Bio-based PMMA market revenue, by type, 2023 - 2032, (USD Million)
- TABLE 408 Saudi Arabia Bio-based PMMA market volume, by product, 2018 - 2022, (Kilo Tons)
- TABLE 409 Saudi Arabia Bio-based PMMA market volume, by product, 2023 - 2032, (Kilo Tons)
- TABLE 410 Saudi Arabia Bio-based PMMA market revenue, by product, 2018 - 2022, (USD Million)
- TABLE 411 Saudi Arabia Bio-based PMMA market revenue, by product, 2023 - 2032, (USD Million)
- TABLE 412 Saudi Arabia Bio-based PMMA market volume, by application, 2018 - 2022, (Kilo Tons)
- TABLE 413 Saudi Arabia Bio-based PMMA market volume, by application, 2023 - 2032, (Kilo Tons)
- TABLE 414 Saudi Arabia Bio-based PMMA market revenue, by application, 2018 - 2022, (USD Million)
- TABLE 415 Saudi Arabia BIO-BASED PMMA market revenue, by application, 2023 - 2032, (USD Million)
- TABLE 416 UAE Bio-based PMMA market, 2018-2022, (Kilo Tons) (USD Million)
- TABLE 417 UAE Bio-based PMMA market, 2023-2032, (Kilo Tons) (USD Million)
- TABLE 418 UAE Bio-based PMMA market volume, by type, 2018 - 2022, (Kilo Tons)
- TABLE 419 UAE Bio-based PMMA market volume, by type, 2023 - 2032, (Kilo Tons)
- TABLE 420 UAE Bio-based PMMA market revenue, by type, 2018 - 2022, (USD Million)
- TABLE 421 UAE Bio-based PMMA market revenue, by type, 2023 - 2032, (USD Million)
- TABLE 422 UAE Bio-based PMMA market volume, by product, 2018 - 2022, (Kilo Tons)
- TABLE 423 UAE Bio-based PMMA market volume, by product, 2023 - 2032, (Kilo Tons)
- TABLE 424 UAE Bio-based PMMA market revenue, by product, 2018 - 2022, (USD Million)
- TABLE 425 UAE Bio-based PMMA market revenue, by product, 2023 - 2032, (USD Million)
- TABLE 426 UAE Bio-based PMMA market volume, by application, 2018 - 2022, (Kilo Tons)
- TABLE 427 UAE Bio-based PMMA market volume, by application, 2023 - 2032, (Kilo Tons)
- TABLE 428 UAE Bio-based PMMA market revenue, by application, 2018 - 2022, (USD Million)
- TABLE 429 UAE BIO-BASED PMMA market revenue, by application, 2023 - 2032, (USD Million)
- TABLE 430 South Africa Bio-based PMMA market, 2018-2022, (Kilo Tons) (USD Million)
- TABLE 431 South Africa Bio-based PMMA market, 2023-2032, (Kilo Tons) (USD Million)
- TABLE 432 South Africa Bio-based PMMA market volume, by type, 2018 - 2022, (Kilo Tons)
- TABLE 433 South Africa Bio-based PMMA market volume, by type, 2023 - 2032, (Kilo Tons)
- TABLE 434 South Africa Bio-based PMMA market revenue, by type, 2018 - 2022, (USD Million)
- TABLE 435 South Africa Bio-based PMMA market revenue, by type, 2023 - 2032, (USD Million)
- TABLE 436 South Africa Bio-based PMMA market volume, by product, 2018 - 2022, (Kilo Tons)
- TABLE 437 South Africa Bio-based PMMA market volume, by product, 2023 - 2032, (Kilo Tons)
- TABLE 438 South Africa Bio-based PMMA market revenue, by product, 2018 - 2022, (USD Million)
- TABLE 439 South Africa Bio-based PMMA market revenue, by product, 2023 - 2032, (USD Million)
- TABLE 440 South Africa Bio-based PMMA market volume, by application, 2018 - 2022, (Kilo Tons)
- TABLE 441 South Africa Bio-based PMMA market volume, by application, 2023 - 2032, (Kilo Tons)
- TABLE 442 South Africa Bio-based PMMA market revenue, by application, 2018 - 2022, (USD Million)
- TABLE 443 South Africa BIO-BASED PMMA market revenue, by application, 2023 - 2032, (USD Million)
Charts & Figures
- FIG 1 Industry segmentation
- FIG 2 Global Bio-based PMMA market estimates and forecast, (Kilo Tons) (USD Million), 2018 - 2032
- FIG 3 Industry ecosystem analysis
- FIG 4 Methyl methacrylate production by region (2022) (Tons)
- FIG 5 Methyl methacrylate consumption by region (2022)
- FIG 6 Growth potential analysis, 2022
- FIG 7 Porter's analysis
- FIG 8 Company market share analysis, 2022
- FIG 9 PESTEL analysis
- FIG 10 Global PMMA product volume share 2018 & 2032
- FIG 11 PMMA application volume share, 2018 & 2032
- FIG 12 Global PMMA regional volume share, 2018 & 2032
- FIG 13 SWOT Analysis, Evonik Industries
- FIG 14 SWOT Analysis, Mitsubishi Chemicals
- FIG 15 SWOT Analysis, Arkema SA
- FIG 16 SWOT Analysis, Altuglas International Sas
- FIG 17 SWOT Analysis, Kuraray Group
- FIG 18 SWOT Analysis, Sumitomo Chemicals Co. Ltd.
- FIG 19 SWOT Analysis, Asahi Kasei Corp.
- FIG 20 SWOT Analysis, SABIC
- FIG 21 SWOT Analysis, Makevale Group
- FIG 22 SWOT Analysis, RTP Company
Global Bio-based PMMA market is poised for significant growth over 2023-2032, driven by the rising demand for sustainable materials across multiple industries. Traditional PMMA is derived from petroleum-based sources, whereas bio PMMA is produced using renewable raw materials such as plant-based feedstocks or bio-based monomers. This shift towards bio PMMA aligns with the global trend of reducing carbon footprint and promoting environmentally friendly solutions and is one of the key contributors to market growth.
Increasing awareness and concern about the environmental impact of plastics is yet another factor creating ample growth opportunities for the bio-based PMMA industry. Bio PMMA offers a sustainable solution by reducing dependence on fossil fuels, minimizing greenhouse gas emissions, and mitigating plastic waste. Rapid adoption of bio PMMA in various applications helps industries achieve their sustainability goals while maintaining product performance and quality. This apart, the increased product usage across the automotive, electronics, and building & construction sectors will propel market revenue through 2032.
The bio-based PMMA market is categorized based on type, product, application, and region.
Regarding the product category, the market share from the others segment, comprising injection molding, coatings & adhesives, fibers, filaments, etc., will drive significant revenue through 2032. Injection molded bio PMMA finds extensive usage in manufacturing automotive components, electrical and electronic enclosures, consumer goods, and various industrial parts. These products exhibit high impact resistance, dimensional stability, and good surface finish. In addition, the increased adoption of bio-based PMMA fibers and filaments across the textile and apparel industry, owing to their specific properties, such as moisture-wicking, lightweight, and durability, will favor segment growth.
Based on type, the heat-resistant PMMA market size is anticipated to grow at around 16% CAGR from 2023 to 2032. Heat-resistant PMMA demonstrates superior resistance against heat and extreme weather conditions and can retain excellent transparency. Compared to standard PMMA, these can withstand up to 10°C more heat, which eventually increases the hardness of the product. Driven by these attributes, these materials find extensive usage in car lamp lenses or other lamps that require heat resistance due to the heat generated by the light sources.
With respect to application, the industry value from the automotive application segment is set to increase commendably over the next ten years. Rising awareness about using lightweight materials for vehicle production to improve fuel efficiency and contain carbon emissions will drive the demand for bio PMMA in automobile applications. Stringent regulations pertaining to achieving a better fuel economy by 2025 in countries such as the U.S. will further accelerate business growth through 2032.
Regionally, Latin America bio-based PMMA market is expected to be worth USD 16.5 million by 2032. Increasing focus on sustainability and rising environmental awareness are among the key factors bolstering the uptake of bio PMMA in the region. In addition, an increased emphasis on the utilization of eco-friendly alternatives in industries such as construction, automotive, electronics, and packaging will stimulate product demand in Latin America.
Table of Contents
Chapter 1 Methodology & Scope
- 1.1 Scope & definitions
- 1.2 Methodology & forecast parameters
- 1.3 Region-wise COVID-19 impact analysis
- 1.3.1 North America
- 1.3.2 Europe
- 1.3.3 Asia Pacific
- 1.3.4 Latin America
- 1.3.5 Middle East & Africa
- 1.4 Regional Trends
- 1.5 Data Sources
- 1.5.1 Secondary
- 1.5.2 Primary
Chapter 2 Executive Summary
- 2.1 Global Bio-based PMMA industry 360 degree synopsis, 2018 - 2032
- 2.1.1 Business trends
- 2.1.2 Type trends
- 2.1.3 Product trends
- 2.1.4 Application trends
- 2.1.5 Region trends
Chapter 3 Bio-based PMMA Industry Insights
- 3.1 Introduction
- 3.2 Impact of COVID-19 on industry landscape
- 3.3 Industry ecosystem analysis
- 3.3.1 Profit margins
- 3.3.2 Value addition
- 3.3.3 Distribution channel analysis
- 3.3.4 Vendor matrix
- 3.3.4.1 List of key raw material suppliers
- 3.3.4.2 List of key manufacturers/distributors
- 3.4 Raw material trends
- 3.5 Innovation & sustainability
- 3.5.1 Patent analysis
- 3.5.2 Production process
- 3.5.3 Future trends
- 3.6 Industry impact forces
- 3.6.1 Growth drivers
- 3.6.2 Industry pitfalls & challenges
- 3.7 Regulatory trends
- 3.8 Growth potential analysis, 2022
- 3.9 Regional price trends
- 3.9.1 Cost structure analysis
- 3.9.1.1 R&D cost
- 3.9.1.2 Manufacturing & equipment cost
- 3.9.1.3 Raw material cost
- 3.9.1.4 Distribution cost
- 3.9.1.5 Operating cost
- 3.9.1.6 Miscellaneous cost
- 3.9.1 Cost structure analysis
- 3.10 Porter's analysis
- 3.11.1 Threat of new entrants
- 3.11.2 Supplier power
- 3.11.3 Buyer power
- 3.11.4 Threat of substitutes
- 3.11 PESTEL analysis
- 3.12 Impact of COVID-19 on Bio-based PMMA market, by application
- 3.13.1 Signs & Display
- 3.13.2 Automobile
- 3.13.3 Electronics
- 3.13.4 Construction
- 3.13.5 Healthcare
Chapter 4 Competitive landscape, 2021
- 4.1 Introduction
- 4.2 Company Market share analysis, by region
- 4.3 Competitive analysis of major market players
- 4.4 Competitive positioning matrix
- 4.5 Strategic outlook matrix
Chapter 5 Bio-based PMMA Market, By Type
- 5.1 Bio-based PMMA market material share, by type, 2022 & 2032
- 5.2 General PMMA
- 5.2.1 Market estimates and forecasts, 2018 - 2032
- 5.2.2 Market estimates and forecast, by region, 2018 - 2032
- 5.3 Heat Resistant PMMA
- 5.3.1 Market estimates and forecasts, 2018 - 2032
- 5.3.2 Market estimates and forecast, by region, 2018 - 2032
- 5.4 Impact Resistant PMMA
- 5.4.1 Market estimates and forecasts, 2018 - 2032
- 5.4.2 Market estimates and forecast, by region, 2018 - 2032
Chapter 6 Bio-based PMMA Market, By Product
- 6.1 Bio-based PMMA market material share, by product, 2022 & 2032
- 6.2 Extruded sheets
- 6.2.1 Market estimates and forecasts, 2018 - 2032
- 6.2.2 Market estimates and forecast, by region, 2018 - 2032
- 6.3 Pellets
- 6.3.1 Market estimates and forecasts, 2018 - 2032
- 6.3.2 Market estimates and forecast, by region, 2018 - 2032
- 6.4 Beads
- 6.4.1 Market estimates and forecasts, 2018 - 2032
- 6.4.2 Market estimates and forecast, by region, 2018 - 2032
- 6.5 Others
- 6.5.1 Market estimates and forecasts, 2018 - 2032
- 6.5.2 Market estimates and forecast, by region, 2018 - 2032
Chapter 7 Bio-based PMMA Market, By Application
- 7.1 Bio-based PMMA market material share, by application, 2022 & 2032
- 7.2 Electronics
- 7.2.1 Market estimates and forecasts, 2018 - 2032
- 7.4.2 Market estimates and forecast, by region, 2018 - 2032
- 7.3 Automotive
- 7.3.1 Market estimates and forecasts, 2018 - 2032
- 7.3.2 Market estimates and forecast, by region, 2018 - 2032
- 7.4 Consumer goods
- 7.4.1 Market estimates and forecasts, 2018 - 2032
- 7.4.2 Market estimates and forecast, by region, 2018 - 2032
- 7.5 Healthcare
- 7.5.1 Market estimates and forecasts, 2018 - 2032
- 7.5.2 Market estimates and forecast, by region, 2018 - 2032
- 7.6 Construction
- 7.6.1 Market estimates and forecasts, 2018 - 2032
- 7.6.2 Market estimates and forecast, by region, 2018 - 2032
- 7.7 Signs & Display
- 7.7.1 Market estimates and forecasts, 2018 - 2032
- 7.7.2 Market estimates and forecast, by region, 2018 - 2032
- 7.8 Others
- 7.8.1 Market estimates and forecasts, 2018 - 2032
- 7.8.2 Market estimates and forecast, by region, 2018 - 2032
Chapter 8 Bio-based PMMA Market, By Region
- 8.1 Bio-based PMMA market share, by region, 2022 & 2032
- 8.2 North America
- 8.2.1 Market estimates and forecast, 2018 - 2032
- 8.2.2 Market estimates and forecast, by type, 2018 - 2032
- 8.2.3 Market estimates and forecast, by product, 2018 - 2032
- 8.2.4 Market estimates and forecast, by application, 2018 - 2032
- 8.2.5 U.S.
- 8.2.5.1 Market estimates and forecast, 2018 - 2028
- 8.2.5.2 Market estimates and forecast, by type, 2018 - 2028
- 8.2.5.3 Market estimates and forecast, by product, 2018 - 2032
- 8.2.5.4 Market estimates and forecast, by application, 2018 - 2032
- 8.2.6 Canada
- 8.2.6.1 Market estimates and forecast, 2018 - 2028
- 8.2.6.2 Market estimates and forecast, by type, 2018 - 2028
- 8.2.6.3 Market estimates and forecast, by product, 2018 - 2032
- 8.2.6.4 Market estimates and forecast, by application, 2018 - 2032
- 8.3 Europe
- 8.3.1 Market estimates and forecast, 2018 - 2032
- 8.3.2 Market estimates and forecast, by type, 2018 - 2032
- 8.3.3 Market estimates and forecast, by product, 2018 - 2032
- 8.3.4 Market estimates and forecast, by application, 2018 - 2032
- 8.3.5 Germany
- 8.3.5.1 Market estimates and forecast, 2018 - 2032
- 8.3.5.2 Market estimates and forecast, by type, 2018 - 2032
- 8.3.5.3 Market estimates and forecast, by product, 2018 - 2032
- 8.3.5.4 Market estimates and forecast, by application, 2018 - 2032
- 8.3.6 UK
- 8.3.6.1 Market estimates and forecast, 2018 - 2032
- 8.3.6.2 Market estimates and forecast, by type, 2018 - 2032
- 8.3.6.3 Market estimates and forecast, by product, 2018 - 2032
- 8.3.6.4 Market estimates and forecast, by application, 2018 - 2032
- 8.3.7 France
- 8.3.7.1 Market estimates and forecast, 2018 - 2032
- 8.3.7.2 Market estimates and forecast, by type, 2018 - 2032
- 8.3.7.3 Market estimates and forecast, by product, 2018 - 2032
- 8.3.7.4 Market estimates and forecast, by application, 2018 - 2032
- 8.3.8 Italy
- 8.3.8.1 Market estimates and forecast, 2018 - 2032
- 8.3.8.2 Market estimates and forecast, by type, 2018 - 2032
- 8.3.8.3 Market estimates and forecast, by product, 2018 - 2032
- 8.3.8.4 Market estimates and forecast, by application, 2018 - 2032
- 8.3.9 Spain
- 9.3.9.1 Market estimates and forecast, 2018 - 2032
- 9.3.9.2 Market estimates and forecast, by type, 2018 - 2032
- 9.3.9.3 Market estimates and forecast, by product, 3019 - 3039
- 9.3.9.4 Market estimates and forecast, by application, 3019 - 3039
- 8.3.10 Russia
- 10.3.10.1 Market estimates and forecast, 2018 - 2032
- 10.3.10.2 Market estimates and forecast, by type, 2018 - 2032
- 10.3.10.3 Market estimates and forecast, by product, 2018 - 2032
- 10.3.10.4 Market estimates and forecast, by application, 2018 - 2032
- 8.4 Asia Pacific
- 8.4.1 Market estimates and forecast, 2018 - 2032
- 8.4.2 Market estimates and forecast, by type, 2018 - 2032
- 8.4.3 Market estimates and forecast, by product, 2018 - 2032
- 8.4.4 Market estimates and forecast, by application, 2018 - 2032
- 8.4.5 China
- 8.4.5.1 Market estimates and forecast, 2018 - 2032
- 8.4.5.2 Market estimates and forecast, by type, 2018 - 2032
- 8.4.5.3 Market estimates and forecast, by product, 2018 - 2032
- 8.4.5.4 Market estimates and forecast, by application, 2018 - 2032
- 8.4.6 India
- 8.4.6.1 Market estimates and forecast, 2018 - 2032
- 8.4.6.2 Market estimates and forecast, by type, 2018 - 2032
- 8.4.6.3 Market estimates and forecast, by product, 2018 - 2032
- 8.4.6.4 Market estimates and forecast, by application, 2018 - 2032
- 8.4.7 Japan
- 8.4.7.1 Market estimates and forecast, 2018 - 2032
- 8.4.7.2 Market estimates and forecast, by type, 2018 - 2032
- 8.4.7.3 Market estimates and forecast, by product, 2018 - 2032
- 8.4.7.4 Market estimates and forecast, by application, 2018 - 2032
- 8.4.8 Australia
- 8.4.8.1 Market estimates and forecast, 2018 - 2032
- 8.4.8.2 Market estimates and forecast, by type, 2018 - 2032
- 8.8.3 Market estimates and forecast, by product, 2018 - 2032
- 8.4.8.4 Market estimates and forecast, by application, 2018 - 2032
- 8.4.9 South Korea
- 8.4.9.1 Market estimates and forecast, 2018 - 2032
- 8.4.9.2 Market estimates and forecast, by type, 2018 - 2032
- 8.4.9.3 Market estimates and forecast, by product, 3019 - 3039
- 8.4.9.4 Market estimates and forecast, by application, 3019 - 3039
- 8.3.40 Indonesia
- 8.4.10.1 Market estimates and forecast, 2018 - 2032
- 8.4.10.2 Market estimates and forecast, by type, 2018 - 2032
- 8.4.10.3 Market estimates and forecast, by product, 2018 - 2032
- 8.4.10.4 Market estimates and forecast, by application, 2018 - 2032
- 8.5 Latin America
- 8.5.1 Market estimates and forecast, 2018 - 2032
- 8.5.2 Market estimates and forecast, by type, 2018 - 2032
- 8.5.3 Market estimates and forecast, by product, 2018 - 2032
- 8.5.4 Market estimates and forecast, by application, 2018 - 2032
- 8.5.5 Brazil
- 8.5.5.1 Market estimates and forecast, 2018 - 2032
- 8.5.5.2 Market estimates and forecast, by type, 2018 - 2032
- 8.5.5.3 Market estimates and forecast, by product, 2018 - 2032
- 8.5.5.4 Market estimates and forecast, by application, 2018 - 2032
- 8.5.6 Mexico
- 8.5.6.1 Market estimates and forecast, 2018 - 2032
- 8.5.6.2 Market estimates and forecast, by type, 2018 - 2032
- 8.5.6.3 Market estimates and forecast, by product, 2018 - 2032
- 8.5.6.4 Market estimates and forecast, by application, 2018 - 2032
- 8.6 Middle East & Africa
- 8.6.1 Market estimates and forecast, 2018 - 2032
- 8.6.2 Market estimates and forecast, by type, 2018 - 2032
- 8.6.3 Market estimates and forecast, by product, 2018 - 2032
- 8.6.4 Market estimates and forecast, by application, 2018 - 2032
- 8.6.5 Saudi Arabia
- 8.6.5.1 Market estimates and forecast, 2018 - 2032
- 8.6.5.2 Market estimates and forecast, by type, 2018 - 2032
- 8.6.5.3 Market estimates and forecast, by product, 2018 - 2032
- 8.6.5.4 Market estimates and forecast, by application, 2018 - 2032
- 8.5.6 UAE
- 8.6.6.1 Market estimates and forecast, 2018 - 2032
- 8.6.6.2 Market estimates and forecast, by type, 2018 - 2032
- 8.6.6.3 Market estimates and forecast, by product, 2018 - 2032
- 8.6.6.4 Market estimates and forecast, by application, 2018 - 2032
- 8.5.7 South Africa
- 8.6.7.1 Market estimates and forecast, 2018 - 2032
- 8.6.7.2 Market estimates and forecast, by type, 2018 - 2032
- 8.6.7.3 Market estimates and forecast, by product, 2018 - 2032
- 8.6.7.4 Market estimates and forecast, by application, 2018 - 2032
Chapter 9 Company Profiles
- 9.1 Evonik Industries
- 9.1.1 Business overview
- 9.1.2 Financial Data
- 9.1.3 Product landscape
- 9.1.4 SWOT analysis
- 9.2 Arkema SA
- 9.2.1 Business overview
- 9.2.2 Financial data
- 9.2.3 Product landscape
- 9.2.4 SWOT analysis
- 9.3 Mitsubishi Rayon Corp
- 9.3.1 Business overview
- 9.3.2 Financial data
- 9.3.3 Product landscape
- 9.3.4 Strategic Outlook
- 9.3.5 SWOT analysis
- 9.4 Altuglas International Sas
- 9.4.1 Business overview
- 9.4.2 Financial data
- 9.4.3 Product landscape
- 9.4.4 SWOT analysis
- 9.5 Kuraray Group
- 9.5.1 Business overview
- 9.5.2 Financial data
- 9.5.3 Product landscape
- 9.5.4 Strategic Outlook
- 9.5.5 SWOT analysis
- 9.6 Asahi Kesei Corp
- 9.6.1 Business overview
- 9.6.2 Financial data
- 9.6.3 Product landscape
- 9.6.4 SWOT analysis
- 9.9 Sumitomo Chemical Co., Ltd
- 9.9.1 Business overview
- 9.9.2 Financial data
- 9.9.3 Product landscape
- 9.9.4 SWOT analysis
- 9.8 Sabic
- 9.8.1 Business overview
- 9.8.2 Financial data
- 9.8.3 Product landscape
- 9.8.4 Strategic Outlook
- 9.8.5 SWOT analysis
- 9.9 Makevale Group
- 9.9.1 Business Overview
- 9.9.2 Financial data
- 9.9.3 Product landscape
- 9.9.4 SWOT analysis
- 9.10 RTP Company
- 9.10.1 Business overview
- 9.10.2 Financial data
- 9.10.3 Product landscape
- 9.10.4 SWOT analysis