|
|
市場調査レポート
商品コード
1287290
住宅用ヒートポンプの市場規模:製品別、用途別、世界予測レポート、2023年~2032年Residential Heat Pump Market Size - By Product (Air Source, Ground Source, Water Source), By Application (Single Family, Multi Family) & Global Forecast Report, 2023 - 2032 |
||||||
|
|
|||||||
|
● お客様のご希望に応じて、既存データの加工や未掲載情報(例:国別セグメント)の追加などの対応が可能です。 詳細はお問い合わせください。 |
|||||||


| 住宅用ヒートポンプの市場規模:製品別、用途別、世界予測レポート、2023年~2032年 |
|
出版日: 2023年05月15日
発行: Global Market Insights Inc.
ページ情報: 英文 385 Pages
納期: 2~3営業日
|
- 全表示
- 概要
- 図表
- 目次
住宅用ヒートポンプの世界市場は、エネルギー効率の高い暖房システムへの志向の高まりにより、2023年から2032年にかけて堅調なCAGRで成長すると予想されています。
エネルギー効率の高い冷暖房システムを利用することで、総エネルギー支出を抑えることができるという消費者の認識が高まり、あらゆる所得層で可処分所得が大幅に増加していることが、市場の拡大を後押ししています。
ヒートポンプは、建物のHVACソリューションとして機能する電気機器であり、環境に与える影響を最小限に抑えながら、費用対効果の高い冷暖房を提供します。ヒートポンプは、冷媒の蒸発と凝縮を繰り返すことで、ある場所から別の場所に熱を移動させる装置です。
気候変動と世界の気温の上昇により、多くの地域で冷房ソリューションの需要が高まっています。ヒートポンプは効率的な空調を提供し、優れた暖房能力を発揮するため、温暖な気候と寒冷な気候の両方の家庭で汎用性の高いソリューションとなります。年間を通じて快適な環境を保ちたいというニーズが、住宅用ヒートポンプの普及を後押ししています。このほか、効率的な冷暖房システムに対する需要の高まり、気候環境の変化、新たな研究開発活動、二酸化炭素排出量の抑制の重視などが、今後10年間の業界の成長に有利に働くでしょう。
住宅用ヒートポンプ業界は、製品、用途、地域によって区分されます。
製品別では、水源分野の住宅用ヒートポンプ市場が2023年から2032年にかけて大きな収益を獲得すると予測されています。水源ヒートポンプの需要を刺激する主要なパラメータは、極端な温度下での高いエネルギー効率、他の暖房システムとの容易な統合、長寿命、レトロフィット作業での効果的な展開、金融給付プログラムの利用が可能であることです。
市場規模・推計では、2032年まで集合住宅用ヒートポンプの市場規模が大きく成長すると予想されています。住宅用ヒートポンプは、省エネ、二酸化炭素排出量の削減、個別の温度制御など、集合住宅において複数のメリットを提供し、これらの建物にとって魅力的な選択肢となっています。さらに、ヒートポンプ技術の進歩、システム性能の向上、集合住宅に適したコンパクトで省スペースなモデルの登場が、セグメントの成長を後押ししています。
北米の住宅用ヒートポンプ市場は、州や連邦レベルでの規制の枠組みが整っていることから、2023年から2032年にかけて高いCAGRで成長すると予想されています。また、有利な財政支援プログラム、継続的な研究開発イニシアティブ、持続可能な冷暖房ソリューションに対する消費者の意識の高まりが、同地域での製品採用を後押ししています。さらに、環境に優しくエネルギー効率の高い冷暖房ソリューションへの移行は、この地域の状況にプラスの影響を与えるでしょう。
目次
第1章 調査手法とスコープ
第2章 エグゼクティブサマリー
第3章 住宅用ヒートポンプの業界洞察
- 業界エコシステム分析
- ベンダーマトリックス
- 規制状況
- COVID-19が業界の展望に与える影響
- 業界への影響要因
- 促進要因
- 業界の潜在的リスク&課題
- 成長ポテンシャル分析
- ポーター分析
- PESTEL分析
第4章 競合ベンチマーキング
- 競合情勢、2022年版
- 戦略的ダッシュボード
- イノベーションとテクノロジーの展望
第5章 住宅用ヒートポンプ市場:製品別
- 主な製品動向
- 空気熱源
- 地中熱源
- 水冷式
第6章 住宅用ヒートポンプ市場:用途別
- 主な用途動向
- シングルファミリー
- マルチファミリー
第7章 住宅用ヒートポンプの市場:地域別
- 主な地域動向
- 北米
- 米国
- カナダ
- 欧州
- オーストリア
- ノルウェー
- デンマーク
- フィンランド
- フランス
- ドイツ
- イタリア
- スイス
- スペイン
- スウェーデン
- 英国
- オランダ
- アジア太平洋
- 中国
- 日本
- オーストラリア
- 韓国
- 中東・アフリカ地域
- サウジアラビア
- トルコ
- 南アフリカ共和国
- ラテンアメリカ
- ブラジル
- メキシコ
- アルゼンチン
第8章 企業プロファイル
- Carrier
- Daikin
- SAMSUNG
- Mitsubishi Electric Corporation
- LG Electronics
- Lochinvar
- Viessmann
- Kensa Heat Pumps
- Glen Dimplex Group
- Panasonic Corporation
- Vaillant Group
- Guangzhou SPRSUN New Energy Technology Development Co., Ltd.
- STIEBEL ELTRON GmbH & Co. KG
- Trane
- OCHSNER
Data Tables
- TABLE 1 Global market, 2019 - 2022 (Volume & Revenue)
- TABLE 2 Global market, 2023 - 2027 (Volume & Revenue)
- TABLE 3 Global market, 2028 - 2032 (Volume & Revenue)
- TABLE 4 Global market by product, 2019 - 2022 ('000 Units)
- TABLE 5 Global market by product, 2023 - 2027 ('000 Units)
- TABLE 6 Global market by product, 2028 - 2032 ('000 Units)
- TABLE 7 Global market by product, 2019 - 2022 (USD Million)
- TABLE 8 Global market by product, 2023 - 2027 (USD Million)
- TABLE 9 Global market by product, 2028 - 2032 (USD Million)
- TABLE 10 Global market by application, 2019 - 2022 ('000 Units)
- TABLE 11 Global market by application, 2023 - 2027 ('000 Units)
- TABLE 12 Global market by application, 2028 - 2032 ('000 Units)
- TABLE 13 Global market by application, 2019 - 2022 (USD Million)
- TABLE 14 Global market by application, 2023 - 2027 (USD Million)
- TABLE 15 Global market by application, 2028 - 2032 (USD Million)
- TABLE 16 Global market by region, 2019 - 2022 ('000 Units)
- TABLE 17 Global market by region, 2023 - 2027 ('000 Units)
- TABLE 18 Global market by region, 2028 - 2032 ('000 Units)
- TABLE 19 Global market by region, 2019 - 2022 (USD Million)
- TABLE 20 Global market by region, 2023 - 2027 (USD Million)
- TABLE 21 Global market by region, 2028 - 2032 (USD Million)
- TABLE 22 Industry impact forces
- TABLE 23 Global market from air source, 2019 - 2022 (Volume & Revenue)
- TABLE 24 Global market from air source, 2023 - 2027 (Volume & Revenue)
- TABLE 25 Global market from air source, 2028 - 2032 (Volume & Revenue)
- TABLE 26 Global market from air source, by region, 2019 - 2022 ('000 Units)
- TABLE 27 Global market from air source, by region, 2023 - 2027 ('000 Units)
- TABLE 28 Global market from air source, by region, 2028 - 2032 ('000 Units)
- TABLE 29 Global market from air source, by region, 2019 - 2022 (USD Million)
- TABLE 30 Global market from air source, by region, 2023 - 2027 (USD Million)
- TABLE 31 Global market from air source, by region, 2028 - 2032 (USD Million)
- TABLE 32 Global market from ground source, 2019 - 2022 (Volume & Revenue)
- TABLE 33 Global market from ground source, 2023 - 2027 (Volume & Revenue)
- TABLE 34 Global market from ground source, 2028 - 2032 (Volume & Revenue)
- TABLE 35 Global market from ground source, by region, 2019 - 2022 ('000 Units)
- TABLE 36 Global market from ground source, by region, 2023 - 2027 ('000 Units)
- TABLE 37 Global market from ground source, by region, 2028 - 2032 ('000 Units)
- TABLE 38 Global market from ground source, by region, 2019 - 2022 (USD Million)
- TABLE 39 Global market from ground source, by region, 2023 - 2027 (USD Million)
- TABLE 40 Global market from ground source, by region, 2028 - 2032 (USD Million)
- TABLE 41 Global market from water source, 2019 - 2022 (Volume & Revenue)
- TABLE 42 Global market from water source, 2023 - 2027 (Volume & Revenue)
- TABLE 43 Global market from water source, 2028 - 2032 (Volume & Revenue)
- TABLE 44 Global market from water source, by region, 2019 - 2022 ('000 Units)
- TABLE 45 Global market from water source, by region, 2023 - 2027 ('000 Units)
- TABLE 46 Global market from water source, by region, 2028 - 2032 ('000 Units)
- TABLE 47 Global market from water source, by region, 2019 - 2022 (USD Million)
- TABLE 48 Global market from water source, by region, 2023 - 2027 (USD Million)
- TABLE 49 Global market from water source, by region, 2028 - 2032 (USD Million)
- TABLE 50 Global market from single family, 2019 - 2022 (Volume & Revenue)
- TABLE 51 Global market from single family, 2023 - 2027 (Volume & Revenue)
- TABLE 52 Global market from single family, 2028 - 2032 (Volume & Revenue)
- TABLE 53 Global market from single family, by region, 2019 - 2022 ('000 Units)
- TABLE 54 Global market from single family, by region, 2023 - 2027 ('000 Units)
- TABLE 55 Global market from single family, by region, 2028 - 2032 ('000 Units)
- TABLE 56 Global market from single family, by region, 2019 - 2022 (USD Million)
- TABLE 57 Global market from single family, by region, 2023 - 2027 (USD Million)
- TABLE 58 Global market from single family, by region, 2028 - 2032 (USD Million)
- TABLE 59 Global market from multi family, 2019 - 2022 (Volume & Revenue)
- TABLE 60 Global market from multi family, 2023 - 2027 (Volume & Revenue)
- TABLE 61 Global market from multi family, 2028 - 2032 (Volume & Revenue)
- TABLE 62 Global market from multi family, by region, 2019 - 2022 ('000 Units)
- TABLE 63 Global market from multi family, by region, 2023 - 2027 ('000 Units)
- TABLE 64 Global market from multi family, by region, 2028 - 2032 ('000 Units)
- TABLE 65 Global market from multi family, by region, 2019 - 2022 (USD Million)
- TABLE 66 Global market from multi family, by region, 2023 - 2027 (USD Million)
- TABLE 67 Global market from multi family, by region, 2028 - 2032 (USD Million)
- TABLE 68 North America market, 2019 - 2022 (Volume & Revenue)
- TABLE 69 North America market, 2023 - 2027 (Volume & Revenue)
- TABLE 70 North America market, 2028 - 2032 (Volume & Revenue)
- TABLE 71 North America market by product, 2019 - 2022 ('000 Units)
- TABLE 72 North America market by product, 2023 - 2027 ('000 Units)
- TABLE 73 North America market by product, 2028 - 2032 ('000 Units)
- TABLE 74 North America market by product, 2019 - 2022 (USD Million)
- TABLE 75 North America market by product, 2023 - 2027 (USD Million)
- TABLE 76 North America market by product, 2028 - 2032 (USD Million)
- TABLE 77 North America market by application, 2019 - 2022 ('000 Units)
- TABLE 78 North America market by application, 2023 - 2027 ('000 Units)
- TABLE 79 North America market by application, 2028 - 2032 ('000 Units)
- TABLE 80 North America market by application, 2019 - 2022 (USD Million)
- TABLE 81 North America market by application, 2023 - 2027 (USD Million)
- TABLE 82 North America market by application, 2028 - 2032 (USD Million)
- TABLE 83 U.S. market, 2019 - 2022 (Volume & Revenue)
- TABLE 84 U.S. market, 2023 - 2027 (Volume & Revenue)
- TABLE 85 U.S. market, 2028 - 2032 (Volume & Revenue)
- TABLE 86 U.S. market by product, 2019 - 2022 ('000 Units)
- TABLE 87 U.S. market by product, 2023 - 2027 ('000 Units)
- TABLE 88 U.S. market by product, 2028 - 2032 ('000 Units)
- TABLE 89 U.S. market by product, 2019 - 2022 (USD Million)
- TABLE 90 U.S. market by product, 2023 - 2027 (USD Million)
- TABLE 91 U.S. market by product, 2028 - 2032 (USD Million)
- TABLE 92 U.S. market by application, 2019 - 2022 ('000 Units)
- TABLE 93 U.S. market by application, 2023 - 2027 ('000 Units)
- TABLE 94 U.S. market by application, 2028 - 2032 ('000 Units)
- TABLE 95 U.S. market by application, 2019 - 2022 (USD Million)
- TABLE 96 U.S. market by application, 2023 - 2027 (USD Million)
- TABLE 97 U.S. market by application, 2028 - 2032 (USD Million)
- TABLE 98 Canada market, 2019 - 2022 (Volume & Revenue)
- TABLE 99 Canada market, 2023 - 2027 (Volume & Revenue)
- TABLE 100 Canada market, 2028 - 2032 (Volume & Revenue)
- TABLE 101 Canada market by product, 2019 - 2022 ('000 Units)
- TABLE 102 Canada market by product, 2023 - 2027 ('000 Units)
- TABLE 103 Canada market by product, 2028 - 2032 ('000 Units)
- TABLE 104 Canada market by product, 2019 - 2022 (USD Million)
- TABLE 105 Canada market by product, 2023 - 2027 (USD Million)
- TABLE 106 Canada market by product, 2028 - 2032 (USD Million)
- TABLE 107 Canada market by application, 2019 - 2022 ('000 Units)
- TABLE 108 Canada market by application, 2023 - 2027 ('000 Units)
- TABLE 109 Canada market by application, 2028 - 2032 ('000 Units)
- TABLE 110 Canada market by application, 2019 - 2022 (USD Million)
- TABLE 111 Canada market by application, 2023 - 2027 (USD Million)
- TABLE 112 Canada market by application, 2028 - 2032 (USD Million)
- TABLE 113 Europe market, 2019 - 2022 (Volume & Revenue)
- TABLE 114 Europe market, 2023 - 2027 (Volume & Revenue)
- TABLE 115 Europe market, 2028 - 2032 (Volume & Revenue)
- TABLE 116 Europe market by product, 2019 - 2022 ('000 Units)
- TABLE 117 Europe market by product, 2023 - 2027 ('000 Units)
- TABLE 118 Europe market by product, 2028 - 2032 ('000 Units)
- TABLE 119 Europe market by product, 2019 - 2022 (USD Million)
- TABLE 120 Europe market by product, 2023 - 2027 (USD Million)
- TABLE 121 Europe market by product, 2028 - 2032 (USD Million)
- TABLE 122 Europe market by application, 2019 - 2022 ('000 Units)
- TABLE 123 Europe market by application, 2023 - 2027 ('000 Units)
- TABLE 124 Europe market by application, 2028 - 2032 ('000 Units)
- TABLE 125 Europe market by application, 2019 - 2022 (USD Million)
- TABLE 126 Europe market by application, 2023 - 2027 (USD Million)
- TABLE 127 Europe market by application, 2028 - 2032 (USD Million)
- TABLE 128 Austria market, 2019 - 2022 (Volume & Revenue)
- TABLE 129 Austria market, 2023 - 2027 (Volume & Revenue)
- TABLE 130 Austria market, 2028 - 2032 (Volume & Revenue)
- TABLE 131 Austria market by product, 2019 - 2022 ('000 Units)
- TABLE 132 Austria market by product, 2023 - 2027 ('000 Units)
- TABLE 133 Austria market by product, 2028 - 2032 ('000 Units)
- TABLE 134 Austria market by product, 2019 - 2022 (USD Million)
- TABLE 135 Austria market by product, 2023 - 2027 (USD Million)
- TABLE 136 Austria market by product, 2028 - 2032 (USD Million)
- TABLE 137 Austria market by application, 2019 - 2022 ('000 Units)
- TABLE 138 Austria market by application, 2023 - 2027 ('000 Units)
- TABLE 139 Austria market by application, 2028 - 2032 ('000 Units)
- TABLE 140 Austria market by application, 2019 - 2022 (USD Million)
- TABLE 141 Austria market by application, 2023 - 2027 (USD Million)
- TABLE 142 Austria market by application, 2028 - 2032 (USD Million)
- TABLE 143 Norway market, 2019 - 2022 (Volume & Revenue)
- TABLE 144 Norway market, 2023 - 2027 (Volume & Revenue)
- TABLE 145 Norway market, 2028 - 2032 (Volume & Revenue)
- TABLE 146 Norway market by product, 2019 - 2022 ('000 Units)
- TABLE 147 Norway market by product, 2023 - 2027 ('000 Units)
- TABLE 148 Norway market by product, 2028 - 2032 ('000 Units)
- TABLE 149 Norway market by product, 2019 - 2022 (USD Million)
- TABLE 150 Norway market by product, 2023 - 2027 (USD Million)
- TABLE 151 Norway market by product, 2028 - 2032 (USD Million)
- TABLE 152 Norway market by application, 2019 - 2022 ('000 Units)
- TABLE 153 Norway market by application, 2023 - 2027 ('000 Units)
- TABLE 154 Norway market by application, 2028 - 2032 ('000 Units)
- TABLE 155 Norway market by application, 2019 - 2022 (USD Million)
- TABLE 156 Norway market by application, 2023 - 2027 (USD Million)
- TABLE 157 Norway market by application, 2028 - 2032 (USD Million)
- TABLE 158 Denmark market, 2019 - 2022 (Volume & Revenue)
- TABLE 159 Denmark market, 2023 - 2027 (Volume & Revenue)
- TABLE 160 Denmark market, 2028 - 2032 (Volume & Revenue)
- TABLE 161 Denmark market by product, 2019 - 2022 ('000 Units)
- TABLE 162 Denmark market by product, 2023 - 2027 ('000 Units)
- TABLE 163 Denmark market by product, 2028 - 2032 ('000 Units)
- TABLE 164 Denmark market by product, 2019 - 2022 (USD Million)
- TABLE 165 Denmark market by product, 2023 - 2027 (USD Million)
- TABLE 166 Denmark market by product, 2028 - 2032 (USD Million)
- TABLE 167 Denmark market by application, 2019 - 2022 ('000 Units)
- TABLE 168 Denmark market by application, 2023 - 2027 ('000 Units)
- TABLE 169 Denmark market by application, 2028 - 2032 ('000 Units)
- TABLE 170 Denmark market by application, 2019 - 2022 (USD Million)
- TABLE 171 Denmark market by application, 2023 - 2027 (USD Million)
- TABLE 172 Denmark market by application, 2028 - 2032 (USD Million)
- TABLE 173 Finland market, 2019 - 2022 (Volume & Revenue)
- TABLE 174 Finland market, 2023 - 2027 (Volume & Revenue)
- TABLE 175 Finland market, 2028 - 2032 (Volume & Revenue)
- TABLE 176 Finland market by product, 2019 - 2022 ('000 Units)
- TABLE 177 Finland market by product, 2023 - 2027 ('000 Units)
- TABLE 178 Finland market by product, 2028 - 2032 ('000 Units)
- TABLE 179 Finland market by product, 2019 - 2022 (USD Million)
- TABLE 180 Finland market by product, 2023 - 2027 (USD Million)
- TABLE 181 Finland market by product, 2028 - 2032 (USD Million)
- TABLE 182 Finland market by application, 2019 - 2022 ('000 Units)
- TABLE 183 Finland market by application, 2023 - 2027 ('000 Units)
- TABLE 184 Finland market by application, 2028 - 2032 ('000 Units)
- TABLE 185 Finland market by application, 2019 - 2022 (USD Million)
- TABLE 186 Finland market by application, 2023 - 2027 (USD Million)
- TABLE 187 Finland market by application, 2028 - 2032 (USD Million)
- TABLE 188 France market, 2019 - 2022 (Volume & Revenue)
- TABLE 189 France market, 2023 - 2027 (Volume & Revenue)
- TABLE 190 France market, 2028 - 2032 (Volume & Revenue)
- TABLE 191 France market by product, 2019 - 2022 ('000 Units)
- TABLE 192 France market by product, 2023 - 2027 ('000 Units)
- TABLE 193 France market by product, 2028 - 2032 ('000 Units)
- TABLE 194 France market by product, 2019 - 2022 (USD Million)
- TABLE 195 France market by product, 2023 - 2027 (USD Million)
- TABLE 196 France market by product, 2028 - 2032 (USD Million)
- TABLE 197 France market by application, 2019 - 2022 ('000 Units)
- TABLE 198 France market by application, 2023 - 2027 ('000 Units)
- TABLE 199 France market by application, 2028 - 2032 ('000 Units)
- TABLE 200 France market by application, 2019 - 2022 (USD Million)
- TABLE 201 France market by application, 2023 - 2027 (USD Million)
- TABLE 202 France market by application, 2028 - 2032 (USD Million)
- TABLE 203 Germany market, 2019 - 2022 (Volume & Revenue)
- TABLE 204 Germany market, 2023 - 2027 (Volume & Revenue)
- TABLE 205 Germany market, 2028 - 2032 (Volume & Revenue)
- TABLE 206 Germany market by product, 2019 - 2022 ('000 Units)
- TABLE 207 Germany market by product, 2023 - 2027 ('000 Units)
- TABLE 208 Germany market by product, 2028 - 2032 ('000 Units)
- TABLE 209 Germany market by product, 2019 - 2022 (USD Million)
- TABLE 210 Germany market by product, 2023 - 2027 (USD Million)
- TABLE 211 Germany market by product, 2028 - 2032 (USD Million)
- TABLE 212 Germany market by application, 2019 - 2022 ('000 Units)
- TABLE 213 Germany market by application, 2023 - 2027 ('000 Units)
- TABLE 214 Germany market by application, 2028 - 2032 ('000 Units)
- TABLE 215 Germany market by application, 2019 - 2022 (USD Million)
- TABLE 216 Germany market by application, 2023 - 2027 (USD Million)
- TABLE 217 Germany market by application, 2028 - 2032 (USD Million)
- TABLE 218 Italy market, 2019 - 2022 (Volume & Revenue)
- TABLE 219 Italy market, 2023 - 2027 (Volume & Revenue)
- TABLE 220 Italy market, 2028 - 2032 (Volume & Revenue)
- TABLE 221 Italy market by product, 2019 - 2022 ('000 Units)
- TABLE 222 Italy market by product, 2023 - 2027 ('000 Units)
- TABLE 223 Italy market by product, 2028 - 2032 ('000 Units)
- TABLE 224 Italy market by product, 2019 - 2022 (USD Million)
- TABLE 225 Italy market by product, 2023 - 2027 (USD Million)
- TABLE 226 Italy market by product, 2028 - 2032 (USD Million)
- TABLE 227 Italy market by application, 2019 - 2022 ('000 Units)
- TABLE 228 Italy market by application, 2023 - 2027 ('000 Units)
- TABLE 229 Italy market by application, 2028 - 2032 ('000 Units)
- TABLE 230 Italy market by application, 2019 - 2022 (USD Million)
- TABLE 231 Italy market by application, 2023 - 2027 (USD Million)
- TABLE 232 Italy market by application, 2028 - 2032 (USD Million)
- TABLE 233 Switzerland market, 2019 - 2022 (Volume & Revenue)
- TABLE 234 Switzerland market, 2023 - 2027 (Volume & Revenue)
- TABLE 235 Switzerland market, 2028 - 2032 (Volume & Revenue)
- TABLE 236 Switzerland market by product, 2019 - 2022 ('000 Units)
- TABLE 237 Switzerland market by product, 2023 - 2027 ('000 Units)
- TABLE 238 Switzerland market by product, 2028 - 2032 ('000 Units)
- TABLE 239 Switzerland market by product, 2019 - 2022 (USD Million)
- TABLE 240 Switzerland market by product, 2023 - 2027 (USD Million)
- TABLE 241 Switzerland market by product, 2028 - 2032 (USD Million)
- TABLE 242 Switzerland market by application, 2019 - 2022 ('000 Units)
- TABLE 243 Switzerland market by application, 2023 - 2027 ('000 Units)
- TABLE 244 Switzerland market by application, 2028 - 2032 ('000 Units)
- TABLE 245 Switzerland market by application, 2019 - 2022 (USD Million)
- TABLE 246 Switzerland market by application, 2023 - 2027 (USD Million)
- TABLE 247 Switzerland market by application, 2028 - 2032 (USD Million)
- TABLE 248 Spain market, 2019 - 2022 (Volume & Revenue)
- TABLE 249 Spain market, 2023 - 2027 (Volume & Revenue)
- TABLE 250 Spain market, 2028 - 2032 (Volume & Revenue)
- TABLE 251 Spain market by product, 2019 - 2022 ('000 Units)
- TABLE 252 Spain market by product, 2023 - 2027 ('000 Units)
- TABLE 253 Spain market by product, 2028 - 2032 ('000 Units)
- TABLE 254 Spain market by product, 2019 - 2022 (USD Million)
- TABLE 255 Spain market by product, 2023 - 2027 (USD Million)
- TABLE 256 Spain market by product, 2028 - 2032 (USD Million)
- TABLE 257 Spain market by application, 2019 - 2022 ('000 Units)
- TABLE 258 Spain market by application, 2023 - 2027 ('000 Units)
- TABLE 259 Spain market by application, 2028 - 2032 ('000 Units)
- TABLE 260 Spain market by application, 2019 - 2022 (USD Million)
- TABLE 261 Spain market by application, 2023 - 2027 (USD Million)
- TABLE 262 Spain market by application, 2028 - 2032 (USD Million)
- TABLE 263 Sweden market, 2019 - 2022 (Volume & Revenue)
- TABLE 264 Sweden market, 2023 - 2027 (Volume & Revenue)
- TABLE 265 Sweden market, 2028 - 2032 (Volume & Revenue)
- TABLE 266 Sweden market by product, 2019 - 2022 ('000 Units)
- TABLE 267 Sweden market by product, 2023 - 2027 ('000 Units)
- TABLE 268 Sweden market by product, 2028 - 2032 ('000 Units)
- TABLE 269 Sweden market by product, 2019 - 2022 (USD Million)
- TABLE 270 Sweden market by product, 2023 - 2027 (USD Million)
- TABLE 271 Sweden market by product, 2028 - 2032 (USD Million)
- TABLE 272 Sweden market by application, 2019 - 2022 ('000 Units)
- TABLE 273 Sweden market by application, 2023 - 2027 ('000 Units)
- TABLE 274 Sweden market by application, 2028 - 2032 ('000 Units)
- TABLE 275 Sweden market by application, 2019 - 2022 (USD Million)
- TABLE 276 Sweden market by application, 2023 - 2027 (USD Million)
- TABLE 277 Sweden market by application, 2028 - 2032 (USD Million)
- TABLE 278 UK market, 2019 - 2022 (Volume & Revenue)
- TABLE 279 UK market, 2023 - 2027 (Volume & Revenue)
- TABLE 280 UK market, 2028 - 2032 (Volume & Revenue)
- TABLE 281 UK market by product, 2019 - 2022 ('000 Units)
- TABLE 282 UK market by product, 2023 - 2027 ('000 Units)
- TABLE 283 UK market by product, 2028 - 2032 ('000 Units)
- TABLE 284 UK market by product, 2019 - 2022 (USD Million)
- TABLE 285 UK market by product, 2023 - 2027 (USD Million)
- TABLE 286 UK market by product, 2028 - 2032 (USD Million)
- TABLE 287 UK market by application, 2019 - 2022 ('000 Units)
- TABLE 288 UK market by application, 2023 - 2027 ('000 Units)
- TABLE 289 UK market by application, 2028 - 2032 ('000 Units)
- TABLE 290 UK market by application, 2019 - 2022 (USD Million)
- TABLE 291 UK market by application, 2023 - 2027 (USD Million)
- TABLE 292 UK market by application, 2028 - 2032 (USD Million)
- TABLE 293 Netherlands market, 2019 - 2022 (Volume & Revenue)
- TABLE 294 Netherlands market, 2023 - 2027 (Volume & Revenue)
- TABLE 295 Netherlands market, 2028 - 2032 (Volume & Revenue)
- TABLE 296 Netherlands market by product, 2019 - 2022 ('000 Units)
- TABLE 297 Netherlands market by product, 2023 - 2027 ('000 Units)
- TABLE 298 Netherlands market by product, 2028 - 2032 ('000 Units)
- TABLE 299 Netherlands market by product, 2019 - 2022 (USD Million)
- TABLE 300 Netherlands market by product, 2023 - 2027 (USD Million)
- TABLE 301 Netherlands market by product, 2028 - 2032 (USD Million)
- TABLE 302 Netherlands market by application, 2019 - 2022 ('000 Units)
- TABLE 303 Netherlands market by application, 2023 - 2027 ('000 Units)
- TABLE 304 Netherlands market by application, 2028 - 2032 ('000 Units)
- TABLE 305 Netherlands market by application, 2019 - 2022 (USD Million)
- TABLE 306 Netherlands market by application, 2023 - 2027 (USD Million)
- TABLE 307 Netherlands market by application, 2028 - 2032 (USD Million)
- TABLE 308 Asia Pacific market, 2019 - 2022 (Volume & Revenue)
- TABLE 309 Asia Pacific market, 2023 - 2027 (Volume & Revenue)
- TABLE 310 Asia Pacific market, 2028 - 2032 (Volume & Revenue)
- TABLE 311 Asia Pacific market by product, 2019 - 2022 ('000 Units)
- TABLE 312 Asia Pacific market by product, 2023 - 2027 ('000 Units)
- TABLE 313 Asia Pacific market by product, 2028 - 2032 ('000 Units)
- TABLE 314 Asia Pacific market by product, 2019 - 2022 (USD Million)
- TABLE 315 Asia Pacific market by product, 2023 - 2027 (USD Million)
- TABLE 316 Asia Pacific market by product, 2028 - 2032 (USD Million)
- TABLE 317 Asia Pacific market by application, 2019 - 2022 ('000 Units)
- TABLE 318 Asia Pacific market by application, 2023 - 2027 ('000 Units)
- TABLE 319 Asia Pacific market by application, 2028 - 2032 ('000 Units)
- TABLE 320 Asia Pacific market by application, 2019 - 2022 (USD Million)
- TABLE 321 Asia Pacific market by application, 2023 - 2027 (USD Million)
- TABLE 322 Asia Pacific market by application, 2028 - 2032 (USD Million)
- TABLE 323 China market, 2019 - 2022 (Volume & Revenue)
- TABLE 324 China market, 2023 - 2027 (Volume & Revenue)
- TABLE 325 China market, 2028 - 2032 (Volume & Revenue)
- TABLE 326 China market by product, 2019 - 2022 ('000 Units)
- TABLE 327 China market by product, 2023 - 2027 ('000 Units)
- TABLE 328 China market by product, 2028 - 2032 ('000 Units)
- TABLE 329 China market by product, 2019 - 2022 (USD Million)
- TABLE 330 China market by product, 2023 - 2027 (USD Million)
- TABLE 331 China market by product, 2028 - 2032 (USD Million)
- TABLE 332 China market by application, 2019 - 2022 ('000 Units)
- TABLE 333 China market by application, 2023 - 2027 ('000 Units)
- TABLE 334 China market by application, 2028 - 2032 ('000 Units)
- TABLE 335 China market by application, 2019 - 2022 (USD Million)
- TABLE 336 China market by application, 2023 - 2027 (USD Million)
- TABLE 337 China market by application, 2028 - 2032 (USD Million)
- TABLE 338 Japan market, 2019 - 2022 (Volume & Revenue)
- TABLE 339 Japan market, 2023 - 2027 (Volume & Revenue)
- TABLE 340 Japan market, 2028 - 2032 (Volume & Revenue)
- TABLE 341 Japan market by product, 2019 - 2022 ('000 Units)
- TABLE 342 Japan market by product, 2023 - 2027 ('000 Units)
- TABLE 343 Japan market by product, 2028 - 2032 ('000 Units)
- TABLE 344 Japan market by product, 2019 - 2022 (USD Million)
- TABLE 345 Japan market by product, 2023 - 2027 (USD Million)
- TABLE 346 Japan market by product, 2028 - 2032 (USD Million)
- TABLE 347 Japan market by application, 2019 - 2022 ('000 Units)
- TABLE 348 Japan market by application, 2023 - 2027 ('000 Units)
- TABLE 349 Japan market by application, 2028 - 2032 ('000 Units)
- TABLE 350 Japan market by application, 2019 - 2022 (USD Million)
- TABLE 351 Japan market by application, 2023 - 2027 (USD Million)
- TABLE 352 Japan market by application, 2028 - 2032 (USD Million)
- TABLE 353 Australia market, 2019 - 2022 (Volume & Revenue)
- TABLE 354 Australia market, 2023 - 2027 (Volume & Revenue)
- TABLE 355 Australia market, 2028 - 2032 (Volume & Revenue)
- TABLE 356 Australia market by product, 2019 - 2022 ('000 Units)
- TABLE 357 Australia market by product, 2023 - 2027 ('000 Units)
- TABLE 358 Australia market by product, 2028 - 2032 ('000 Units)
- TABLE 359 Australia market by product, 2019 - 2022 (USD Million)
- TABLE 360 Australia market by product, 2023 - 2027 (USD Million)
- TABLE 361 Australia market by product, 2028 - 2032 (USD Million)
- TABLE 362 Australia market by application, 2019 - 2022 ('000 Units)
- TABLE 363 Australia market by application, 2023 - 2027 ('000 Units)
- TABLE 364 Australia market by application, 2028 - 2032 ('000 Units)
- TABLE 365 Australia market by application, 2019 - 2022 (USD Million)
- TABLE 366 Australia market by application, 2023 - 2027 (USD Million)
- TABLE 367 Australia market by application, 2028 - 2032 (USD Million)
- TABLE 368 South Korea market, 2019 - 2022 (Volume & Revenue)
- TABLE 369 South Korea market, 2023 - 2027 (Volume & Revenue)
- TABLE 370 South Korea market, 2028 - 2032 (Volume & Revenue)
- TABLE 371 South Korea market by product, 2019 - 2022 ('000 Units)
- TABLE 372 South Korea market by product, 2023 - 2027 ('000 Units)
- TABLE 373 South Korea market by product, 2028 - 2032 ('000 Units)
- TABLE 374 South Korea market by product, 2019 - 2022 (USD Million)
- TABLE 375 South Korea market by product, 2023 - 2027 (USD Million)
- TABLE 376 South Korea market by product, 2028 - 2032 (USD Million)
- TABLE 377 South Korea market by application, 2019 - 2022 ('000 Units)
- TABLE 378 South Korea market by application, 2023 - 2027 ('000 Units)
- TABLE 379 South Korea market by application, 2028 - 2032 ('000 Units)
- TABLE 380 South Korea market by application, 2019 - 2022 (USD Million)
- TABLE 381 South Korea market by application, 2023 - 2027 (USD Million)
- TABLE 382 South Korea market by application, 2028 - 2032 (USD Million)
- TABLE 383 Middle East & Africa market, 2019 - 2022 (Volume & Revenue)
- TABLE 384 Middle East & Africa market, 2023 - 2027 (Volume & Revenue)
- TABLE 385 Middle East & Africa market, 2028 - 2032 (Volume & Revenue)
- TABLE 386 Middle East & Africa market by product, 2019 - 2022 ('000 Units)
- TABLE 387 Middle East & Africa market by product, 2023 - 2027 ('000 Units)
- TABLE 388 Middle East & Africa market by product, 2028 - 2032 ('000 Units)
- TABLE 389 Middle East & Africa market by product, 2019 - 2022 (USD Million)
- TABLE 390 Middle East & Africa market by product, 2023 - 2027 (USD Million)
- TABLE 391 Middle East & Africa market by product, 2028 - 2032 (USD Million)
- TABLE 392 Middle East & Africa market by application, 2019 - 2022 ('000 Units)
- TABLE 393 Middle East & Africa market by application, 2023 - 2027 ('000 Units)
- TABLE 394 Middle East & Africa market by application, 2028 - 2032 ('000 Units)
- TABLE 395 Middle East & Africa market by application, 2019 - 2022 (USD Million)
- TABLE 396 Middle East & Africa market by application, 2023 - 2027 (USD Million)
- TABLE 397 Middle East & Africa market by application, 2028 - 2032 (USD Million)
- TABLE 398 Saudi Arabia market, 2019 - 2022 (Volume & Revenue)
- TABLE 399 Saudi Arabia market, 2023 - 2027 (Volume & Revenue)
- TABLE 400 Saudi Arabia market, 2028 - 2032 (Volume & Revenue)
- TABLE 401 Saudi Arabia market by product, 2019 - 2022 ('000 Units)
- TABLE 402 Saudi Arabia market by product, 2023 - 2027 ('000 Units)
- TABLE 403 Saudi Arabia market by product, 2028 - 2032 ('000 Units)
- TABLE 404 Saudi Arabia market by product, 2019 - 2022 (USD Million)
- TABLE 405 Saudi Arabia market by product, 2023 - 2027 (USD Million)
- TABLE 406 Saudi Arabia market by product, 2028 - 2032 (USD Million)
- TABLE 407 Saudi Arabia market by application, 2019 - 2022 ('000 Units)
- TABLE 408 Saudi Arabia market by application, 2023 - 2027 ('000 Units)
- TABLE 409 Saudi Arabia market by application, 2028 - 2032 ('000 Units)
- TABLE 410 Saudi Arabia market by application, 2019 - 2022 (USD Million)
- TABLE 411 Saudi Arabia market by application, 2023 - 2027 (USD Million)
- TABLE 412 Saudi Arabia market by application, 2028 - 2032 (USD Million)
- TABLE 413 Turkey market, 2019 - 2022 (Volume & Revenue)
- TABLE 414 Turkey market, 2023 - 2027 (Volume & Revenue)
- TABLE 415 Turkey market, 2028 - 2032 (Volume & Revenue)
- TABLE 416 Turkey market by product, 2019 - 2022 ('000 Units)
- TABLE 417 Turkey market by product, 2023 - 2027 ('000 Units)
- TABLE 418 Turkey market by product, 2028 - 2032 ('000 Units)
- TABLE 419 Turkey market by product, 2019 - 2022 (USD Million)
- TABLE 420 Turkey market by product, 2023 - 2027 (USD Million)
- TABLE 421 Turkey market by product, 2028 - 2032 (USD Million)
- TABLE 422 Turkey market by application, 2019 - 2022 ('000 Units)
- TABLE 423 Turkey market by application, 2023 - 2027 ('000 Units)
- TABLE 424 Turkey market by application, 2028 - 2032 ('000 Units)
- TABLE 425 Turkey market by application, 2019 - 2022 (USD Million)
- TABLE 426 Turkey market by application, 2023 - 2027 (USD Million)
- TABLE 427 Turkey market by application, 2028 - 2032 (USD Million)
- TABLE 428 South Africa market, 2019 - 2022 (Volume & Revenue)
- TABLE 429 South Africa market, 2023 - 2027 (Volume & Revenue)
- TABLE 430 South Africa market, 2028 - 2032 (Volume & Revenue)
- TABLE 431 South Africa market by product, 2019 - 2022 ('000 Units)
- TABLE 432 South Africa market by product, 2023 - 2027 ('000 Units)
- TABLE 433 South Africa market by product, 2028 - 2032 ('000 Units)
- TABLE 434 South Africa market by product, 2019 - 2022 (USD Million)
- TABLE 435 South Africa market by product, 2023 - 2027 (USD Million)
- TABLE 436 South Africa market by product, 2028 - 2032 (USD Million)
- TABLE 437 South Africa market by application, 2019 - 2022 ('000 Units)
- TABLE 438 South Africa market by application, 2023 - 2027 ('000 Units)
- TABLE 439 South Africa market by application, 2028 - 2032 ('000 Units)
- TABLE 440 South Africa market by application, 2019 - 2022 (USD Million)
- TABLE 441 South Africa market by application, 2023 - 2027 (USD Million)
- TABLE 442 South Africa market by application, 2028 - 2032 (USD Million)
- TABLE 443 Latin America market, 2019 - 2022 (Volume & Revenue)
- TABLE 444 Latin America market, 2023 - 2027 (Volume & Revenue)
- TABLE 445 Latin America market, 2028 - 2032 (Volume & Revenue)
- TABLE 446 Latin America market by product, 2019 - 2022 ('000 Units)
- TABLE 447 Latin America market by product, 2023 - 2027 ('000 Units)
- TABLE 448 Latin America market by product, 2028 - 2032 ('000 Units)
- TABLE 449 Latin America market by product, 2019 - 2022 (USD Million)
- TABLE 450 Latin America market by product, 2023 - 2027 (USD Million)
- TABLE 451 Latin America market by product, 2028 - 2032 (USD Million)
- TABLE 452 Latin America market by application, 2019 - 2022 ('000 Units)
- TABLE 453 Latin America market by application, 2023 - 2027 ('000 Units)
- TABLE 454 Latin America market by application, 2028 - 2032 ('000 Units)
- TABLE 455 Latin America market by application, 2019 - 2022 (USD Million)
- TABLE 456 Latin America market by application, 2023 - 2027 (USD Million)
- TABLE 457 Latin America market by application, 2028 - 2032 (USD Million)
- TABLE 458 Brazil market, 2019 - 2022 (Volume & Revenue)
- TABLE 459 Brazil market, 2023 - 2027 (Volume & Revenue)
- TABLE 460 Brazil market, 2028 - 2032 (Volume & Revenue)
- TABLE 461 Brazil market by product, 2019 - 2022 ('000 Units)
- TABLE 462 Brazil market by product, 2023 - 2027 ('000 Units)
- TABLE 463 Brazil market by product, 2028 - 2032 ('000 Units)
- TABLE 464 Brazil market by product, 2019 - 2022 (USD Million)
- TABLE 465 Brazil market by product, 2023 - 2027 (USD Million)
- TABLE 466 Brazil market by product, 2028 - 2032 (USD Million)
- TABLE 467 Brazil market by application, 2019 - 2022 ('000 Units)
- TABLE 468 Brazil market by application, 2023 - 2027 ('000 Units)
- TABLE 469 Brazil market by application, 2028 - 2032 ('000 Units)
- TABLE 470 Brazil market by application, 2019 - 2022 (USD Million)
- TABLE 471 Brazil market by application, 2023 - 2027 (USD Million)
- TABLE 472 Brazil market by application, 2028 - 2032 (USD Million)
- TABLE 473 Mexico market, 2019 - 2022 (Volume & Revenue)
- TABLE 474 Mexico market, 2023 - 2027 (Volume & Revenue)
- TABLE 475 Mexico market, 2028 - 2032 (Volume & Revenue)
- TABLE 476 Mexico market by product, 2019 - 2022 ('000 Units)
- TABLE 477 Mexico market by product, 2023 - 2027 ('000 Units)
- TABLE 478 Mexico market by product, 2028 - 2032 ('000 Units)
- TABLE 479 Mexico market by product, 2019 - 2022 (USD Million)
- TABLE 480 Mexico market by product, 2023 - 2027 (USD Million)
- TABLE 481 Mexico market by product, 2028 - 2032 (USD Million)
- TABLE 482 Mexico market by application, 2019 - 2022 ('000 Units)
- TABLE 483 Mexico market by application, 2023 - 2027 ('000 Units)
- TABLE 484 Mexico market by application, 2028 - 2032 ('000 Units)
- TABLE 485 Mexico market by application, 2019 - 2022 (USD Million)
- TABLE 486 Mexico market by application, 2023 - 2027 (USD Million)
- TABLE 487 Mexico market by application, 2028 - 2032 (USD Million)
- TABLE 488 Argentina market, 2019 - 2022 (Volume & Revenue)
- TABLE 489 Argentina market, 2023 - 2027 (Volume & Revenue)
- TABLE 490 Argentina market, 2028 - 2032 (Volume & Revenue)
- TABLE 491 Argentina market by product, 2019 - 2022 ('000 Units)
- TABLE 492 Argentina market by product, 2023 - 2027 ('000 Units)
- TABLE 493 Argentina market by product, 2028 - 2032 ('000 Units)
- TABLE 494 Argentina market by product, 2019 - 2022 (USD Million)
- TABLE 495 Argentina market by product, 2023 - 2027 (USD Million)
- TABLE 496 Argentina market by product, 2028 - 2032 (USD Million)
- TABLE 497 Argentina market by application, 2019 - 2022 ('000 Units)
- TABLE 498 Argentina market by application, 2023 - 2027 ('000 Units)
- TABLE 499 Argentina market by application, 2028 - 2032 ('000 Units)
- TABLE 500 Argentina market by application, 2019 - 2022 (USD Million)
- TABLE 501 Argentina market by application, 2023 - 2027 (USD Million)
- TABLE 502 Argentina market by application, 2028 - 2032 (USD Million)
Charts & Figures
- FIG. 1 GMI report coverage: critical research elements
- FIG. 2 Industry segmentation
- FIG. 3 Market forecasting methodology
- FIG. 4 Profile break-up of primary respondents
- FIG. 5 Residential heat pump industry 360 degree synopsis, 2019 - 2032
- FIG. 6 Industry ecosystem analysis
- FIG. 7 Overall view of COVID- 19 effect, 2019 - 2032 (USD Million)
- FIG. 8 Growth potential analysis
- FIG. 9 Porter's Analysis
- FIG. 10 PESTEL Analysis
- FIG. 11 SWOT Analysis, Carrier
- FIG. 12 SWOT Analysis, Daikin
- FIG. 13 SWOT Analysis, SAMSUNG
- FIG. 14 SWOT Analysis, Mitsubishi Electric Corporation
- FIG. 15 SWOT Analysis, LG Electronics
- FIG. 16 SWOT Analysis, Lochinvar
- FIG. 17 SWOT Analysis, Viessmann
- FIG. 18 SWOT Analysis, Kensa Heat Pumps
- FIG. 19 SWOT Analysis, Glen Dimplex Group
- FIG. 20 SWOT Analysis, Panasonic Corporation
- FIG. 21 SWOT Analysis, Vaillant Group
- FIG. 22 SWOT Analysis, Guangzhou SPRSUN New Energy Technology Development Co., Ltd.
- FIG. 23 SWOT Analysis, STIEBEL ELTRON GmbH & Co. KG
- FIG. 24 SWOT Analysis, Trane
- FIG. 25 SWOT Analysis, OCHSNER
Global Residential Heat Pump Market is set to grow at a robust CAGR from 2023 to 2032, owing to the growing inclination towards energy-efficient heating systems. Rising consumer awareness of the benefits of utilizing energy-efficient heating and cooling systems to lower total energy expenditures and a significant rise in disposable incomes across all income levels will support market expansion.
A heat pump is an electrical device that serves as a building HVAC solution, providing cost-effective heating and cooling while leaving a small environmental imprint. The device transfers heat from one location to another by cycling refrigerants through evaporation and condensation.
Climate change and rising global temperatures have increased the demand for cooling solutions in many regions. Heat pumps offer efficient air conditioning and demonstrate exceptional heating capabilities, making them a versatile solution for homes in both warm and cold climates. The need for year-round comfort and climate control drives the adoption of residential heat pumps. This apart, growing demand for efficient space heating and cooling systems, changes in climatic circumstances, new R&D activities, and an increased emphasis on limiting carbon emissions will favor industry growth over the next ten years.
The residential heat pump industry is segmented according to product, application, and region.
As per the product, the residential heat pump market from the water source segment is anticipated to garner significant revenue over 2023-2032. Some key parameters stimulating the demand for water source heat pumps are their high energy efficiency during extreme temperatures, easy integration with other heating systems, longer lifespan, effective deployment across retrofitting operations, and the availability of financial benefit programs.
The market size from the multi-family application segment is estimated to record significant growth through 2032. Residential heat pumps offer multiple advantages in multi-family settings, including energy savings, reduced carbon emissions, and individual temperature control, making them an attractive choice for these buildings. Additionally, the advancements in heat pump technology, improved system performance, and the availability of compact and space-saving models suitable for multi-family applications will support segment growth.
The North America residential heat pump market is poised to grow at an appreciable CAGR over 2023-2032 on account of a positive regulatory framework at the state and federal levels. The availability of favorable financial support programs coupled with ongoing R&D initiatives, and rising consumer awareness about sustainable heating and cooling solutions have favored product adoption in the region. Moreover, the transition towards eco-friendly and energy-efficient heating and cooling solutions is will positively influence the regional landscape.
Table of Contents
Chapter 1 Methodology & Scope
- 1.1 Market scope and definitions
- 1.2 Market estimates & forecast parameters
- 1.2.1 Base estimates & calculations
- 1.3 Forecast calculation
- 1.4 Data sources
- 1.4.1 Primary
- 1.4.2 Secondary
- 1.4.2.1 Paid sources
- 1.4.2.2 Unpaid sources
Chapter 2 Executive Summary
- 2.1 Residential heat pump industry 360 degree synopsis, 2019 - 2032
- 2.1.1 Business trends
- 2.1.2 Product trends
- 2.1.3 Application trends
- 2.1.4 Regional trends
Chapter 3 Residential Heat Pump Industry Insights
- 3.1 Industry ecosystem analysis
- 3.1.1 Vendor Matrix
- 3.2 Regulatory landscape
- 3.3 COVID- 19 impact on the industry outlook
- 3.4 Industry impact forces
- 3.4.1 Growth drivers
- 3.4.2 Industry pitfalls & challenges
- 3.5 Growth potential analysis
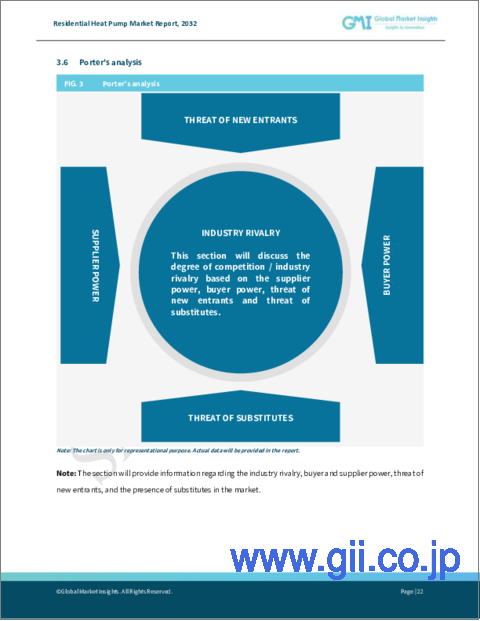
- 3.6 Porter's Analysis
- 3.6.1 Bargaining power of suppliers
- 3.6.2 Bargaining power of buyers
- 3.6.3 Threat of new entrants
- 3.6.4 Threat of substitutes
- 3.7 PESTEL Analysis
Chapter 4 Competitive Benchmarking
- 4.1 Competitive landscape, 2022
- 4.1.1 Strategic dashboard
- 4.2 Innovation & technology landscape
Chapter 5 Residential Heat Pump Market, By Product
- 5.1 Key product trends
- 5.2 Air source
- 5.2.1 Global market from air source, 2019 - 2032
- 5.2.2 Global market from air source, by region, 2019 - 2032
- 5.3 Ground source
- 5.3.1 Global market from ground source, 2019 - 2032
- 5.3.2 Global market from ground source, by region, 2019 - 2032
- 5.4 Water source
- 5.4.1 Global market from water source, 2019 - 2032
- 5.4.2 Global market from water source, by region, 2019 - 2032
Chapter 6 Residential Heat Pump Market, By Application
- 6.1 Key application trends
- 6.2 Single family
- 6.2.1 Global market from single family, 2019 - 2032
- 6.2.2 Global market from single family, by region, 2019 - 2032
- 6.3 Multi family
- 6.3.1 Global market from multi family, 2019 - 2032
- 6.3.2 Global market from multi family, by region, 2019 - 2032
Chapter 7 Residential Heat Pump Market, By Region
- 7.1 Key regional trends
- 7.2 North America
- 7.2.1 North America market, 2019 - 2032
- 7.2.2 North America market by product, 2019 - 2032
- 7.2.3 North America market by application, 2019 - 2032
- 7.2.4 U.S.
- 7.2.4.1 U.S. market, 2019 - 2032
- 7.2.4.2 U.S. market by product, 2019 - 2032
- 7.2.4.3 U.S. market by application, 2019 - 2032
- 7.2.5 Canada
- 7.2.5.1 Canada market, 2019 - 2032
- 7.2.5.2 Canada market by product, 2019 - 2032
- 7.2.5.3 Canada market by application, 2019 - 2032
- 7.3 Europe
- 7.3.1 Europe market, 2019 - 2032
- 7.3.2 Europe market by product, 2019 - 2032
- 7.3.3 Europe market by application, 2019 - 2032
- 7.3.4 Austria
- 7.3.4.1 Austria market, 2019 - 2032
- 7.3.4.2 Austria market by product, 2019 - 2032
- 7.3.4.3 Austria market by application, 2019 - 2032
- 7.3.5 Norway
- 7.3.5.1 Norway market, 2019 - 2032
- 7.3.5.2 Norway market by product, 2019 - 2032
- 7.3.5.3 Norway market by application, 2019 - 2032
- 7.3.6 Denmark
- 7.3.6.1 Denmark market, 2019 - 2032
- 7.3.6.2 Denmark market by product, 2019 - 2032
- 7.3.6.3 Denmark market by application, 2019 - 2032
- 7.3.7 Finland
- 7.3.7.1 Finland market, 2019 - 2032
- 7.3.7.2 Finland market by product, 2019 - 2032
- 7.3.7.3 Finland market by application, 2019 - 2032
- 7.3.8 France
- 7.3.8.1 France market, 2019 - 2032
- 7.3.8.2 France market by product, 2019 - 2032
- 7.3.8.3 France market by application, 2019 - 2032
- 7.3.9 Germany
- 7.3.9.1 Germany market, 2019 - 2032
- 7.3.9.2 Germany market by product, 2019 - 2032
- 7.3.9.3 Germany market by application, 2019 - 2032
- 7.3.10 Italy
- 7.3.10.1 Italy market, 2019 - 2032
- 7.3.10.2 Italy market by product, 2019 - 2032
- 7.3.10.3 Italy market by application, 2019 - 2032
- 7.3.11 Switzerland
- 7.3.11.1 Switzerland market, 2019 - 2032
- 7.3.11.2 Switzerland market by product, 2019 - 2032
- 7.3.11.3 Switzerland market by application, 2019 - 2032
- 7.3.12 Spain
- 7.3.12.1 Spain market, 2019 - 2032
- 7.3.12.2 Spain market by product, 2019 - 2032
- 7.3.12.3 Spain market by application, 2019 - 2032
- 7.3.13 Sweden
- 7.3.13.1 Sweden market, 2019 - 2032
- 7.3.13.2 Sweden market by product, 2019 - 2032
- 7.3.13.3 Sweden market by application, 2019 - 2032
- 7.3.14 UK
- 7.3.14.1 UK market, 2019 - 2032
- 7.3.14.2 UK market by product, 2019 - 2032
- 7.3.14.3 UK market by application, 2019 - 2032
- 7.3.15 Netherlands
- 7.3.15.1 Netherlands market, 2019 - 2032
- 7.3.15.2 Netherlands market by product, 2019 - 2032
- 7.3.15.3 Netherlands market by application, 2019 - 2032
- 7.4 Asia Pacific
- 7.4.1 Asia Pacific market, 2019 - 2032
- 7.4.2 Asia Pacific market by product, 2019 - 2032
- 7.4.3 Asia Pacific market by application, 2019 - 2032
- 7.4.4 China
- 7.4.4.1 China market, 2019 - 2032
- 7.4.4.2 China market by product, 2019 - 2032
- 7.4.4.3 China market by application, 2019 - 2032
- 7.4.5 Japan
- 7.4.5.1 Japan market, 2019 - 2032
- 7.4.5.2 Japan market by product, 2019 - 2032
- 7.4.5.3 Japan market by application, 2019 - 2032
- 7.4.6 Australia
- 7.4.6.1 Australia market, 2019 - 2032
- 7.4.6.2 Australia market by product, 2019 - 2032
- 7.4.6.3 Australia market by application, 2019 - 2032
- 7.4.7 South Korea
- 7.4.7.1 South Korea market, 2019 - 2032
- 7.4.7.2 South Korea market by product, 2019 - 2032
- 7.4.7.3 South Korea market by application, 2019 - 2032
- 7.5 Middle East & Africa
- 7.5.1 Middle East & Africa market, 2019 - 2032
- 7.5.2 Middle East & Africa market by product, 2019 - 2032
- 7.5.3 Middle East & Africa market by application, 2019 - 2032
- 7.5.4 Saudi Arabia
- 7.5.4.1 Saudi Arabia market, 2019 - 2032
- 7.5.4.2 Saudi Arabia market by product, 2019 - 2032
- 7.5.4.3 Saudi Arabia market by application, 2019 - 2032
- 7.5.5 Turkey
- 7.5.5.1 Turkey market, 2019 - 2032
- 7.5.5.2 Turkey market by product, 2019 - 2032
- 7.5.5.3 Turkey market by application, 2019 - 2032
- 7.5.6 South Africa
- 7.5.6.1 South Africa market, 2019 - 2032
- 7.5.6.2 South Africa market by product, 2019 - 2032
- 7.5.6.3 South Africa market by application, 2019 - 2032
- 7.6 Latin America
- 7.6.1 Latin America market, 2019 - 2032
- 7.6.2 Latin America market by product, 2019 - 2032
- 7.6.3 Latin America market by application, 2019 - 2032
- 7.6.4 Brazil
- 7.6.4.1 Brazil market, 2019 - 2032
- 7.6.4.2 Brazil market by product, 2019 - 2032
- 7.6.4.3 Brazil market by application, 2019 - 2032
- 7.6.5 Mexico
- 7.6.5.1 Mexico market, 2019 - 2032
- 7.6.5.2 Mexico market by product, 2019 - 2032
- 7.6.5.3 Mexico market by application, 2019 - 2032
- 7.6.6 Argentina
- 7.6.6.1 Argentina market, 2019 - 2032
- 7.6.6.2 Argentina market by product, 2019 - 2032
- 7.6.6.3 Argentina market by application, 2019 - 2032
Chapter 8 Company Profiles
- 8.1 Carrier
- 8.1.1 Business Overview
- 8.1.2 Financial Data
- 8.1.3 Product Landscape
- 8.1.4 Strategic Outlook
- 8.1.5 SWOT Analysis
- 8.2 Daikin
- 8.2.1 Business Overview
- 8.2.2 Financial Data
- 8.2.3 Product Landscape
- 8.2.4 Strategic Outlook
- 8.2.5 SWOT Analysis
- 8.3 SAMSUNG
- 8.3.1 Business Overview
- 8.3.2 Financial Data
- 8.3.3 Product Landscape
- 8.3.4 Strategic Outlook
- 8.3.5 SWOT Analysis
- 8.4 Mitsubishi Electric Corporation
- 8.4.1 Business Overview
- 8.4.2 Financial Data
- 8.4.3 Product Landscape
- 8.4.4 Strategic Outlook
- 8.4.5 SWOT Analysis
- 8.5 LG Electronics
- 8.5.1 Business Overview
- 8.5.2 Financial Data
- 8.5.3 Product Landscape
- 8.5.4 Strategic Outlook
- 8.5.5 SWOT Analysis
- 8.6 Lochinvar
- 8.6.1 Business Overview
- 8.6.2 Financial Data
- 8.6.3 Product Landscape
- 8.6.4 Strategic Outlook
- 8.6.5 SWOT Analysis
- 8.7 Viessmann
- 8.7.1 Business Overview
- 8.7.2 Financial Data
- 8.7.3 Product Landscape
- 8.7.4 Strategic Outlook
- 8.7.5 SWOT Analysis
- 8.8 Kensa Heat Pumps
- 8.8.1 Business Overview
- 8.8.2 Financial Data
- 8.8.3 Product Landscape
- 8.8.4 Strategic Outlook
- 8.8.5 SWOT Analysis
- 8.9 Glen Dimplex Group
- 8.9.1 Business Overview
- 8.9.2 Financial Data
- 8.9.3 Product Landscape
- 8.9.4 Strategic Outlook
- 8.9.5 SWOT Analysis
- 8.10 Panasonic Corporation
- 8.10.1 Business Overview
- 8.10.2 Financial Data
- 8.10.3 Product Landscape
- 8.10.4 Strategic Outlook
- 8.10.5 SWOT Analysis
- 8.11 Vaillant Group
- 8.11.1 Business Overview
- 8.11.2 Financial Data
- 8.11.3 Product Landscape
- 8.11.4 Strategic Outlook
- 8.11.5 SWOT Analysis
- 8.12 Guangzhou SPRSUN New Energy Technology Development Co., Ltd.
- 8.12.1 Business Overview
- 8.12.2 Financial Data
- 8.12.3 Product Landscape
- 8.12.4 Strategic Outlook
- 8.12.5 SWOT Analysis
- 8.13 STIEBEL ELTRON GmbH & Co. KG
- 8.13.1 Business Overview
- 8.13.2 Financial Data
- 8.13.3 Product Landscape
- 8.13.4 Strategic Outlook
- 8.13.5 SWOT Analysis
- 8.14 Trane
- 8.14.1 Business Overview
- 8.14.2 Financial Data
- 8.14.3 Product Landscape
- 8.14.4 Strategic Outlook
- 8.14.5 SWOT Analysis
- 8.15 OCHSNER
- 8.15.1 Business Overview
- 8.15.2 Financial Data
- 8.15.3 Product Landscape
- 8.15.4 Strategic Outlook
- 8.15.5 SWOT Analysis