
|
市場調査レポート
商品コード
1685216
小容量電解槽市場の機会、成長促進要因、産業動向分析、2025年~2034年の予測Small Capacity Electrolyzer Market Opportunity, Growth Drivers, Industry Trend Analysis, and Forecast 2025 - 2034 |
||||||
カスタマイズ可能
|
|||||||
| 小容量電解槽市場の機会、成長促進要因、産業動向分析、2025年~2034年の予測 |
|
出版日: 2025年01月09日
発行: Global Market Insights Inc.
ページ情報: 英文 125 Pages
納期: 2~3営業日
|

全表示
- 概要
- 目次
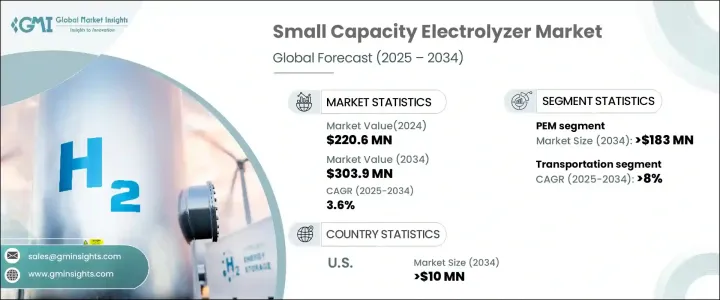
小容量電解槽の世界市場は、2024年に2億2,060万米ドルと評価され、2025年から2034年までのCAGRは3.6%と予測され、着実な成長を遂げようとしています。
水電解を利用したこれらの小型水素生成システムは、研究、小規模工業プロセス、住宅用水素製造、水素駆動機器の燃料供給など、さまざまな局所的用途に不可欠なものとなっています。中央集中型のインフラに依存することなく、オンサイトで水素を生成できることが、採用の重要な推進力となっています。クリーンエネルギーへの移行が世界的に加速する中、小容量電解槽は分散型水素製造の実行可能なソリューションとして台頭しつつあります。
エネルギーの独立性、持続可能性、効率的な水素エコシステムの開発への注目の高まりが、産業界全体の需要を促進しています。クリーン水素イニシアチブを促進する政府のインセンティブや政策が、市場の拡大をさらに後押ししています。さらに、技術と製造プロセスの進歩により製造コストと運用コストが削減され、電解槽がより身近なものとなっています。スケールアップが可能で、さまざまなセットアップにシームレスに統合できるため、特にカーボンニュートラルの達成を目指す産業や地域にとって、その魅力が高まっています。水素ベースのエネルギー・ソリューションに投資する企業は、小容量電解槽を活用して効率を高め、化石燃料への依存を減らしており、この分野の長期的な成長を促進しています。
| 市場範囲 | |
|---|---|
| 開始年 | 2024 |
| 予測年 | 2025-2034 |
| 開始金額 | 2億2,060万米ドル |
| 予測金額 | 3億390万米ドル |
| CAGR | 3.6% |
製品タイプ別では、プロトン交換膜(PEM)セグメントは2034年までに1億8,300万米ドルを生み出すと予測されています。PEM電解槽への嗜好の高まりは、その高い電流密度、コンパクトな構造、電圧変動への迅速な反応に起因しています。エネルギー・トランスミッションのロスを最小限に抑え、非電化地域で効率的に動作する能力により、特に農村部や遠隔地に有利です。膜材料と触媒の絶え間ない技術革新は、PEM技術の耐久性と費用対効果を向上させ、その市場ポテンシャルを強化し、水素経済成長の重要な促進要因として位置づけています。
用途別では、輸送分野が2034年まで8%のCAGRで堅調に成長すると予想されます。水素を動力源とするモビリティ・ソリューションの採用が増加していることが、特に燃料供給インフラの開発において、小容量電解槽の需要を促進しています。水素サプライチェーンの強化と国際貿易パートナーシップの促進が、このセグメントの拡大に重要な役割を果たしています。二酸化炭素排出量の削減と持続可能なエネルギー源への移行に向けた世界の取り組みが強化される中、分散型水素製造が牽引力を増しており、将来の輸送ネットワークにおける電解槽の役割はさらに強固なものとなっています。
米国の小容量電解槽市場は、2034年までに1,000万米ドルを創出すると予測されており、これは地域密着型の水素製造への投資増加によるものです。企業や政策立案者がエネルギーの回復力と排出削減を優先する中、市場は導入の急増を目の当たりにしています。再生可能エネルギー・プロジェクトの増加に加え、クリーンエネルギー・ソリューションの統合を目指す企業の取り組みが、需要をさらに加速しています。持続可能性の目標を達成しようとする産業界は、効率的なオンサイト水素生成のために小容量電解槽に注目しており、低炭素経済への移行における重要なコンポーネントとしての役割を確固たるものにしています。
目次
第1章 調査手法と調査範囲
- 市場の定義
- 基本推定と計算
- 予測計算
- 1次調査と検証
- 一次情報
- データマイニングソース
- 市場の定義
第2章 エグゼクティブサマリー
第3章 業界洞察
- 業界エコシステム
- 規制状況
- 業界への影響要因
- 促進要因
- 業界の潜在的リスク&課題
- 成長可能性分析
- ポーター分析
- PESTEL分析
第4章 競合情勢
- イントロダクション
- 戦略ダッシュボード
- イノベーションと持続可能性の展望
第5章 市場規模・予測:製品別、2021年~2034年
- 主要動向
- アルカリ
- PEM
- 固体酸化物
- その他
第6章 市場規模・予測:容量別、2021年~2034年
- 主要動向
- 100 kW以下
- 100 kW-300 kW
- 300kW~500kW
第7章 市場規模・予測:用途別、2021~2034年
- 主要動向
- 発電
- 輸送
- 産業エネルギー
- 産業用原料
- その他
第8章 市場規模・予測:地域別、2021年~2034年
- 主要動向
- 北米
- 米国
- カナダ
- 欧州
- ドイツ
- 英国
- フランス
- イタリア
- オランダ
- デンマーク
- アジア太平洋
- 中国
- 日本
- インド
- オーストラリア
- 世界のその他の地域
第9章 企業プロファイル
- Bloom Energy
- Enapter
- Giner
- Green Hydrogen Systems
- ITM Power
- Larsen &Toubro Limited
- Linde
- McPhy Energy
- Ostermeier H2ydrogen Solutions
- Sunfire
The Global Small Capacity Electrolyzer Market, valued at USD 220.6 million in 2024, is on track to experience steady growth with a projected CAGR of 3.6% from 2025 to 2034. These compact hydrogen generation systems, utilizing water electrolysis, are becoming essential for various localized applications, including research, small-scale industrial processes, residential hydrogen production, and fueling hydrogen-powered equipment. Their ability to generate hydrogen on-site without dependence on centralized infrastructure is a key driver of adoption. As the transition to clean energy accelerates worldwide, small capacity electrolyzers are emerging as a viable solution for decentralized hydrogen production.
The increasing focus on energy independence, sustainability, and the development of efficient hydrogen ecosystems is fueling demand across industries. Government incentives and policies promoting clean hydrogen initiatives are further boosting market expansion. Additionally, advancements in technology and manufacturing processes are reducing production and operational costs, making these electrolyzers more accessible. The ability to scale and integrate seamlessly into different setups enhances their appeal, particularly for industries and regions aiming to achieve carbon neutrality. Companies investing in hydrogen-based energy solutions are leveraging small capacity electrolyzers to enhance efficiency and reduce reliance on fossil fuels, driving long-term growth in this segment.
| Market Scope | |
|---|---|
| Start Year | 2024 |
| Forecast Year | 2025-2034 |
| Start Value | $220.6 Million |
| Forecast Value | $303.9 Million |
| CAGR | 3.6% |
By product type, the Proton Exchange Membrane (PEM) segment is poised to generate USD 183 million by 2034. The rising preference for PEM electrolyzers stems from their high current density, compact structure, and rapid response to voltage fluctuations. Their ability to minimize energy transmission losses and operate efficiently in off-grid locations makes them particularly advantageous for rural and remote areas. Continuous innovations in membrane materials and catalysts are improving the durability and cost-effectiveness of PEM technology, reinforcing its market potential and positioning it as a key driver of growth in the hydrogen economy.
In terms of application, the transportation segment is expected to grow at a robust CAGR of 8% through 2034. The increasing adoption of hydrogen-powered mobility solutions is propelling demand for small capacity electrolyzers, particularly in the development of fueling infrastructure. Strengthening hydrogen supply chains and fostering international trade partnerships are playing a crucial role in the expansion of this segment. As global efforts intensify to reduce carbon emissions and transition to sustainable energy sources, decentralized hydrogen production is gaining traction, further cementing electrolyzers' role in the future of transportation networks.
The U.S. small capacity electrolyzer market is projected to generate USD 10 million by 2034, driven by rising investments in localized hydrogen production. With businesses and policymakers prioritizing energy resilience and emissions reduction, the market is witnessing a surge in adoption. The growing number of renewable energy projects, coupled with corporate initiatives to integrate clean energy solutions, is further accelerating demand. Industries looking to meet sustainability targets are turning to small capacity electrolyzers for efficient on-site hydrogen generation, solidifying their role as a critical component in the transition to a low-carbon economy.
Table of Contents
Chapter 1 Methodology & Scope
- 1.1 Market definitions
- 1.2 Base estimates & calculations
- 1.3 Forecast calculation
- 1.4 Primary research & validation
- 1.4.1 Primary sources
- 1.4.2 Data mining sources
- 1.5 Market Definitions
Chapter 2 Executive Summary
- 2.1 Industry synopsis, 2021 – 2034
Chapter 3 Industry Insights
- 3.1 Industry ecosystem
- 3.2 Regulatory landscape
- 3.3 Industry impact forces
- 3.3.1 Growth drivers
- 3.3.2 Industry pitfalls & challenges
- 3.4 Growth potential analysis
- 3.5 Porter's analysis
- 3.5.1 Bargaining power of suppliers
- 3.5.2 Bargaining power of buyers
- 3.5.3 Threat of new entrants
- 3.5.4 Threat of substitutes
- 3.6 PESTEL analysis
Chapter 4 Competitive landscape, 2024
- 4.1 Introduction
- 4.2 Strategic dashboard
- 4.3 Innovation & sustainability landscape
Chapter 5 Market Size and Forecast, By Product, 2021 – 2034 (USD Million & kW)
- 5.1 Key trends
- 5.2 Alkaline
- 5.3 PEM
- 5.4 Solid oxide
- 5.5 Others
Chapter 6 Market Size and Forecast, By Capacity, 2021 – 2034 (USD Million & kW)
- 6.1 Key trends
- 6.2 ≤ 100 kW
- 6.3 > 100 kW - 300 kW
- 6.4 > 300 kW - 500 kW
Chapter 7 Market Size and Forecast, By Application, 2021 – 2034 (USD Million & kW)
- 7.1 Key trends
- 7.2 Power generation
- 7.3 Transportation
- 7.4 Industry energy
- 7.5 Industry feedstock
- 7.6 Others
Chapter 8 Market Size and Forecast, By Region, 2021 – 2034 (USD Million & kW)
- 8.1 Key trends
- 8.2 North America
- 8.2.1 U.S.
- 8.2.2 Canada
- 8.3 Europe
- 8.3.1 Germany
- 8.3.2 UK
- 8.3.3 France
- 8.3.4 Italy
- 8.3.5 Netherlands
- 8.3.6 Denmark
- 8.4 Asia Pacific
- 8.4.1 China
- 8.4.2 Japan
- 8.4.3 India
- 8.4.4 Australia
- 8.5 Rest of World
Chapter 9 Company Profiles
- 9.1 Bloom Energy
- 9.2 Enapter
- 9.3 Giner
- 9.4 Green Hydrogen Systems
- 9.5 ITM Power
- 9.6 Larsen & Toubro Limited
- 9.7 Linde
- 9.8 McPhy Energy
- 9.9 Ostermeier H2ydrogen Solutions
- 9.10 Sunfire

