
|
市場調査レポート
商品コード
1936527
ロボティクス・アズ・ア・サービス(RaaS)市場の機会、成長要因、業界動向分析、および2026年から2035年までの予測Robotics as a Service (RaaS) Market Opportunity, Growth Drivers, Industry Trend Analysis, and Forecast 2026 - 2035 |
||||||
カスタマイズ可能
|
|||||||
| ロボティクス・アズ・ア・サービス(RaaS)市場の機会、成長要因、業界動向分析、および2026年から2035年までの予測 |
|
出版日: 2026年01月30日
発行: Global Market Insights Inc.
ページ情報: 英文 270 Pages
納期: 2~3営業日
|

概要
世界のロボティクス・アズ・ア・サービス市場は、2025年に22億1,000万米ドルと評価され、2035年までにCAGR21.2%で成長し、145億6,000万米ドルに達すると予測されています。
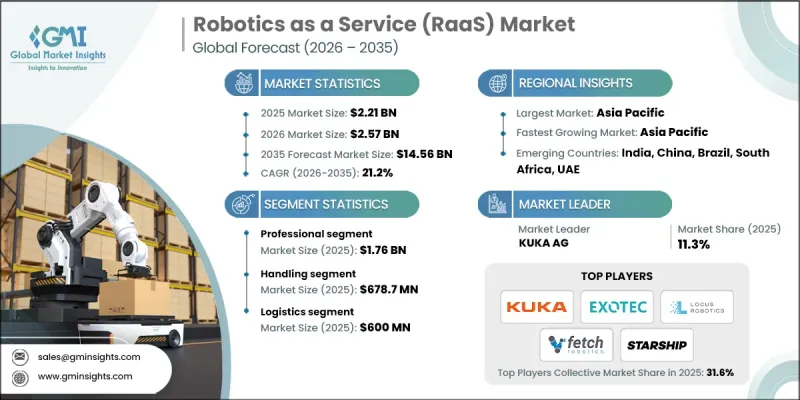
この拡大は、物流、製造、医療分野における深刻な労働力不足や、資本集約型投資から運用支出モデルへの移行志向の高まりなど、複数の要因によって推進されています。人工知能、クラウドロボティクス、自律航行技術の急速な進歩により、遠隔操作ロボット群の実用的な基盤が構築され、これがRaaSモデルの基盤を形成しています。リアルタイムのパフォーマンス追跡、集中型ソフトウェア更新、適応学習により、ダウンタイムとサービスコストの削減だけでなく信頼性も向上し、サービスプロバイダーは分散型ロボットを効率的に管理できます。サブスクリプションベースで成果重視のアプローチは、企業に拡張性・柔軟性・オンデマンド性を備えた自動化ソリューションを提供し、商業的に魅力的なものとなっています。組織は、業務の継続性維持、生産性最適化、長期間の採用サイクルを伴わない反復的または離職率の高い業務の遂行のために、RaaSへの依存度を高めています。AI、接続性、スマートソフトウェア統合の融合により、この自動化への注力はさらに強化され、RaaSは現代産業における効率性の主要な推進力となっています。
| 市場範囲 | |
|---|---|
| 開始年 | 2025年 |
| 予測年度 | 2026-2035 |
| 開始時価値 | 22億1,000万米ドル |
| 予測金額 | 145億6,000万米ドル |
| CAGR | 21.2% |
プロフェッショナル分野は2025年に17億6,000万米ドルの規模に達しました。熟練労働者の不足や生産性向上の圧力に直面する企業が、プロフェッショナル向けロボットの導入を推進しています。物流、医療、製造業などの業界では、業務の継続性維持、効率性向上、専門人材への依存度低減を目的に、ロボットシステムへの投資が特に進んでいます。サブスクリプション型ロボットサービスは、労働集約的なプロセスの管理や、性能を損なうことなく安定した生産量を確保するための実用的な解決策となりつつあります。
ハンドリング分野は2025年に6億7,870万米ドルの市場規模を生み出しました。物流自動化がこの需要の主要な推進力となっており、倉庫や流通センターでは、商品の輸送、エラーの最小化、処理能力の向上、繁忙期の人員不足解消を目的として、サブスクリプション方式によるロボット導入が拡大しています。高度なセンサーとソフトウェアにより、自律移動ロボットはより重い荷物を安全かつ効率的に移動させることが可能となり、企業に低総コストで信頼性の高いソリューションを提供しています。
北米のロボティクス・アズ・ア・サービス(RaaS)市場は2025年に36.8%のシェアを占め、RaaS分野で最も競合の激しい地域となりました。米国とカナダは、労働コスト削減と業務効率向上のための自律移動ロボットの迅速な導入を促進する技術エコシステムを確立しています。同地域は、サービス指向ロボティクスを支援し、物流、医療、スマートファクトリーといった商業用途において拡張可能なサブスクリプション型ソリューションを可能にする、広範なデジタルインフラとイノベーションネットワークの恩恵を受けています。
よくあるご質問
目次
第1章 調査手法と範囲
第2章 エグゼクティブサマリー
第3章 業界考察
- エコシステム分析
- サプライヤーの情勢
- 利益率
- コスト構造
- 各段階における付加価値
- バリューチェーンに影響を与える要因
- ディスラプション
- 業界への影響要因
- 促進要因
- 物流、製造、医療分野における労働力不足の深刻化
- 資本支出から営業支出モデルへの移行
- AI、クラウドロボティクス、自律航行技術における急速な進展
- 拡張性と柔軟性を備えた自動化ソリューションへの需要
- 成果ベースおよびサブスクリプション型ビジネスモデルの採用拡大
- 落とし穴と課題
- 複雑な使用事例における初期サービス価格の高さ
- データセキュリティ、安全性、および規制順守に関する懸念
- 促進要因
- 成長可能性分析
- 規制情勢
- 北米
- 欧州
- アジア太平洋地域
- ラテンアメリカ
- 中東・アフリカ
- ポーター分析
- PESTEL分析
- 技術とイノベーションの動向
- 現在の技術動向
- 新興技術
- 新興ビジネスモデル
- コンプライアンス要件
- サステナビリティへの取り組み
- サプライチェーンのレジリエンス
- 地政学的分析
- デジタルトランスフォーメーション
第4章 競合情勢
- イントロダクション
- 企業の市場シェア分析
- 地域別
- 北米
- 欧州
- アジア太平洋地域
- ラテンアメリカ
- 中東・アフリカ
- 市場集中度分析
- 地域別
- 主要企業の競合ベンチマーキング
- 製品ポートフォリオ比較
- 製品ラインの広さ
- 技術
- イノベーション
- 地域別事業展開比較
- 世界展開分析
- サービスネットワークのカバー率
- 地域別市場浸透率
- 競合ポジショニングマトリックス
- リーダー企業
- 課題者
- フォロワー
- ニッチプレイヤー
- 戦略的展望マトリックス
- 製品ポートフォリオ比較
- 主な発展, 2022-2025
- 合併・買収
- 提携および共同事業
- 技術的進歩
- 拡大および投資戦略
- サステナビリティへの取り組み
- デジタルトランスフォーメーションの取り組み
- 新興/スタートアップ競合の動向
第5章 市場推計・予測:タイプ別、2022-2035
- プロフェッショナル向け
- 個人向け
第6章 市場推計・予測:用途別、2022-2035
- ハンドリング
- 組立
- ディスペンサー
- 加工
- 溶接・はんだ付け
- その他
第7章 市場推計・予測:最終用途産業別、2022-2035
- 製造業
- 自動車
- 食品・飲料
- 物流
- ヘルスケア
- 小売り
- その他
第8章 市場推計・予測:地域別、2022-2035
- 北米
- 米国
- カナダ
- 欧州
- ドイツ
- 英国
- フランス
- スペイン
- イタリア
- オランダ
- アジア太平洋地域
- 中国
- インド
- 日本
- オーストラリア
- 韓国
- ラテンアメリカ
- ブラジル
- メキシコ
- アルゼンチン
- 中東・アフリカ
- サウジアラビア
- 南アフリカ
- アラブ首長国連邦
第9章 企業プロファイル
- 世界の主要企業
- Locus Robotics
- Fetch Robotics
- Sarcos Robotics
- 6 River Systems
- Exotec
- 地域別主要企業
- 北米
- Aethon
- Savioke
- Cobalt Robotics
- Knightscope
- 欧州
- Starship Technologies
- Sofigate
- Marble
- アジア太平洋地域
- Liquid Robotics
- inVia Robotics
- 北米
- ニッチ/ディスラプター企業
- Bossa Nova Robotics
- PrecisionHawk
- RedZone Robotics
- Hirebotics
- Fellow Robots
- Glomatriz

