|
|
市場調査レポート
商品コード
1271802
量子コンピューティングの市場規模:コンポーネント別、展開モデル別、アプリケーション別、エンドユーザー別、世界予測:2023-2032年Quantum Computing Market Size By Component, By Deployment Model, By Application, By End-user & Global Forecast, 2023-2032 |
||||||
|
|
|||||||
|
● お客様のご希望に応じて、既存データの加工や未掲載情報(例:国別セグメント)の追加などの対応が可能です。 詳細はお問い合わせください。 |
|||||||


| 量子コンピューティングの市場規模:コンポーネント別、展開モデル別、アプリケーション別、エンドユーザー別、世界予測:2023-2032年 |
|
出版日: 2023年04月26日
発行: Global Market Insights Inc.
ページ情報: 英文 200 Pages
納期: 2~3営業日
|
- 全表示
- 概要
- 図表
- 目次
量子コンピューティング市場は、防衛、金融、ヘルスケア、化学、製薬分野での量子コンピューティングサービス(QCaaS)の急速な導入に牽引され、2023年から2032年にかけて評価できるCAGRで拡大すると予想されています。
量子コンピューティングは、複雑な計算を数秒以内に実行する能力を持つことから、大きな支持を集めています。この技術は農業の分野でも重要な役割を果たし、農家の生産性や収穫量を向上させるのに役立っています。さらに、エネルギー効率の高い肥料の製造に必要な化学物質の生産に、最新の量子コンピューティングプラットフォームが使用されています。複雑な分子プロセスの解読に役立ち、肥料の製造など、より効率的でカーボンニュートラルな農業への応用を可能にします。
過去10年間、農業分野は、作物だけでなく畜産が地球に与える影響の増大を抑制するために、持続可能でゼロエミッションの飼料添加物や農業ソリューションに目を向けてきました。低メタン添加剤の登場により、抗メタンワクチンの分野での研究開発とイノベーションが加速しています。量子コンピューティングは、分子刺激によって適切な抗体を特定することで、ワクチン開発における有望なソリューションと見なされ、試験による多額の費用を節約することができます。米国環境保護庁によると、量子コンピューティングは、2035年までにさらに1ギガトン/年の炭素削減を達成できる可能性があります。
量子コンピューティング市場は、コンポーネント、展開、アプリケーション、エンドユーザー、地域によって分類されます。
コンポーネントに基づくと、市場はサービスとソフトウェアに二分されます。このうち、サービス分野は、コンサルティングサービスの需要の高まりにより、2022年には3億5,000万円以上と評価されました。さらに、先進的なコンピューティング技術の開発への大規模な投資と、先進国および新興経済諸国における中小企業の増加が、業界の収益源をさらに刺激します。
エンドユーザーの観点からは、ヘルスケアとBFSIに分類されます。ヘルスケア分野の量子コンピューティング市場規模は、2023年から2032年にかけて35%以上のCAGRで成長する見込みです。量子コンピューティングは、救命薬の開発、病気の早期発見、DNAシーケンスの高速化などに有効であることから、ヘルスケア分野で人気を博しています。ヘルスケア分野では、デジタル化と自動化が進んでおり、研究開発における量子コンピューティングの採用が促進され、ビジネスの成長を加速させるでしょう。
アプリケーション別では、機械学習における量子コンピューティングの需要は、MLシステムのハードウェアセットアップに同製品が広く使用されていることから、2032年まで大幅に増加すると考えられます。量子強化機械学習は、従来のMLプログラムが実行するタスクを加速させるのに役立ちます。新しいMLアルゴリズムの作成、プロセスの迅速化、処理速度が向上した量子ニューラルネットワークの開発などに利用されています。
地域別では、アジア太平洋の量子コンピューティング市場は、2022年に3億米ドル以上の規模になりました。急速な工業化と、製造業の生産高を高めるための最先端の自動化ソリューションの採用により、APAC諸国では量子コンピューティングの需要が急増すると考えられています。さらに、ML、刺激、最適化のためのコンピューティングソリューションの需要は、市場の成長を刺激します。
目次
第1章 調査手法とスコープ
第2章 エグゼクティブサマリー
第3章 量子コンピューティングの業界洞察
- COVID-19の発生による影響
- 地域別
- ロシア・ウクライナ戦争の影響分析
- 量子コンピューティング業界のエコシステム分析
- ハードウエア事業者
- プラットフォームプロバイダー
- スクアンサービスプロバイダー
- 流通チャネル
- エンドユーザー
- 利益率
- ベンダーマトリックス
- テクノロジーとイノベーションの展望
- ALとML
- IoT
- キュービット量子コンピューティング
- 量子コンピューティングの進化
- 規制状況
- 特許分析
- 主な取り組みとニュース
- 業界への影響要因
- 促進要因
- 量子コンピューティング技術への投資の増加
- ハイパフォーマンスコンピューティングへの需要
- 医学研究および金融市場からの需要
- 研究開発のための戦略的提携の増加
- 複雑な問題を解決するニーズの高まり
- 業界の潜在的リスク&課題
- 運営上の課題
- 高度な技術を持つプロフェッショナルの不足
- 促進要因
- 成長性分析
- ポーター分析
- PESTEL分析
第4章 競合情勢、2022年
- イントロダクション
- 企業収益別市場シェア(2022年)
- 量子コンピューティング主要プレイヤーの競合分析(2022年)
- The International Business Machines Corporation
- Google LLC
- Microsoft Corporation
- Amazon Web Services, Inc.
- qBittorrent
- Fujitsu Limited
- Huawei Technologies Co. Ltd.
- ベンダー採用マトリクス
- 戦略的展望マトリクス
第5章 量子コンピューティング市場:コンポーネント別
- 主要動向:コンポーネント別
- ソフトウェア
- サービス
第6章 量子コンピューティング市場:展開モデル別
- 主要動向:展開モデル別
- オンプレミス
- クラウド
第7章 量子コンピューティング市場:アプリケーション別
- 主要動向:アプリケーション別
- 最適化
- シミュレーション
- 機械学習
- サンプリング
- その他
第8章 量子コンピューティング市場:エンドユーザー別
- 主要動向:エンドユーザー別
- BFSI
- 航空宇宙・防衛
- オートモーティブ
- ヘルスケア
- 政府機関
- エネルギー
- 化学
- その他
第9章 量子コンピューティング市場:地域別
- 主要動向:地域別
- 北米
- 米国
- カナダ
- 欧州
- 英国
- ドイツ
- ロシア
- フランス
- スペイン
- アジア太平洋
- 中国
- インド
- 日本
- 韓国
- ラテンアメリカ
- ブラジル
- メキシコ
- アルゼンチン
- MEA
- サウジアラビア
- UAE
- 南アフリカ共和国
第10章 企業プロファイル
- Amazon Web Services, Inc.
- D-Wave Systems Inc.
- Fujitsu Limited
- Google LLC
- Huawei Technologies Co., Ltd.
- IonQ
- ISARA Corporation
- Microsoft Corporation
- PASQAL
- PsiQuantum
- QBittorrent
- Q-CTRL
- QC Ware Forge
- QpiAI Tech
- QxBranch, Inc
- Rigetti Computing, Inc.
- Strangeworks, Inc.
- The International Business Machines Corporation
- Xanadu Quantum Technologies
- Zapata Computing
Data Tables
- TABLE 1 Quantum computing market share (%), by region, 2022 (Revenue)
- TABLE 2 North America market share, by country, 2022
- TABLE 3 Quantum computing market share, by component, 2022 (%)
- TABLE 4 Quantum computing market share, by deployment model, 2022 (%)
- TABLE 5 Quantum computing market share, by application, 2022 (%)
- TABLE 6 Quantum computing market share, by end-user, 2022 (%)
- TABLE 7 Sources, by region
- TABLE 8 Glossary
- TABLE 9 Quantum computing market, 2018 - 2022 (USD Million)
- TABLE 10 Quantum computing market, 2023 - 2032 (USD Million)
- TABLE 11 Total Addressable Market (TAM), 2023 - 2032 (USD Billion)
- TABLE 12 Quantum computing market, by region, 2018 - 2022 (USD Million)
- TABLE 13 Quantum computing market, by region, 2023 - 2032 (USD Million)
- TABLE 14 Quantum computing market, by component, 2018 - 2022 (USD Million)
- TABLE 15 Quantum computing market, by component, 2023 - 2032 (USD Million)
- TABLE 16 Quantum computing market, by deployment model, 2018 - 2022 (USD Million)
- TABLE 17 Quantum computing market, by deployment model, 2023 - 2032 (USD Million)
- TABLE 18 Quantum computing market, by application, 2018 - 2022 (USD Million)
- TABLE 19 Quantum computing market, by application, 2023 - 2032 (USD Million)
- TABLE 20 Quantum computing market, by end-user, 2018 - 2022 (USD Million)
- TABLE 21 Quantum computing market, by end-user, 2023 - 2032 (USD Million)
- TABLE 22 COVID-19 impact on the North America Quantum computing market
- TABLE 23 COVID-19 impact on the Europe Quantum computing market
- TABLE 24 COVID-19 impact on the Asia Pacific Quantum computing market
- TABLE 25 COVID-19 impact on the Latin America Quantum computing market
- TABLE 26 COVID-19 impact on the MEA Quantum computing market
- TABLE 27 Vendor matrix
- TABLE 28 Patent analysis
- TABLE 29 Quantum computing market share, 2022 (by revenue)
- TABLE 30 Competitive analysis of major market players
- TABLE 31 Competitive analysis of prominent market players
- TABLE 32 Competitive positioning matrix: Classification criteria
- TABLE 33 Strategic outlook matrix: Classification criteria
- TABLE 34 Software market size, 2018 - 2022 (USD Million)
- TABLE 35 Software market size, 2023 - 2032 (USD Million)
- TABLE 36 Services market size, 2018 - 2022 (USD Million)
- TABLE 37 Services market size, 2023 - 2032 (USD Million)
- TABLE 38 On-premises market size, 2018 - 2022 (USD Million)
- TABLE 39 On-premises market size, 2023 - 2032 (USD Million)
- TABLE 40 Cloud market size, 2018 - 2022 (USD Million)
- TABLE 41 Cloud market size, 2023 - 2032 (USD Million)
- TABLE 42 Optimization market size, 2018 - 2022 (USD Million)
- TABLE 43 Optimization market size, 2023 - 2032 (USD Million)
- TABLE 44 Simulation market size, 2018 - 2022 (USD Million)
- TABLE 45 Simulation market size, 2023 - 2032 (USD Million)
- TABLE 46 Machine learning market size, 2018 - 2022 (USD Million)
- TABLE 47 Machine learning market size, 2023 - 2032 (USD Million)
- TABLE 48 Sampling market size, 2018 - 2022 (USD Million)
- TABLE 49 Sampling market size, 2023 - 2032 (USD Million)
- TABLE 50 Others market size, 2018 - 2022 (USD Million)
- TABLE 51 Others market size, 2023 - 2032 (USD Million)
- TABLE 52 BFSI market size, 2018 - 2022 (USD Million)
- TABLE 53 BFSI market size, 2023 - 2032 (USD Million)
- TABLE 54 Aerospace & Defense market size, 2018 - 2022 (USD Million)
- TABLE 55 Aerospace & Defense market size, 2023 - 2032 (USD Million)
- TABLE 56 Automotive market size, 2018 - 2022 (USD Million)
- TABLE 57 Automotive market size, 2023 - 2032 (USD Million)
- TABLE 58 BFSI market size, 2018 - 2022 (USD Million)
- TABLE 59 BFSI market size, 2023 - 2032 (USD Million)
- TABLE 60 Government market size, 2018 - 2022 (USD Million)
- TABLE 61 Government market size, 2023 - 2032 (USD Million)
- TABLE 62 Energy market size, 2018 - 2022 (USD Million)
- TABLE 63 Energy market size, 2023 - 2032 (USD Million)
- TABLE 64 Chemical market size, 2018 - 2022 (USD Million)
- TABLE 65 Chemical market size, 2023 - 2032 (USD Million)
- TABLE 66 Others market size, 2018 - 2022 (USD Million)
- TABLE 67 Others market size, 2023 - 2032 (USD Million)
- TABLE 68 North America quantum computing market, 2018 - 2022 (USD Million)
- TABLE 69 North America quantum computing market, 2023 - 2032 (USD Million)
- TABLE 70 North America quantum computing market, by component, 2018 - 2022 (USD Million)
- TABLE 71 North America quantum computing market, by component, 2023 - 2032 (USD Million)
- TABLE 72 North America quantum computing market, by deployment model, 2018 - 2022 (USD Million)
- TABLE 73 North America quantum computing market, by deployment model, 2023 - 2032 (USD Million)
- TABLE 74 North America quantum computing market, by application, 2018 - 2022 (USD Million)
- TABLE 75 North America quantum computing market, by application, 2023 - 2032 (USD Million)
- TABLE 76 North America quantum computing market, by end-user, 2018 - 2022 (USD Million)
- TABLE 77 North America quantum computing market, by end-user, 2023 - 2032 (USD Million)
- TABLE 78 U.S. quantum computing market, 2018 - 2022 (USD Million)
- TABLE 79 U.S. quantum computing market, 2023 - 2032 (USD Million)
- TABLE 80 U.S. quantum computing market, by component, 2018 - 2022 (USD Million)
- TABLE 81 U.S. quantum computing market, by component, 2023 - 2032 (USD Million)
- TABLE 82 U.S. quantum computing market, by deployment model, 2018 - 2022 (USD Million)
- TABLE 83 U.S. quantum computing market, by deployment model, 2023 - 2032 (USD Million)
- TABLE 84 U.S. quantum computing market, by application, 2018 - 2022 (USD Million)
- TABLE 85 U.S. quantum computing market, by application, 2023 - 2032 (USD Million)
- TABLE 86 U.S. quantum computing market, by end-user, 2018 - 2022 (USD Million)
- TABLE 87 U.S. quantum computing market, by end-user, 2023 - 2032 (USD Million)
- TABLE 88 Canada quantum computing market, 2018 - 2022 (USD Million)
- TABLE 89 Canada quantum computing market, 2023 - 2032 (USD Million)
- TABLE 90 Canada quantum computing market, by component, 2018 - 2022 (USD Million)
- TABLE 91 Canada quantum computing market, by component, 2023 - 2032 (USD Million)
- TABLE 92 Canada quantum computing market, by deployment model, 2018 - 2022 (USD Million)
- TABLE 93 Canada quantum computing market, by deployment model, 2023 - 2032 (USD Million)
- TABLE 94 Canada quantum computing market, by application, 2018 - 2022 (USD Million)
- TABLE 95 Canada quantum computing market, by application, 2023 - 2032 (USD Million)
- TABLE 96 Canada quantum computing market, by end-user, 2018 - 2022 (USD Million)
- TABLE 97 Canada quantum computing market, by end-user, 2023 - 2032 (USD Million)
- TABLE 98 Europe quantum computing market, 2018 - 2022 (USD Million)
- TABLE 99 Europe quantum computing market, 2023 - 2032 (USD Million)
- TABLE 100 Europe quantum computing market, by component, 2018 - 2022 (USD Million)
- TABLE 101 Europe quantum computing market, by component, 2023 - 2032 (USD Million)
- TABLE 102 Europe quantum computing market, by deployment model, 2018 - 2022 (USD Million)
- TABLE 103 Europe quantum computing market, by deployment model, 2023 - 2032 (USD Million)
- TABLE 104 Europe quantum computing market, by application, 2018 - 2022 (USD Million)
- TABLE 105 Europe quantum computing market, by application, 2023 - 2032 (USD Million)
- TABLE 106 Europe quantum computing market, by application, 2018 - 2022 (Million units)
- TABLE 107 Europe quantum computing market, by application, 2023 - 2032 (Million units)
- TABLE 108 Europe quantum computing market, by end-user, 2018 - 2022 (USD Million)
- TABLE 109 Europe quantum computing market, by end-user, 2023 - 2032 (USD Million)
- TABLE 110 UK quantum computing market, 2018 - 2022 (USD Million)
- TABLE 111 UK quantum computing market, 2023 - 2032 (USD Million)
- TABLE 112 UK quantum computing market, by component, 2018 - 2022 (USD Million)
- TABLE 113 UK quantum computing market, by component, 2023 - 2032 (USD Million)
- TABLE 114 UK quantum computing market, by deployment model, 2018 - 2022 (USD Million)
- TABLE 115 UK quantum computing market, by deployment model, 2023 - 2032 (USD Million)
- TABLE 116 UK quantum computing market, by application, 2018 - 2022 (USD Million)
- TABLE 117 UK quantum computing market, by application, 2023 - 2032 (USD Million)
- TABLE 118 UK quantum computing market, by end-user, 2018 - 2022 (USD Million)
- TABLE 119 UK quantum computing market, by end-user, 2023 - 2032 (USD Million)
- TABLE 120 Germany quantum computing market, 2018 - 2022 (USD Million)
- TABLE 121 Germany quantum computing market, 2023 - 2032 (USD Million)
- TABLE 122 Germany quantum computing market, by component, 2018 - 2022 (USD Million)
- TABLE 123 Germany quantum computing market, by component, 2023 - 2032 (USD Million)
- TABLE 124 Germany quantum computing market, by deployment model, 2018 - 2022 (USD Million)
- TABLE 125 Germany quantum computing market, by deployment model, 2023 - 2032 (USD Million)
- TABLE 126 Germany quantum computing market, by application, 2018 - 2022 (USD Million)
- TABLE 127 Germany quantum computing market, by application, 2023 - 2032 (USD Million)
- TABLE 128 Germany quantum computing market, by end-user, 2018 - 2022 (USD Million)
- TABLE 129 Germany quantum computing market, by end-user, 2023 - 2032 (USD Million)
- TABLE 130 Russia quantum computing market, 2018 - 2022 (USD Million)
- TABLE 131 Russia quantum computing market, 2023 - 2032 (USD Million)
- TABLE 132 Russia quantum computing market, by component, 2018 - 2022 (USD Million)
- TABLE 133 Russia quantum computing market, by component, 2023 - 2032 (USD Million)
- TABLE 134 Russia quantum computing market, by deployment model, 2018 - 2022 (USD Million)
- TABLE 135 Russia quantum computing market, by deployment model, 2023 - 2032 (USD Million)
- TABLE 136 Russia quantum computing market, by application, 2018 - 2022 (USD Million)
- TABLE 137 Russia quantum computing market, by application, 2023 - 2032 (USD Million)
- TABLE 138 Russia quantum computing market, by end-user, 2018 - 2022 (USD Million)
- TABLE 139 Russia quantum computing market, by end-user, 2023 - 2032 (USD Million)
- TABLE 140 France quantum computing market, 2018 - 2022 (USD Million)
- TABLE 141 France quantum computing market, 2023 - 2032 (USD Million)
- TABLE 142 France quantum computing market, by component, 2018 - 2022 (USD Million)
- TABLE 143 France quantum computing market, by component, 2023 - 2032 (USD Million)
- TABLE 144 France quantum computing market, by deployment model, 2018 - 2022 (USD Million)
- TABLE 145 France quantum computing market, by deployment model, 2023 - 2032 (USD Million)
- TABLE 146 France quantum computing market, by application, 2018 - 2022 (USD Million)
- TABLE 147 France quantum computing market, by application, 2023 - 2032 (USD Million)
- TABLE 148 France quantum computing market, by end-user, 2018 - 2022 (USD Million)
- TABLE 149 France quantum computing market, by end-user, 2023 - 2032 (USD Million)
- TABLE 150 Spain quantum computing market, 2018 - 2022 (USD Million)
- TABLE 151 Spain quantum computing market, 2023 - 2032 (USD Million)
- TABLE 152 Spain quantum computing market, by component, 2018 - 2022 (USD Million)
- TABLE 153 Spain quantum computing market, by component, 2023 - 2032 (USD Million)
- TABLE 154 Spain quantum computing market, by deployment model, 2018 - 2022 (USD Million)
- TABLE 155 Spain quantum computing market, by deployment model, 2023 - 2032 (USD Million)
- TABLE 156 Spain quantum computing market, by application, 2018 - 2022 (USD Million)
- TABLE 157 Spain quantum computing market, by application, 2023 - 2032 (USD Million)
- TABLE 158 Spain quantum computing market, by end-user, 2018 - 2022 (USD Million)
- TABLE 159 Spain quantum computing market, by end-user, 2023 - 2032 (USD Million)
- TABLE 160 Asia Pacific quantum computing market, 2018 - 2022 (USD Million)
- TABLE 161 Asia Pacific quantum computing market, 2023 - 2032 (USD Million)
- TABLE 162 Asia Pacific quantum computing market, by component, 2018 - 2022 (USD Million)
- TABLE 163 Asia Pacific quantum computing market, by component, 2023 - 2032 (USD Million)
- TABLE 164 Asia Pacific quantum computing market, by deployment model, 2018 - 2022 (USD Million)
- TABLE 165 Asia Pacific Quantum computing market, by deployment model, 2023 - 2032 (USD Million)
- TABLE 166 Asia Pacific quantum computing market, by application, 2018 - 2022 (USD Million)
- TABLE 167 Asia Pacific quantum computing market, by application, 2023 - 2032 (USD Million)
- TABLE 168 Asia Pacific quantum computing market, by end-user, 2018 - 2022 (USD Million)
- TABLE 169 Asia Pacific quantum computing market, by end-user, 2023 - 2032 (USD Million)
- TABLE 170 China quantum computing market, 2018 - 2022 (USD Million)
- TABLE 171 China quantum computing market, 2023 - 2032 (USD Million)
- TABLE 172 China quantum computing market, by component, 2018 - 2022 (USD Million)
- TABLE 173 China quantum computing market, by component, 2023 - 2032 (USD Million)
- TABLE 174 China quantum computing market, by deployment model, 2018 - 2022 (USD Million)
- TABLE 175 China quantum computing market, by deployment model, 2023 - 2032 (USD Million)
- TABLE 176 China quantum computing market, by application, 2018 - 2022 (USD Million)
- TABLE 177 China quantum computing market, by application, 2023 - 2032 (USD Million)
- TABLE 178 China quantum computing market, by end-user, 2018 - 2022 (USD Million)
- TABLE 179 China quantum computing market, by end-user, 2023 - 2032 (USD Million)
- TABLE 180 India quantum computing market, 2018 - 2022 (USD Million)
- TABLE 181 India quantum computing market, 2023 - 2032 (USD Million)
- TABLE 182 India quantum computing market, by component, 2018 - 2022 (USD Million)
- TABLE 183 India quantum computing market, by component, 2023 - 2032 (USD Million)
- TABLE 184 India quantum computing market, by deployment model, 2018 - 2022 (USD Million)
- TABLE 185 India quantum computing market, by deployment model, 2023 - 2032 (USD Million)
- TABLE 186 India quantum computing market, by application, 2018 - 2022 (USD Million)
- TABLE 187 India quantum computing market, by application, 2023 - 2032 (USD Million)
- TABLE 188 India quantum computing market, by end-user, 2018 - 2022 (USD Million)
- TABLE 189 India quantum computing market, by end-user, 2023 - 2032 (USD Million)
- TABLE 190 Japan quantum computing market, 2018 - 2022 (USD Million)
- TABLE 191 Japan quantum computing market, 2023 - 2032 (USD Million)
- TABLE 192 Japan quantum computing market, by component, 2018 - 2022 (USD Million)
- TABLE 193 Japan quantum computing market, by component, 2023 - 2032 (USD Million)
- TABLE 194 Japan quantum computing market, by deployment model, 2018 - 2022 (USD Million)
- TABLE 195 Japan quantum computing market, by deployment model, 2023 - 2032 (USD Million)
- TABLE 196 Japan quantum computing market, by application, 2018 - 2022 (USD Million)
- TABLE 197 Japan quantum computing market, by application, 2023 - 2032 (USD Million)
- TABLE 198 Japan quantum computing market, by end-user, 2018 - 2022 (USD Million)
- TABLE 199 Japan quantum computing market, by end-user, 2023 - 2032 (USD Million)
- TABLE 200 South Korea quantum computing market, 2018 - 2022 (USD Million)
- TABLE 201 South Korea quantum computing market, 2023 - 2032 (USD Million)
- TABLE 202 South Korea quantum computing market, by component, 2018 - 2022 (USD Million)
- TABLE 203 South Korea quantum computing market, by component, 2023 - 2032 (USD Million)
- TABLE 204 South Korea quantum computing market, by deployment model, 2018 - 2022 (USD Million)
- TABLE 205 South Korea quantum computing market, by deployment model, 2023 - 2032 (USD Million)
- TABLE 206 South Korea quantum computing market, by application, 2018 - 2022 (USD Million)
- TABLE 207 South Korea quantum computing market, by application, 2023 - 2032 (USD Million)
- TABLE 208 South Korea quantum computing market, by end-user, 2018 - 2022 (USD Million)
- TABLE 209 South Korea quantum computing market, by end-user, 2023 - 2032 (USD Million)
- TABLE 210 Latin America quantum computing market, 2018 - 2022 (USD Million)
- TABLE 211 Latin America quantum computing market, 2023 - 2032 (USD Million)
- TABLE 212 Latin America quantum computing market, by component, 2018 - 2022 (USD Million)
- TABLE 213 Latin America quantum computing market, by component, 2023 - 2032 (USD Million)
- TABLE 214 Latin America quantum computing market, by deployment model, 2018 - 2022 (USD Million)
- TABLE 215 Latin America quantum computing market, by deployment model, 2023 - 2032 (USD Million)
- TABLE 216 Latin America quantum computing market, by application, 2018 - 2022 (USD Million)
- TABLE 217 Latin America quantum computing market, by application, 2023 - 2032 (USD Million)
- TABLE 218 Latin America quantum computing market, by end-user, 2018 - 2022 (USD Million)
- TABLE 219 Latin America quantum computing market, by end-user, 2023 - 2032 (USD Million)
- TABLE 220 Brazil quantum computing market, 2018 - 2022 (USD Million)
- TABLE 221 Brazil quantum computing market, 2023 - 2032 (USD Million)
- TABLE 222 Brazil quantum computing market, by component, 2018 - 2022 (USD Million)
- TABLE 223 Brazil quantum computing market, by component, 2023 - 2032 (USD Million)
- TABLE 224 Brazil quantum computing market, by deployment model, 2018 - 2022 (USD Million)
- TABLE 225 Brazil quantum computing market, by deployment model, 2023 - 2032 (USD Million)
- TABLE 226 Brazil quantum computing market, by application, 2018 - 2022 (USD Million)
- TABLE 227 Brazil quantum computing market, by application, 2023 - 2032 (USD Million)
- TABLE 228 Brazil quantum computing market, by end-user, 2018 - 2022 (USD Million)
- TABLE 229 Brazil quantum computing market, by end-user, 2023 - 2032 (USD Million)
- TABLE 230 Mexico quantum computing market, 2018 - 2022 (USD Million)
- TABLE 231 Mexico quantum computing market, 2023 - 2032 (USD Million)
- TABLE 232 Mexico quantum computing market, by component, 2018 - 2022 (USD Million)
- TABLE 233 Mexico quantum computing market, by component, 2023 - 2032 (USD Million)
- TABLE 234 Mexico quantum computing market, by deployment model, 2018 - 2022 (USD Million)
- TABLE 235 Mexico quantum computing market, by deployment model, 2023 - 2032 (USD Million)
- TABLE 236 Mexico quantum computing market, by application, 2018 - 2022 (USD Million)
- TABLE 237 Mexico quantum computing market, by application, 2023 - 2032 (USD Million)
- TABLE 238 Mexico quantum computing market, by end-user, 2018 - 2022 (USD Million)
- TABLE 239 Mexico quantum computing market, by end-user, 2023 - 2032 (USD Million)
- TABLE 240 Argentina quantum computing market, 2018 - 2022 (USD Million)
- TABLE 241 Argentina quantum computing market, 2023 - 2032 (USD Million)
- TABLE 242 Argentina quantum computing market, by component, 2018 - 2022 (USD Million)
- TABLE 243 Argentina quantum computing market, by component, 2023 - 2032 (USD Million)
- TABLE 244 Argentina quantum computing market, by deployment model, 2018 - 2022 (USD Million)
- TABLE 245 Argentina quantum computing market, by deployment model, 2023 - 2032 (USD Million)
- TABLE 246 Argentina quantum computing market, by application, 2018 - 2022 (USD Million)
- TABLE 247 Argentina quantum computing market, by application, 2023 - 2032 (USD Million)
- TABLE 248 Argentina quantum computing market, by end-user, 2018 - 2022 (USD Million)
- TABLE 249 Argentina quantum computing market, by end-user, 2023 - 2032 (USD Million)
- TABLE 250 MEA quantum computing market, 2018 - 2022 (USD Million)
- TABLE 251 MEA quantum computing market, 2023 - 2032 (USD Million)
- TABLE 252 MEA quantum computing market, by component, 2018 - 2022 (USD Million)
- TABLE 253 MEA quantum computing market, by component, 2023 - 2032 (USD Million)
- TABLE 254 MEA quantum computing market, by deployment model, 2018 - 2022 (USD Million)
- TABLE 255 MEA quantum computing market, by deployment model, 2023 - 2032 (USD Million)
- TABLE 256 MEA quantum computing market, by application, 2018 - 2022 (USD Million)
- TABLE 257 MEA quantum computing market, by application, 2023 - 2032 (USD Million)
- TABLE 258 MEA quantum computing market, by end-user, 2018 - 2022 (USD Million)
- TABLE 259 MEA quantum computing market, by end-user, 2023 - 2032 (USD Million)
- TABLE 260 Saudi Arabia quantum computing market, 2018 - 2022 (USD Million)
- TABLE 261 Saudi Arabia quantum computing market, 2023 - 2032 (USD Million)
- TABLE 262 Saudi Arabia quantum computing market, by component, 2018 - 2022 (USD Million)
- TABLE 263 Saudi Arabia quantum computing market, by component, 2023 - 2032 (USD Million)
- TABLE 264 Saudi Arabia quantum computing market, by Deployment model, 2018 - 2022 (USD Million)
- TABLE 265 Saudi Arabia quantum computing market, by Deployment model, 2023 - 2032 (USD Million)
- TABLE 266 Saudi Arabia quantum computing market, by application, 2018 - 2022 (USD Million)
- TABLE 267 Saudi Arabia quantum computing market, by application, 2023 - 2032 (USD Million)
- TABLE 268 Saudi Arabia quantum computing market, by End-user, 2018 - 2022 (USD Million)
- TABLE 269 Saudi Arabia quantum computing market, by End-user, 2023 - 2032 (USD Million)
- TABLE 270 UAE quantum computing market, 2018 - 2022 (USD Million)
- TABLE 271 UAE quantum computing market, 2023 - 2032 (USD Million)
- TABLE 272 UAE quantum computing market, by component, 2018 - 2022 (USD Million)
- TABLE 273 UAE quantum computing market, by component, 2023 - 2032 (USD Million)
- TABLE 274 UAE quantum computing market, by deployment model, 2018 - 2022 (USD Million)
- TABLE 275 UAE quantum computing market, by deployment model, 2023 - 2032 (USD Million)
- TABLE 276 UAE quantum computing market, by application, 2018 - 2022 (USD Million)
- TABLE 277 UAE quantum computing market, by application, 2023 - 2032 (USD Million)
- TABLE 278 UAE quantum computing market, by end-user, 2018 - 2022 (USD Million)
- TABLE 279 UAE quantum computing market, by end-user, 2023 - 2032 (USD Million)
- TABLE 280 South Africa quantum computing market, 2018 - 2022 (USD Million)
- TABLE 281 South Africa quantum computing market, 2023 - 2032 (USD Million)
- TABLE 282 South Africa quantum computing market, by component, 2018 - 2022 (USD Million)
- TABLE 283 South Africa quantum computing market, by component, 2023 - 2032 (USD Million)
- TABLE 284 South Africa quantum computing market, by deployment model, 2018 - 2022 (USD Million)
- TABLE 285 South Africa quantum computing market, by deployment model, 2023 - 2032 (USD Million)
- TABLE 286 South Africa quantum computing market, by application, 2018 - 2022 (USD Million)
- TABLE 287 South Africa quantum computing market, by application, 2023 - 2032 (USD Million)
- TABLE 288 South Africa quantum computing market, by end-user, 2018 - 2022 (USD Million)
- TABLE 289 South Africa quantum computing market, by end-user, 2023 - 2032 (USD Million)
Charts & Figures
- FIG 1 Industry segmentation
- FIG 2 GMI's extensive coverage in the global Quantum computing market
- FIG 3 Profile break-up of primary respondents
- FIG 4 Quantum computing industry 36 degree synopsis, 2018 - 2032
- FIG 5 Industry ecosystem analysis
- FIG 6 Stakeholder profit margin analysis
- FIG 7 Growth potential analysis
- FIG 8 Porter's analysis
- FIG 9 PESTEL analysis
- FIG 10 Company market share, by revenue, 2022
- FIG 11 Competitive analysis of major players, 2022
- FIG 12 Competitive analysis of market innovators, 2022
- FIG 13 Vendor adoption matrix
- FIG 14 Strategy outlook matrix
- FIG 15 Quantum computing industry revenue share, by component, 2022 & 2032
- FIG 16 Quantum computing industry revenue share, by deployment model, 2022 & 2032
- FIG 17 Quantum computing industry revenue share, by application, 2022 & 2032
- FIG 18 Quantum computing industry revenue share, by end-user, 2022 & 2032
- FIG 19 Quantum computing industry revenue share, by region, 2022 & 2032
- FIG 20 SWOT Analysis, Amazon Web Services, Inc.
- FIG 21 SWOT Analysis, D-Wave Systems Inc.
- FIG 22 SWOT Analysis, Fujitsu Limited
- FIG 23 SWOT Analysis, Google LLC
- FIG 24 SWOT Analysis, Huawei Technologies Co., Ltd.
- FIG 25 SWOT Analysis, IonQ
- FIG 26 SWOT Analysis, ISARA Corporation
- FIG 27 SWOT Analysis, Microsoft Corporation
- FIG 28 SWOT Analysis, PASQAL
- FIG 29 SWOT Analysis, PsiQuantum
- FIG 30 SWOT Analysis, qBittorrent
- FIG 31 SWOT Analysis, Q-CTRL
- FIG 32 SWOT Analysis, QC Ware Forge
- FIG 33 SWOT Analysis, QpiAI Tech
- FIG 34 SWOT Analysis, QxBranch, Inc.
- FIG 35 SWOT Analysis, Rigetti Computing, Inc.
- FIG 36 SWOT Analysis, Strangeworks, Inc.
- FIG 37 SWOT Analysis, The International Business Machines Corporation
- FIG 38 SWOT Analysis, Xanadu Quantum Technologies
- FIG 39 SWOT Analysis, Zapata Computing
The quantum computing market is set to expand at an appreciable CAGR from 2023 to 2032, led by the rapid adoption of quantum computing service (QCaaS) across defense, finance, healthcare, chemical, and pharmaceutical sectors.
Quantum computers are gaining significant traction, attributed to their ability to perform complex calculations within seconds. The technology is finding crucial applications in the field of agriculture, helping farmers boost agricultural productivity and yield. Additionally, modern quantum computing platforms are being used to produce chemicals needed to manufacture energy-efficient fertilizers. It can help decode complex molecular processes, enabling more efficient and carbon-neutral farming applications, including the production of fertilizers.
Over the past decade, the agriculture sector has turned to sustainable and zero-emission feed additives and agricultural solutions to curb the increasing impact of crop as well as animal farming on the planet. The advent of low-methane additives is accelerating R&D and innovation in the anti-methane vaccines space. Quantum computing is seen as a promising solution in vaccine development by identifying suitable antibodies via molecule stimulation, saving hefty costs from trials. As per the U.S. EPA, quantum computing could potentially help achieve carbon reduction of up to an additional 1 gigaton/year by 2035.
The quantum computing market is categorized based on component, deployment, application, end-user, and region.
Based on component, the market is bifurcated into service and software. Among these, the service segment was valued at over 350 million in 2022, owing to the rising demand for consulting services. Moreover, massive investments in the development of advanced computing technologies and an increasing number of SMEs across developed and developing economies will further stimulate industry revenue streams.
In terms of end-user, the industry is classified into healthcare and BFSI. The quantum computing market size from the healthcare segment will grow at over 35% CAGR from 2023 to 2032. Quantum computing is gaining popularity across healthcare owing to its effectiveness in developing life-saving drugs, early disease detection, and faster DNA sequencing. Ongoing digitization & automation across the healthcare sector will propel the adoption of quantum computing in R&D, thus, accelerating business growth.
By application, the demand for quantum computing in machine learning will increase significantly through 2032 due to the extensive use of the product in the hardware setup of ML systems. Quantum-enhanced machine learning helps accelerate tasks performed by conventional ML programs. It is used to create new ML algorithms, expedite processes and develop quantum neural networks with enhanced processing speed.
Regionally, the Asia Pacific quantum computing market was worth more than USD 300 million in 2022. The demand for quantum computing is set to surge across APAC countries due to rapid industrialization and the adoption of cutting-edge automated solutions to boost manufacturing output. Furthermore, the demand for computing solutions for ML, stimulation, and optimization will stimulate market growth.
Table of Contents
Chapter 1 Methodology & Scope
- 1.1 Market definition
- 1.2 Base estimates & forecast
- 1.3 Forecast calculations
- 1.4 Data Sources
- 1.4.1 Secondary
- 1.4.2 Primary
- 1.5 Industry Glossary
Chapter 2 Executive Summary
- 2.1 Quantum computing industry 360 degree synopsis, 2018 - 2032
- 2.2 Business trends
- 2.2.1 Total addressable market (TAM) trends, 2023 - 2032
- 2.3 Regional trends
- 2.4 Component trends
- 2.5 Deployment model trends
- 2.6 Application trends
- 2.7 End-user trends
Chapter 3 Quantum Computing Industry Insights
- 3.1 Impact of COVID-19 outbreak
- 3.1.1 By region
- 3.1.1.1 North America
- 3.1.1.2 Europe
- 3.1.1.3 Asia Pacific
- 3.1.1.4 Latin America
- 3.1.1.5 MEA
- 3.1.1 By region
- 3.2 Impact analysis of Russia-Ukraine war
- 3.3 Quantum computing industry ecosystem analysis
- 3.3.1 Hardware providers
- 3.3.2 Platform providers
- 3.3.3 SQuanervice providers
- 3.3.4 Distribution channel
- 3.3.5 End users
- 3.3.6 Profit margin
- 3.3.7 Vendor matrix
- 3.4 Technology & innovation landscape
- 3.4.1 AL and ML
- 3.4.2 IoT
- 3.4.3 Qubit quantum computing
- 3.5 Evolution of Quantum Computing
- 3.6 Regulatory landscape
- 3.7 Patent analysis
- 3.8 Key initiatives & news
- 3.9 Industry impact forces
- 3.9.1 Growth drivers
- 3.9.1.1 Rising investments in quantum computing technology
- 3.9.1.2 Demand for high performance computing
- 3.9.1.3 Demand from medical research and financial markets
- 3.9.1.4 Increasing number of strategic alliances for research and development
- 3.9.1.5 Rising need to solve complex problems.
- 3.9.2 Industry pitfalls and challenges
- 3.9.2.1 Operational challenges
- 3.9.2.2 Lack of highly skilled professionals
- 3.9.1 Growth drivers
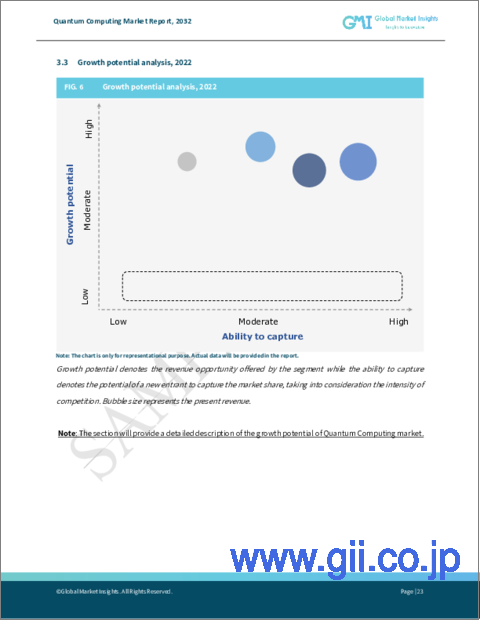
- 3.10 Growth potential analysis
- 3.11 Porter's analysis
- 3.12 PESTEL analysis
Chapter 4 Competitive Landscape, 2022
- 4.1 Introduction
- 4.2 Company market share, by revenue, 2022
- 4.3 Competitive analysis of major Quantum computing key players, 2022
- 4.3.1 The International Business Machines Corporation
- 4.3.2 Google LLC
- 4.3.3 Microsoft Corporation
- 4.3.4 Amazon Web Services, Inc.
- 4.3.5 qBittorrent
- 4.3.6 Fujitsu Limited
- 4.3.7 Huawei Technologies Co. Ltd.
- 4.4 Vendor adoption matrix
- 4.5 Strategic outlook matrix
Chapter 5 Quantum Computing Market, By Component
- 5.1 Key trends, by component
- 5.2 Software
- 5.2.1 Market estimates and forecast, 2018 - 2032
- 5.3 Services
- 5.3.1 Market estimates and forecast, 2018 - 2032
Chapter 6 Quantum Computing Market, By Deployment model
- 6.1 Key trends, by deployment model
- 6.2 On-premises
- 6.2.1 Market estimates and forecast, 2018 - 2032
- 6.3 Cloud
- 6.3.1 Market estimates and forecast, 2018-2032
Chapter 7 Quantum Computing Market, By Application
- 7.1 Key trends, by application
- 7.2 Optimization
- 7.2.1 Market estimates and forecast, 2018 - 2032
- 7.3 Simulation
- 7.3.1 Market estimates and forecast, 2018 - 2032
- 7.4 Machine Learning
- 7.4.1 Market estimates and forecast, 2018 - 2032
- 7.5 Sampling
- 7.5.1 Market estimates and forecast, 2018 - 2032
- 7.6 Others
- 7.6.1 Market estimates and forecast, 2018 - 2032
Chapter 8 Quantum Computing Market, By End-user
- 8.1 Key trends, by end-user
- 8.2 BFSI
- 8.2.1 Market estimates and forecast, 2018 - 2032
- 8.3 Aerospace & Defense
- 8.3.1 Market estimates and forecast, 2018 - 2032
- 8.4 Automotive
- 8.4.1 Market estimates and forecast, 2018 - 2032
- 8.5 Healthcare
- 8.5.1 Market estimates and forecast, 2018 - 2032
- 8.6 Government
- 8.6.1 Market estimates and forecast, 2018 - 2032
- 8.7 Energy
- 8.7.1 Market estimates and forecast, 2018 - 2032
- 8.8 Chemical
- 8.8.1 Market estimates and forecast, 2018 - 2032
- 8.9 Others
- 8.9.1 Market estimates and forecast, 2018 - 2032
Chapter 9 Quantum Computing Market, By Region
- 9.1 Key trends, by region
- 9.2 North America
- 9.2.1 Market estimates and forecast, 2018 - 2032
- 9.2.2 Market estimates and forecast, by component, 2018 - 2032
- 9.2.3 Market estimates and forecast, by deployment model, 2018 - 2032
- 9.2.4 Market estimates and forecast, by application, 2018 - 2032
- 9.2.5 Market estimates and forecast, by end-user, 2018-2032
- 9.2.6 U.S.
- 9.2.6.1 Market estimates and forecast, 2018 - 2032
- 9.2.6.2 Market estimates and forecast, by component, 2018 - 2032
- 9.2.6.3 Market estimates and forecast, by deployment model, 2018 - 2032
- 9.2.6.4 Market estimates and forecast, by application, 2018 - 2032
- 9.2.6.5 Market estimates and forecast, by end-user, 2018-2032
- 9.2.7 Canada
- 9.2.7.1
- 9.2.7.2 Market estimates and forecast, 2018 - 2032
- 9.2.7.3 Market estimates and forecast, by component, 2018 - 2032
- 9.2.7.4 Market estimates and forecast, by deployment model, 2018 - 2032
- 9.2.7.5 Market estimates and forecast, by application, 2018 - 2032
- 9.2.7.6 Market estimates and forecast, by end-user, 2018-2032
- 9.3 Europe
- 9.3.1 Market estimates and forecast, 2018 - 2032
- 9.3.2 Market estimates and forecast, by component, 2018 - 2032
- 9.3.3 Market estimates and forecast, by deployment model, 2018 - 2032
- 9.3.4 Market estimates and forecast, by application, 2018 - 2032
- 9.3.5 Market estimates and forecast, by end-user, 2018-2032
- 9.3.6 UK
- 9.3.6.1
- 9.3.6.2 Market estimates and forecast, 2018 - 2032
- 9.3.6.3 Market estimates and forecast, by component, 2018 - 2032
- 9.3.6.4 Market estimates and forecast, by deployment model, 2018 - 2032
- 9.3.6.5 Market estimates and forecast, by application, 2018 - 2032
- 9.3.6.6 Market estimates and forecast, by end-user, 2018-2032
- 9.3.7 Germany
- 9.3.7.1 Market estimates and forecast, 2018 - 2032
- 9.3.7.2 Market estimates and forecast, by component, 2018 - 2032
- 9.3.7.3 Market estimates and forecast, by deployment model, 2018 - 2032
- 9.3.7.4 Market estimates and forecast, by application, 2018 - 2032
- 9.3.7.5 Market estimates and forecast, by end-user, 2018-2032
- 9.3.8 Russia
- 9.3.8.1 Market estimates and forecast, 2018 - 2032
- 9.3.8.2 Market estimates and forecast, by component, 2018 - 2032
- 9.3.8.3 Market estimates and forecast, by deployment model, 2018 - 2032
- 9.3.8.4 Market estimates and forecast, by application, 2018 - 2032
- 9.3.8.5 Market estimates and forecast, by end-user, 2018-2032
- 9.3.9 France
- 9.3.9.1 Market estimates and forecast, 2018 - 2032
- 9.3.9.2 Market estimates and forecast, by component, 2018 - 2032
- 9.3.9.3 Market estimates and forecast, by deployment model, 2018 - 2032
- 9.3.9.4 Market estimates and forecast, by application, 2018 - 2032
- 9.3.9.5 Market estimates and forecast, by end-user, 2018-2032
- 9.3.10 Spain
- 9.3.10.1 Market estimates and forecast, 2018 - 2032
- 9.3.10.2 Market estimates and forecast, by component, 2018 - 2032
- 9.3.10.3 Market estimates and forecast, by Deployment model, 2018 - 2032
- 9.3.10.4 Market estimates and forecast, by application, 2018 - 2032
- 9.3.10.5 Market estimates and forecast, by End-user, 2018-2032
- 9.4 Asia Pacific
- 9.4.1 Market estimates and forecast, 2018 - 2032
- 9.4.2 Market estimates and forecast, by component, 2018 - 2032
- 9.4.3 Market estimates and forecast, by deployment model, 2018 - 2032
- 9.4.4 Market estimates and forecast, by application, 2018 - 2032
- 9.4.5 Market estimates and forecast, by end-user, 2018-2032
- 9.4.6 China
- 9.4.6.1 Market estimates and forecast, 2018 - 2032
- 9.4.6.2 Market estimates and forecast, by component, 2018 - 2032
- 9.4.6.3 Market estimates and forecast, by deployment model, 2018 - 2032
- 9.4.6.4 Market estimates and forecast, by application, 2018 - 2032
- 9.4.6.5 Market estimates and forecast, by end-user, 2018-2032
- 9.4.7 India
- 9.4.7.1 Market estimates and forecast, 2018 - 2032
- 9.4.7.2 Market estimates and forecast, by component, 2018 - 2032
- 9.4.7.3 Market estimates and forecast, by deployment model, 2018 - 2032
- 9.4.7.4 Market estimates and forecast, by application, 2018 - 2032
- 9.4.7.5 Market estimates and forecast, by end-user, 2018-2032
- 9.4.8 Japan
- 9.4.8.1 Market estimates and forecast, 2018 - 2032
- 9.4.8.2 Market estimates and forecast, by component, 2018 - 2032
- 9.4.8.3 Market estimates and forecast, by deployment model, 2018 - 2032
- 9.4.8.4 Market estimates and forecast, by application, 2018 - 2032
- 9.4.8.5 Market estimates and forecast, by end-user, 2018-2032
- 9.4.9 South Korea
- 9.4.9.1 Market estimates and forecast, 2018 - 2032
- 9.4.9.2 Market estimates and forecast, by component, 2018 - 2032
- 9.4.9.3 Market estimates and forecast, by deployment model, 2018 - 2032
- 9.4.9.4 Market estimates and forecast, by application, 2018 - 2032
- 9.4.9.5 Market estimates and forecast, by end-user, 2018-2032
- 9.5 Latin America
- 9.5.1 Market estimates and forecast, 2018 - 2032
- 9.5.2 Market estimates and forecast, by component, 2018 - 2032
- 9.5.3 Market estimates and forecast, by deployment model, 2018 - 2032
- 9.5.4 Market estimates and forecast, by application, 2018 - 2032
- 9.5.5 Market estimates and forecast, by end-user, 2018-2032
- 9.5.6 Brazil
- 9.5.6.1 Market estimates and forecast, 2018 - 2032
- 9.5.6.2 Market estimates and forecast, by component, 2018 - 2032
- 9.5.6.3 Market estimates and forecast, by deployment model, 2018 - 2032
- 9.5.6.4 Market estimates and forecast, by application, 2018 - 2032
- 9.5.6.5 Market estimates and forecast, by end-user, 2018-2032
- 9.5.7 Mexico
- 9.5.7.1 Market estimates and forecast, 2018 - 2032
- 9.5.7.2 Market estimates and forecast, by component, 2018 - 2032
- 9.5.7.3 Market estimates and forecast, by deployment model, 2018 - 2032
- 9.5.7.4 Market estimates and forecast, by application, 2018 - 2032
- 9.5.7.5 Market estimates and forecast, by end-user, 2018-2032
- 9.5.8 Argentina
- 9.5.8.1 Market estimates and forecast, 2018 - 2032
- 9.5.8.2 Market estimates and forecast, by component, 2018 - 2032
- 9.5.8.3 Market estimates and forecast, by Deployment model, 2018 - 2032
- 9.5.8.3.1 Market estimates, by cloud, 2018-2032
- 9.5.8.4 Market estimates and forecast, by application, 2018 - 2032
- 9.5.8.5 Market estimates and forecast, by End-user, 2018-2032
- 9.6 MEA
- 9.6.1 Market estimates and forecast, 2018 - 2032
- 9.6.2 Market estimates and forecast, by component, 2018 - 2032
- 9.6.3 Market estimates and forecast, by deployment model, 2018 - 2032
- 9.6.4 Market estimates and forecast, by application, 2018 - 2032
- 9.6.5 Market estimates and forecast, by end-user, 2018-2032
- 9.6.6 Saudi Arabia
- 9.6.6.1 Market estimates and forecast, 2018 - 2032
- 9.6.6.2 Market estimates and forecast, by component, 2018 - 2032
- 9.6.6.3 Market estimates and forecast, by deployment model, 2018 - 2032
- 9.6.6.4 Market estimates and forecast, by application, 2018 - 2032
- 9.6.6.5 Market estimates and forecast, by ed-user, 2018-2032
- 9.6.7 UAE
- 9.6.7.1 Market estimates and forecast, 2018 - 2032
- 9.6.7.2 Market estimates and forecast, by component, 2018 - 2032
- 9.6.7.3 Market estimates and forecast, by deployment model, 2018 - 2032
- 9.6.7.4 Market estimates and forecast, by application, 2018 - 2032
- 9.6.7.5 Market estimates and forecast, by end-user, 2018-2032
- 9.6.8 South Africa
- 9.6.8.1 Market estimates and forecast, 2018 - 2032
- 9.6.8.2 Market estimates and forecast, by component, 2018 - 2032
- 9.6.8.3 Market estimates and forecast, by deployment model, 2018 - 2032
- 9.6.8.4 Market estimates and forecast, by application, 2018 - 2032
- 9.6.8.5 Market estimates and forecast, by end-user, 2018-2032
Chapter 10 Company Profiles
- 10.1 Amazon Web Services, Inc.
- 11.1.1 Business overview
- 11.1.2 Financial data
- 11.1.3 Product landscape
- 11.1.4 Strategic outlook
- 11.1.5 SWOT analysis
.11.2 D-Wave Systems Inc.
- 11.2.1 Business overview
- 11.2.2 Financial data
- 11.2.3 Product landscape
- 11.2.4 Strategic outlook
- 11.2.5 SWOT analysis
- 11.3 Fujitsu Limited
- 11.3.1 Business overview
- 11.3.2 Financial data
- 11.3.3 Product landscape
- 11.3.4 Strategic outlook
- 11.3.5 SWOT analysis
- 11.4 Google LLC
- 11.4.1 Business overview
- 11.4.2 Financial data
- 11.4.3 Product landscape
- 11.4.4 Strategic outlook
- 11.4.5 SWOT analysis
- 11.5 Huawei Technologies Co., Ltd.
- 11.5.1 Business overview
- 11.5.2 Financial Data
- 11.5.3 Product landscape
- 11.5.4 Strategic outlook
- 11.5.5 SWOT analysis
- 11.6 IonQ
- 11.6.1 Business overview
- 11.6.2 Financial data
- 11.6.3 Product landscape
- 11.6.5 SWOT analysis
- 11.7 ISARA Corporation
- 11.7.1 Business overview
- 11.7.2 Financial data
- 11.7.3 Product landscape
- 11.7.4 SWOT analysis
- 11.8 Microsoft Corporation
- 11.8.1 Business overview
- 11.8.2 Financial data
- 11.8.3 Product landscape
- 11.8.4 SWOT analysis
- 11.9 PASQAL
- 11.9.1 Business overview
- 11.9.2 Financial data
- 11.9.3 Product landscape
- 11.9.4 Strategic outlook
- 11.9.5 SWOT analysis
- 11.10 PsiQuantum
- 11.10.1 Business overview
- 11.10.2 Financial data
- 11.10.3 Product landscape
- 11.10.4 SWOT analysis
- 11.11 QBittorrent
- 11.11.1 Business overview
- 11.11.2 Financial data
- 11.11.3 Product landscape
- 11.11.4 Strategic outlook
- 11.11.5 SWOT analysis
- 11.12 Q-CTRL
- 11.12.1 Business overview
- 11.12.2 Financial data
- 11.12.3 Product landscape
- 11.12.4 Strategic outlook
- 11.12.5 SWOT analysis
- 11.13 QC Ware Forge
- 11.13.1 Business overview
- 11.13.2 Financial data
- 11.13.3 Product landscape
- 11.13.4 Strategic outlook
- 11.13.5 SWOT analysis
- 11.14 QpiAI Tech
- 11.14.1 Business overview
- 11.14.2 Financial data
- 11.14.3 Product landscape
- 11.14.4 SWOT analysis
- 11.15 QxBranch, Inc
- 11.15.1 Business overview
- 11.15.2 Financial data
- 11.15.3 Product landscape
- 11.15.4 SWOT analysis
- 11.16 Rigetti Computing, Inc.
- 11.16.1 Business overview
- 11.16.2 Financial data
- 11.16.3 Product landscape
- 11.16.4 SWOT analysis
- 11.17 Strangeworks, Inc.
- 11.17.1 Business overview
- 11.17.2 Financial data
- 11.17.3 Product landscape
- 11.17.4 Strategic outlook
- 11.17.5 SWOT analysis
- 11.18 The International Business Machines Corporation
- 11.18.1 Business overview
- 11.18.2 Financial data
- 11.18.3 Product landscape
- 11.18.4 Strategic outlook
- 11.18.5 SWOT analysis
- 11.19 Xanadu Quantum Technologies
- 11.19.1 Business overview
- 11.19.2 Financial data
- 11.19.3 Product landscape
- 11.19.4 SWOT analysis
- 11.20 Zapata Computing
- 11.20.1 Business overview
- 11.20.2 Financial data
- 11.20.3 Product landscape
- 11.20.4 Strategic outlook
- 11.20.5 SWOT analysis