|
|
市場調査レポート
商品コード
1256371
バイオ肥料市場 - 製品別、用途別、作物別、形態別、世界予測、2023年~2032年Biofertilizers Market - By Product, By Application, By Crop, By Form & Global Forecast, 2023 - 2032 |
||||||
|
|
|||||||
|
● お客様のご希望に応じて、既存データの加工や未掲載情報(例:国別セグメント)の追加などの対応が可能です。 詳細はお問い合わせください。 |
|||||||


| バイオ肥料市場 - 製品別、用途別、作物別、形態別、世界予測、2023年~2032年 |
|
出版日: 2023年03月27日
発行: Global Market Insights Inc.
ページ情報: 英文 450 Pages
納期: 2~3営業日
|
- 全表示
- 概要
- 目次
バイオ肥料市場は、環境意識の重視の高まりにより、2023年から2032年の間に強い需要を示すと予測されます。
有機農業や自然農法への移行に向けた政府の取り組みや努力の増加は、バイオ肥料の市場規模を押し上げるでしょう。また、農薬による環境への影響を軽減するための広範な研究活動は、業界の成長を後押しします。
また、化学合成肥料の過剰かつ不適切な散布は、土壌や水域を汚染し、汚染しています。化学肥料は植物の成長をサポートしますが、土壌の健康や構造を改善しないため、土壌にとって有益ではありません。
全体として、バイオ肥料産業は、製品、用途、作物、形態、地域の観点から区分されます。
製品に基づくと、カリ動員細菌セグメントは2023-2032年の間にかなり成長すると思われます。カリ動員細菌は、土壌や植物の成長において様々な役割を果たし、アンモニウムイオンをタンパク質やアミノ酸に変換するために不可欠です。さらに、カルシウム、窒素、リンなどの栄養素を追加で取り込む際にもダイナミックな役割を有しています。
用途別では、土壌の自然環境を維持するための様々な利点があるため、土壌処理分野は2032年まで大きな成長を遂げると予想されます。マクロおよび微量栄養素は、土壌の肥沃度を高める。バイオ肥料は塩分と相互作用し、植物の成長と発達に不可欠です。
作物別では、豆類・油糧種子部門は2022年に2億2,000万米ドル以上と評価されました。このセグメントの成長は、予測期間中、豆類と油糧種子の生産におけるバイオ肥料の使用が増加していることに起因していると考えられます。その上、バイオ肥料は、パルスの生産に重要な大気中の窒素と適切なリンの含有量を提供します。また、微量栄養素も含まれており、土壌を生物学的に活性化させ、豆類の生産に必要な水の吸収を高めることができます。不利な気候条件と土地の劣化の増加が、農業における最新技術の採用を後押しし、製品需要に影響を及ぼすと予測されます。
形態別では、2032年まで液体形態が大きな勢いを見せるでしょう。液体バイオ肥料の生産は、従来の担体ベースの生産と比較して、有能で高度な技術です。また、液体バイオ肥料は、特定の有益な微生物を含むバクテリア溶液であり、有機物を通して植物の栄養素の放出、固定、可溶化を助ける。
地域的には、アジア太平洋のバイオ肥料産業は、2032年の間に強い利益を獲得することになるでしょう。土壌と作物の栄養バランスを維持するためにカリの使用が増加していることが、この地域の産業の成長を後押ししています。また、土壌の健康維持と作物生産の向上に役立つ有機肥料を採用する農家の意識を高めるために、さまざまな中央政府による取り組みが増加しており、この地域の市場展望にプラスの影響を与えると考えられます。
目次
第1章 調査手法とスコープ
第2章 エグゼクティブサマリー
第3章 バイオ肥料の業界洞察
- バイオ肥料産業のセグメント化
- COVID-19の発生別影響について
- 産業エコシステム分析
- 原材料の分析
- 各ステージでの付加価値
- ディストリビューターチャネル分析
- 政府
- バリューチェーン
- 利益率分析
- ベンダーマトリクス
- バイオ肥料製造のための現在および計画中のプラントの概要
- バイオ肥料と肥料の比較分析
- 種子施用における生物学的製剤の比較分析
- 農薬市場の概要
- 耕作地データ(地域別
- 需要・供給シナリオ
- 動向と機会
- 食の安全・品質への要求が高まる
- GM作物の採用
- 技術動向
- バイオ肥料と他の有機物投入との比較
- 有機肥料と無機肥料の比較
- 肥料・農薬
- 業界のベストプラクティスと主要な購入基準
- 化学肥料と伝統的な肥料に対する顧客の嗜好
- レギュレーションと製品購入
- 2010年植物・肥料法(法律第803号)
- 規則(EC)No 1107/2009-植物保護製品のEU市場投入
- 1997年農業用化合物および動物用医薬品法(ACVM)
- 製品価格分析
- 化学肥料とバイオ肥料の肥料コストの比較
- テクノロジー情勢
- 現在のバイオ肥料の製造手順の概要
- バイオ肥料の製造
- マザーカルチャーやスターターカルチャーの調製
- ブロス培養物の調製
- キャリアの調製
- 接種物の調製i.e.ミキシング
- 熟成のためのキュアリング
- 充填・包装
- 品質チェック
- ストレージ
- 貿易統計(2014年~2016年
- 従来型肥料の市場需要の現状と予測
- 原材料動向
- ニーム
- 糞尿
- バガス
- 規制状況
- 米国
- 欧州
- 中国
- 価格分析
- 地域別価格動向
- コスト構造分析
- 研究開発費
- 製造・設備費
- 原材料費
- 流通コスト
- 営業費用
- 雑費
- 業界への影響要因
- 促進要因
- 有機農業や土壌肥沃度管理の実践におけるバイオ肥料の採用の増加
- 環境意識の高まりと耕作地の喪失
- バイオベース農業資材の普及に向けた規制対応
- 業界の潜在的リスク&課題
- 合成肥料の需要増
- 促進要因
- 成長性分析
- バイオ肥料市場:微生物別
- アゾスピリリウム
- アゾトバクター
- リン酸可溶化菌
- 根粒菌
- その他
- バイオ肥料市場:微生物別
- ポーター分析
- PESTEL分析
- 用途別のバイオ肥料の需要に対するCOVID-19のインパクト
- ロシア・ウクライナ戦争がバイオ肥料市場に与える影響
第4章 競合情勢、2022年
- イントロダクション
- 企業シェア分析、2022年地域別
- 北米のバイオ肥料市場シェア分析2022年
- 欧州バイオ肥料市場シェア分析2022年
- アジア太平洋のバイオ肥料市場シェア分析2022年
- ラテンアメリカのバイオ肥料市場シェア分析2022年
- MEAバイオ肥料市場シェア分析2022年
- ベンダー採用マトリクス、2022年
- トップ企業の概要
- 戦略ダッシュボード
第5章 バイオ肥料市場:製品別
- 主な製品動向
- 窒素固定
- リン酸可溶化
- カリ動員
- その他
第6章 バイオ肥料市場:用途別
- 主な用途動向
- 種子処理
- 土壌処理
- その他
第7章 バイオ肥料市場:形態別
- 主な形態動向
- 乾燥
- 液体
第8章 バイオ肥料市場:作物別
- 主な作物動向
- 穀物・穀類
- 豆類・油糧種子
- フルーツ・野菜
- その他
第9章 バイオ肥料市場:地域別
- 主な地域動向
- 北米
- 米国
- カナダ
- 欧州
- ドイツ
- 英国
- フランス
- スペイン
- イタリア
- ウクライナ
- カザフスタン
- トルコ
- ブルガリア
- ギリシア
- ロシア
- アジア太平洋地域
- 中国
- インド
- 日本
- オーストラリア
- マレーシア
- インドネシア
- 韓国
- ラテンアメリカ
- ブラジル
- メキシコ
- アルゼンチン
- 中東・アフリカ地域
- 南アフリカ
- サウジアラビア
- エジプト
- チュニジア
第10章 企業プロファイル
- Agri Life
- Rizobacter
- National Fertilizers Limited
- Jay Enterprises
- Novozymes
- Gizatec
- Chema Industries
- Cairochem
- Kimitec Group
- Madras Fertilizers Limited
- Ajay Bio-Tech(India)Ltd.
- Gujarat State Fertilizers & Chemicals Limited
- Symborg SL
- Rashtriya Chemicals & Fertilizers Ltd.
- Maharashtra Bio Fertilizers Pvt. Ltd.
- Lallemand Inc.
- Mapleton Agri Biotec Pty Ltd
- Biomax Naturals
- SKS Bioproducts Pvt. Ltd.
- Sushila Biofertilizer Company(SuBiCo)Pvt. Ltd
- Saosis Biotech Private Limited
- Camson Bio Technologies Limited
- Koppert B.V.
- Nutramax Laboratories, Inc.
- CBF China Bio-Fertilizer AG
- Criyagen
- Bharat Biocon
- Glaze Trading India Pvt. Ltd.
- Bodisen Biotech, Inc.
- Kiwa Bio-Tech Products Group Corporation
- T Stanes & Company Limited
- Agro-Bio Trading
Biofertilizers Market is anticipated to witness strong demand during 2023-2032, owing to the increasing emphasis on environmental awareness. Increasing initiatives and efforts taken by the government to transition to organic or natural-based farming will drive the biofertilizers market size. Besides, extensive research activities for reducing the environmental effects caused by agrochemicals will fuel the industry growth.
Besides, excessive and inappropriate application of synthetic manures has contaminated and polluted the soil and water basins. Although chemical fertilizers support plant growth, they are not beneficial for the soil as they do not improve the health or structure of the soil.
Overall, the biofertilizers industry is segmented in terms of product, application, crop, form, and region.
Based on the product, the potash-mobilizing bacteria segment will grow considerably during 2023-2032. Potash mobilizing bacteria play various roles in soil and plant growth and are essential for converting ammonium ions into proteins and amino acids. Additionally, the product possess a dynamic role in the uptake of additional calcium, nitrogen, and phosphorous nutrients.
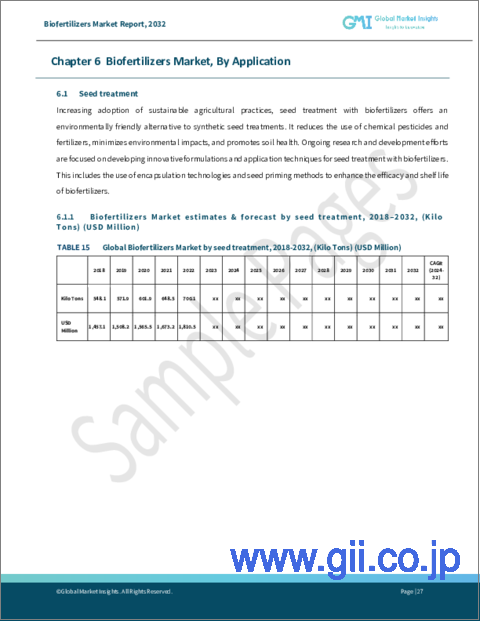
By application, the soil treatment segment will witness significant growth through 2032 owing to its several benefits for retaining the soil's natural environment. The macro- and micronutrients increase the soil's fertility. Biofertilizers interact with salinity and are crucial for plant growth and development.
In terms of crops, the pulses & oil seeds segment was valued at over USD 220 million in 2022. The segmental growth can be credited to the growing use of biofertilizers in the production of pulses and oilseeds over the forecast period. Besides, biofertilizers offer significant atmospheric nitrogen and suitable phosphorous content for pulse production. It also contains micronutrients, which keep soils biologically active and increase water absorption for pulse production. Unfavourable climatic conditions and increasing land degradation are projected to push the adoption of modern technologies in the agricultural industry, influencing the product demand.
By form, the liquid form segment will observe significant momentum through 2032. Production of liquid biofertilizers is a capable and advanced technology compared to traditional carrier-based production. Besides, liquid biofertilizers are bacterial solutions containing certain beneficial microorganisms that aid in releasing, fixing, and solubilizing plant nutrients through their organic matter.
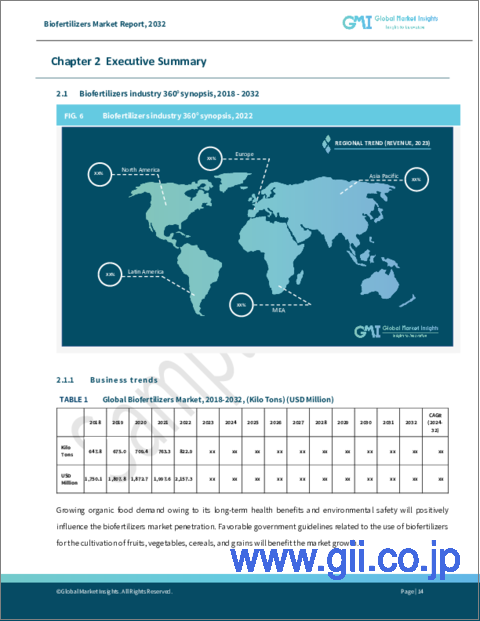
Regionally, the Asia Pacific biofertilizers industry will garner strong gains during 2032. Increasing use of potash to maintain the nutritional balance in the soil and crops will bolster the industry growth across the region. Besides, increasing initiatives taken by various central governments to generate awareness among farmers for adopting organic fertilizers, which will help maintain the soil's health and improve crop production, will positively influence the regional market outlook.
Table of Contents
Chapter 1 Methodology & Scope
- 1.1 Scope & Market definitions
- 1.2 Methodology & forecast parameters
- 1.3 COVID-19 impact calculations on the industry forecast
- 1.3.1 North America
- 1.3.2 Europe
- 1.3.3 Asia Pacific
- 1.3.4 Latin America
- 1.3.5 Middle East & Africa
- 1.4 Regional trends
- 1.5 Data sources
- 1.5.1 Primary
- 1.5.2 Secondary
- 1.5.2.1 Paid sources
- 1.5.2.2 Public sources
Chapter 2 Executive Summary
- 2.1 Biofertilizer market 360 degree synopsis, 2018 - 2032
- 2.1.1 Business trends
- 2.1.2 Product trends
- 2.1.3 Application trends
- 2.1.4 Crop trends
- 2.1.5 Form trends
- 2.1.6 Regional trends
Chapter 3 Biofertilizers Industry Insights
- 3.1 Biofertilizers Industry segmentation
- 3.2 Impact of COVID-19 outbreak
- 3.3 Industry ecosystem analysis
- 3.3.1 Raw material analysis
- 3.3.2 Value addition at each stage
- 3.3.3 Distributor channel analysis
- 3.3.3.1 Government
- 3.3.4 Value chain
- 3.3.5 Profit margin analysis
- 3.3.6 Vendor matrix
- 3.3.6.1 Overview of current and planned plants for biofertilizers production
- 3.4 Comparative analysis of biofertilizers vs fertilizers
- 3.5 Comparative analysis of biological agents in seed application
- 3.6 Agrochemicals market overview
- 3.6.1 Global agrochemicals market estimates & forecast, 2018 - 2032
- 3.6.2 Arable land data, by region
- 3.6.3 Demand & supply scenario
- 3.6.4 Trends & opportunities
- 3.6.4.1 Increased demand for food safety and quality
- 3.6.4.2 Adoption of GM crops
- 3.6.4.3 Technological trends
- 3.7 Comparison of biofertilizer with respect to other organic inputs
- 3.7.1 Organic vs inorganic fertilizer
- 3.7.2 Fertilizers and pesticides
- 3.7.3 Industry best practices & key buying criteria
- 3.7.3.1 Customer preference over chemical vs traditional fertilizers
- 3.7.3.2 Regulations & product purchasing
- 3.7.3.2.1 Plants and Fertilizer Act, 2010 (Act 803)
- 3.7.3.2.2 Regulation (EC) No 1107/2009 - the placing of plant protection products on the EU market
- 3.7.3.2.3 The Agricultural Compounds and Veterinary Medicines Act 1997 (ACVM)
- 3.7.4 Product pricing analysis
- 3.7.5 Comparison of fertilizer cost between chemical and bio-fertilizer
- 3.8 Technology landscape
- 3.8.1 Current biofertilizers production procedures overview
- 3.8.2 Manufacturing of biofertilizers
- 3.8.3 Preparation of mother or starter cultures
- 3.8.4 Preparation of broth cultures
- 3.8.5 Preparation of carrier
- 3.8.6 Preparation of inoculate i.e. mixing
- 3.8.7 Curing for maturation
- 3.8.8 Filling and packing
- 3.8.9 Quality checking
- 3.8.10 Storage
- 3.9 Trade statistics, 2014-2016
- 3.9.1 North America
- 3.9.2 Europe
- 3.9.3 Asia Pacific
- 3.9.4 Latin America
- 3.9.5 MEA
- 3.10 Current & projected market demand for conventional fertilizer
- 3.11 Raw material trends
- 3.11.1 Neem
- 3.11.2 Manure
- 3.11.3 Bagasse
- 3.12 Regulatory landscape
- 3.12.1 U.S.
- 3.12.2 Europe
- 3.12.3 China
- 3.13 Pricing analysis
- 3.13.1 Regional price trends
- 3.13.2 Cost structure analysis
- 3.13.2.1 R&D cost
- 3.13.2.2 Manufacturing & equipment cost
- 3.13.2.3 Raw material cost
- 3.13.2.4 Distribution cost
- 3.13.2.5 Operating cost
- 3.13.2.6 Miscellaneous cost
- 3.14 Industry impact forces
- 3.14.1 Growth drivers
- 3.14.1.1 Increasing adoption of biofertilizers in organic farming and soil fertility management practices
- 3.14.1.2 Rising environmental awareness and loss of arable land
- 3.14.1.3 Regulatory compliance to promote bio-based agricultural inputs
- 3.14.2 Industry pitfalls & challenges
- 3.14.2.1 Higher demand for synthetic fertilizers
- 3.14.1 Growth drivers
- 3.15 Growth potential analysis
- 3.15.1 Biofertilizers market, by microorganism
- 3.15.1.1 Azospirillium
- 3.15.1.2 Azotobacter
- 3.15.1.3 Phosphate-solubilizing bacteria
- 3.15.1.4 Rhizobium
- 3.15.1.5 Others
- 3.15.1 Biofertilizers market, by microorganism
- 3.16 Porter's analysis
- 3.17 PESTEL analysis
- 3.18 COVID-19 impact on demand for the biofertilizers by applications
- 3.19 Impact of Russia Ukraine war on biofertilizers market
Chapter 4 Competitive Landscape, 2022
- 4.1 Introduction
- 4.2 Introduction
- 4.3 Company market share analysis, by region 2022
- 4.3.1 North America biofertilizers market share analysis 2022
- 4.3.2 Europe biofertilizers market share analysis 2022
- 4.3.3 Asia Pacific biofertilizers market share analysis 2022
- 4.3.4 Latin America biofertilizers market share analysis 2022
- 4.3.5 MEA biofertilizers market share analysis 2022
- 4.4 Vendor adoption matrix, 2022
- 4.5 Top player overview
- 4.6 Strategy Dashboard
Chapter 5 Biofertilizers Market, By Product
- 5.1 Key product trends
- 5.2 Nitrogen-fixing
- 5.2.1 Market estimates and forecast, 2018 - 2032
- 5.2.2 Market estimates and forecast by region, 2018 - 2032
- 5.3 Phosphate-solubilizing
- 5.3.1 Market estimates and forecast, 2018 - 2032
- 5.3.2 Market estimates and forecast by region, 2018 - 2032
- 5.4 Potash-mobilizing
- 5.4.1 Market estimates and forecast, 2018 - 2032
- 5.4.2 Market estimates and forecast by region, 2018 - 2032
- 5.5 Others
- 5.5.1 Market estimates and forecast, 2018 - 2032
- 5.5.2 Market estimates and forecast by region, 2018 - 2032
Chapter 16 Biofertilizers Market, By Application
- 6.1 Key application trends
- 6.2 Seed treatment
- 6.2.1 Market estimates and forecast, 2018 - 2032
- 6.2.2 Market estimates and forecast by region, 2018 - 2032
- 6.3 Soil treatment
- 6.3.1 Market estimates and forecast, 2018 - 2032
- 6.3.2 Market estimates and forecast by region, 2018 - 2032
- 6.4 Others
- 6.4.1 Market estimates and forecast, 2018 - 2032
- 6.4.2 Market estimates and forecast by region, 2018 - 2032
Chapter 7 Biofertilizers Market, By Form
- 7.1 Key form trends
- 7.2 Dry
- 7.2.1 Market estimates and forecast, 2018 - 2032
- 7.2.2 Market estimates and forecast by region, 2018 - 2032
- 7.3 Liquid
- 7.3.1 Market estimates and forecast, 2018 - 2032
- 7.3.2 Market estimates and forecast by region, 2018 - 2032
Chapter 8 Biofertilizers Market, By Crop
- 8.1 Key crop trends
- 8.2 Cereals & grains
- 8.2.1 Market estimates and forecast, 2018 - 2032
- 8.2.2 Market estimates and forecast by region, 2018 - 2032
- 8.3 Pulses & oil seeds
- 8.3.1 Market estimates and forecast, 2018 - 2032
- 8.3.2 Market estimates and forecast by region, 2018 - 2032
- 8.4 Fruits & vegetables
- 8.4.1 Market estimates and forecast, 2018 - 2032
- 8.4.2 Market estimates and forecast by region, 2018 - 2032
- 8.5 Others
- 8.5.1 Market estimates and forecast, 2018 - 2032
- 8.5.2 Market estimates and forecast by region, 2018 - 2032
Chapter 9 Biofertilizers Market, By Region
- 9.1 Key region trends
- 9.2 North America
- 9.2.1 Market estimates and forecast, 2018 - 2032
- 9.2.2 Market estimates and forecast, by product, 2018 - 2032
- 9.2.3 Market estimates and forecast by application, 2018 - 2032
- 9.2.4 Market estimates and forecast by form, 2018 - 2032
- 9.2.5 Market estimates and forecast by crop, 2018 - 2032
- 9.2.6 U.S.
- 9.2.6.1 Market estimates and forecast, 2018 - 2032
- 9.2.6.2 Market estimates and forecast, by product, 2018 - 2032
- 9.2.6.3 Market estimates and forecast by application, 2018 - 2032
- 9.2.6.4 Market estimates and forecast by form, 2018 - 2032
- 9.2.6.5 Market estimates and forecast by crop, 2018 - 2032
- 9.2.7 Canada
- 9.2.7.1 Market estimates and forecast, 2018 - 2032
- 9.2.7.2 Market estimates and forecast, by product, 2018 - 2032
- 9.2.7.3 Market estimates and forecast by application, 2018 - 2032
- 9.2.7.4 Market estimates and forecast by form, 2018 - 2032
- 9.2.7.5 Market estimates and forecast by crop, 2018 - 2032
- 9.3 Europe
- 9.3.1 Market estimates and forecast, 2018 - 2032
- 9.3.2 Market estimates and forecast, by product, 2018 - 2032
- 9.3.3 Market estimates and forecast by application, 2018 - 2032
- 9.3.4 Market estimates and forecast by form, 2018 - 2032
- 9.3.5 Market estimates and forecast by crop, 2018 - 2032
- 9.3.6 Germany
- 9.3.6.1 Market estimates and forecast, 2018 - 2032
- 9.3.6.2 Market estimates and forecast, by product, 2018 - 2032
- 9.3.6.3 Market estimates and forecast by application, 2018 - 2032
- 9.3.6.4 Market estimates and forecast by form, 2018 - 2032
- 9.3.6.5 Market estimates and forecast by crop, 2018 - 2032
- 9.3.7 UK
- 9.3.7.1 Market estimates and forecast, 2018 - 2032
- 9.3.7.2 Market estimates and forecast, by product, 2018 - 2032
- 9.3.7.3 Market estimates and forecast by application, 2018 - 2032
- 9.3.7.4 Market estimates and forecast by form, 2018 - 2032
- 9.3.7.5 Market estimates and forecast by crop, 2018 - 2032
- 9.3.8 France
- 9.3.8.1 Market estimates and forecast, 2018 - 2032
- 9.3.8.2 Market estimates and forecast, by product, 2018 - 2032
- 9.3.8.3 Market estimates and forecast by application, 2018 - 2032
- 9.3.8.4 Market estimates and forecast by form, 2018 - 2032
- 9.3.8.5 Market estimates and forecast by crop, 2018 - 2032
- 9.3.9 Spain
- 9.3.9.1 Market estimates and forecast, 2018 - 2032
- 9.3.9.2 Market estimates and forecast, by product, 2018 - 2032
- 9.3.9.3 Market estimates and forecast by application, 2018 - 2032
- 9.3.9.4 Market estimates and forecast by form, 2018 - 2032
- 9.3.9.5 Market estimates and forecast by crop, 2018 - 2032
- 9.3.10 Italy
- 9.3.10.1 Market estimates and forecast, 2018 - 2032
- 9.3.10.2 Market estimates and forecast, by product, 2018 - 2032
- 9.3.10.3 Market estimates and forecast by application, 2018 - 2032
- 9.3.10.4 Market estimates and forecast by form, 2018 - 2032
- 9.3.10.5 Market estimates and forecast by crop, 2018 - 2032
- 9.3.11 Ukraine
- 9.3.11.1 Market estimates and forecast, 2018 - 2032
- 9.3.11.2 Market estimates and forecast, by product, 2018 - 2032
- 9.3.11.3 Market estimates and forecast by application, 2018 - 2032
- 9.3.11.4 Market estimates and forecast by form, 2018 - 2032
- 9.3.11.5 Market estimates and forecast by crop, 2018 - 2032
- 9.3.12 Kazakhstan
- 9.3.12.1 Market estimates and forecast, 2018 - 2032
- 9.3.12.2 Market estimates and forecast, by product, 2018 - 2032
- 9.3.12.3 Market estimates and forecast by application, 2018 - 2032
- 9.3.12.4 Market estimates and forecast by form, 2018 - 2032
- 9.3.12.5 Market estimates and forecast by crop, 2018 - 2032
- 9.3.13 Turkey
- 9.3.13.1 Market estimates and forecast, 2018 - 2032
- 9.3.13.2 Market estimates and forecast, by product, 2018 - 2032
- 9.3.13.3 Market estimates and forecast by application, 2018 - 2032
- 9.3.13.4 Market estimates and forecast by form, 2018 - 2032
- 9.3.13.5 Market estimates and forecast by crop, 2018 - 2032
- 9.3.14 Bulgaria
- 9.3.14.1 Market estimates and forecast, 2018 - 2032
- 9.3.14.2 Market estimates and forecast, by product, 2018 - 2032
- 9.3.14.3 Market estimates and forecast by application, 2018 - 2032
- 9.3.14.4 Market estimates and forecast by form, 2018 - 2032
- 9.3.14.5 Market estimates and forecast by crop, 2018 - 2032
- 9.3.15 Greece
- 9.3.15.1 Market estimates and forecast, 2018 - 2032
- 9.3.15.2 Market estimates and forecast, by product, 2018 - 2032
- 9.3.15.3 Market estimates and forecast by application, 2018 - 2032
- 9.3.15.4 Market estimates and forecast by form, 2018 - 2032
- 9.3.15.5 Market estimates and forecast by crop, 2018 - 2032
- 9.3.16 Russia
- 9.3.16.1 Market estimates and forecast, 2018 - 2032
- 9.3.16.2 Market estimates and forecast, by product, 2018 - 2032
- 9.3.16.3 Market estimates and forecast by application, 2018 - 2032
- 9.3.16.4 Market estimates and forecast by form, 2018 - 2032
- 9.3.16.5 Market estimates and forecast by crop, 2018 - 2032
- 9.4 Asia Pacific
- 9.4.1 Market estimates and forecast, 2018 - 2032
- 9.4.2 Market estimates and forecast, by product, 2018 - 2032
- 9.4.3 Market estimates and forecast by application, 2018 - 2032
- 9.4.4 Market estimates and forecast by form, 2018 - 2032
- 9.4.5 Market estimates and forecast by crop, 2018 - 2032
- 9.4.6 China
- 9.4.6.1 Market estimates and forecast, 2018 - 2032
- 9.4.6.2 Market estimates and forecast, by product, 2018 - 2032
- 9.4.6.3 Market estimates and forecast by application, 2018 - 2032
- 9.4.6.4 Market estimates and forecast by form, 2018 - 2032
- 9.4.6.5 Market estimates and forecast by crop, 2018 - 2032
- 9.4.7 India
- 9.4.7.1 Market estimates and forecast, 2018 - 2032
- 9.4.7.2 Market estimates and forecast, by product, 2018 - 2032
- 9.4.7.3 Market estimates and forecast by application, 2018 - 2032
- 9.4.7.4 Market estimates and forecast by form, 2018 - 2032
- 9.4.7.5 Market estimates and forecast by crop, 2018 - 2032
- 9.4.8 Japan
- 9.4.8.1 Market estimates and forecast, 2018 - 2032
- 9.4.8.2 Market estimates and forecast, by product, 2018 - 2032
- 9.4.8.3 Market estimates and forecast by application, 2018 - 2032
- 9.4.8.4 Market estimates and forecast by form, 2018 - 2032
- 9.4.8.5 Market estimates and forecast by crop, 2018 - 2032
- 9.4.9 Australia
- 9.4.9.1 Market estimates and forecast, 2018 - 2032
- 9.4.9.2 Market estimates and forecast, by product, 2018 - 2032
- 9.4.9.3 Market estimates and forecast by application, 2018 - 2032
- 9.4.9.4 Market estimates and forecast by form, 2018 - 2032
- 9.4.9.5 Market estimates and forecast by crop, 2018 - 2032
- 9.4.10 Malaysia
- 9.4.10.1 Market estimates and forecast, 2018 - 2032
- 9.4.10.2 Market estimates and forecast, by product, 2018 - 2032
- 9.4.10.3 Market estimates and forecast by application, 2018 - 2032
- 9.4.10.4 Market estimates and forecast by form, 2018 - 2032
- 9.4.10.5 Market estimates and forecast by crop, 2018 - 2032
- 9.4.11 Indonesia
- 9.4.11.1 Market estimates and forecast, 2018 - 2032
- 9.4.11.2 Market estimates and forecast, by product, 2018 - 2032
- 9.4.11.3 Market estimates and forecast by application, 2018 - 2032
- 9.4.11.4 Market estimates and forecast by form, 2018 - 2032
- 9.4.11.5 Market estimates and forecast by crop, 2018 - 2032
- 9.4.12 South Korea
- 9.4.12.1 Market estimates and forecast, 2018 - 2032
- 9.4.12.2 Market estimates and forecast, by product, 2018 - 2032
- 9.4.12.3 Market estimates and forecast by application, 2018 - 2032
- 9.4.12.4 Market estimates and forecast by form, 2018 - 2032
- 9.4.12.5 Market estimates and forecast by crop, 2018 - 2032
- 9.5 Latin America
- 9.5.1 Market estimates and forecast, 2018 - 2032
- 9.5.2 Market estimates and forecast, by product, 2018 - 2032
- 9.5.3 Market estimates and forecast by application, 2018 - 2032
- 9.5.4 Market estimates and forecast by form, 2018 - 2032
- 9.5.5 Market estimates and forecast by crop, 2018 - 2032
- 9.5.6 Brazil
- 9.5.6.1 Market estimates and forecast, 2018 - 2032
- 9.5.6.2 Market estimates and forecast, by product, 2018 - 2032
- 9.5.6.3 Market estimates and forecast by application, 2018 - 2032
- 9.5.6.4 Market estimates and forecast by form, 2018 - 2032
- 9.5.6.5 Market estimates and forecast by crop, 2018 - 2032
- 9.5.7 Mexico
- 9.5.7.1 Market estimates and forecast, 2018 - 2032
- 9.5.7.2 Market estimates and forecast, by product, 2018 - 2032
- 9.5.7.3 Market estimates and forecast by application, 2018 - 2032
- 9.5.7.4 Market estimates and forecast by form, 2018 - 2032
- 9.5.7.5 Market estimates and forecast by crop, 2018 - 2032
- 9.5.8 Argentina
- 9.5.8.1 Market estimates and forecast, 2018 - 2032
- 9.5.8.2 Market estimates and forecast, by product, 2018 - 2032
- 9.5.8.3 Market estimates and forecast by application, 2018 - 2032
- 9.5.8.4 Market estimates and forecast by form, 2018 - 2032
- 9.5.8.5 Market estimates and forecast by crop, 2018 - 2032
- 9.6 Middle East & Africa
- 9.6.1 Market estimates and forecast, 2018 - 2032
- 9.6.2 Market estimates and forecast, by product, 2018 - 2032
- 9.6.3 Market estimates and forecast by application, 2018 - 2032
- 9.6.4 Market estimates and forecast by form, 2018 - 2032
- 9.6.5 Market estimates and forecast by crop, 2018 - 2032
- 9.6.6 South Africa
- 9.6.6.1 Market estimates and forecast, 2018 - 2032
- 9.6.6.2 Market estimates and forecast, by product, 2018 - 2032
- 9.6.6.3 Market estimates and forecast by application, 2018 - 2032
- 9.6.6.4 Market estimates and forecast by form, 2018 - 2032
- 9.6.6.5 Market estimates and forecast by crop, 2018 - 2032
- 9.6.7 Saudi Arabia
- 9.6.7.1 Market estimates and forecast, 2018 - 2032
- 9.6.7.2 Market estimates and forecast, by product, 2018 - 2032
- 9.6.7.3 Market estimates and forecast by application, 2018 - 2032
- 9.6.7.4 Market estimates and forecast by form, 2018 - 2032
- 9.6.7.5 Market estimates and forecast by crop, 2018 - 2032
- 9.6.8 Egypt
- 9.6.8.1 Market estimates and forecast, 2018 - 2032
- 9.6.8.2 Market estimates and forecast, by product, 2018 - 2032
- 9.6.8.3 Market estimates and forecast by application, 2018 - 2032
- 9.6.8.4 Market estimates and forecast by form, 2018 - 2032
- 9.6.8.5 Market estimates and forecast by crop, 2018 - 2032
- 9.6.9 Tunisia
- 9.6.9.1 Market estimates and forecast, 2018 - 2032
- 9.6.9.2 Market estimates and forecast, by product, 2018 - 2032
- 9.6.9.3 Market estimates and forecast by application, 2018 - 2032
- 9.6.9.4 Market estimates and forecast by form, 2018 - 2032
- 9.6.9.5 Market estimates and forecast by crop, 2018 - 2032
Chapter 10 Company Profiles
- 10.1 Agri Life
- 10.1.1 Business Overview
- 10.1.2 Financial Data
- 10.1.3 Product Landscape
- 10.1.4 Strategic Outlook
- 10.1.5 SWOT Analysis
- 10.2 Rizobacter
- 10.2.1 Business Overview
- 10.2.2 Financial Data
- 10.2.3 Product Landscape
- 10.2.4 Strategic Outlook
- 10.2.5 SWOT Analysis
- 10.3 National Fertilizers Limited
- 10.3.1 Business Overview
- 10.3.2 Financial Data
- 10.3.3 Product Landscape
- 10.3.4 Strategic Outlook
- 10.3.5 SWOT Analysis
- 10.4 Jay Enterprises
- 10.4.1 Business Overview
- 10.4.2 Financial Data
- 10.4.3 Product Landscape
- 10.4.4 Strategic Outlook
- 10.4.5 SWOT Analysis
- 10.5 Novozymes
- 10.5.1 Business Overview
- 10.5.2 Financial Data
- 10.5.3 Product Landscape
- 10.5.4 Strategic Outlook
- 10.5.5 SWOT Analysis
- 10.6 Gizatec
- 10.6.1 Business Overview
- 10.6.2 Financial Data
- 10.6.3 Product Landscape
- 10.6.4 Strategic Outlook
- 10.6.5 SWOT Analysis
- 10.7 Chema Industries
- 10.7.1 Business Overview
- 10.7.2 Financial Data
- 10.7.3 Product Landscape
- 10.7.4 Strategic Outlook
- 10.7.5 SWOT Analysis
- 10.8 Cairochem
- 10.8.1 Business Overview
- 10.8.2 Financial Data
- 10.8.3 Product Landscape
- 10.8.4 Strategic Outlook
- 10.8.5 SWOT Analysis
- 10.9 Kimitec Group
- 10.9.1 Business Overview
- 10.9.2 Financial Data
- 10.9.3 Product Landscape
- 10.9.4 Strategic Outlook
- 10.9.5 SWOT Analysis
- 10.10 Madras Fertilizers Limited
- 10.10.1 Business Overview
- 10.10.2 Financial Data
- 10.10.3 Product Landscape
- 10.10.4 Strategic Outlook
- 10.10.5 SWOT Analysis
- 10.11 Ajay Bio-Tech (India) Ltd.
- 10.11.1 Business Overview
- 10.11.2 Financial Data
- 10.11.3 Product Landscape
- 10.11.4 Strategic Outlook
- 10.11.5 SWOT Analysis
- 10.12 Gujarat State Fertilizers & Chemicals Limited
- 10.12.1 Business Overview
- 10.12.2 Financial Data
- 10.12.3 Product Landscape
- 10.12.4 Strategic Outlook
- 10.12.5 SWOT Analysis
- 10.13 Symborg SL
- 10.13.1 Business Overview
- 10.13.2 Financial Data
- 10.13.3 Product Landscape
- 10.13.4 Strategic Outlook
- 10.13.5 SWOT Analysis
- 10.14 Rashtriya Chemicals & Fertilizers Ltd.
- 10.14.1 Business Overview
- 10.14.2 Financial Data
- 10.14.3 Product Landscape
- 10.14.4 Strategic Outlook
- 10.14.5 SWOT Analysis
- 10.15 Maharashtra Bio Fertilizers Pvt. Ltd.
- 10.15.1 Business Overview
- 10.15.2 Financial Data
- 10.15.3 Product Landscape
- 10.15.4 Strategic Outlook
- 10.15.5 SWOT Analysis
- 10.16 Lallemand Inc.
- 10.16.1 Business Overview
- 10.16.2 Financial Data
- 10.16.3 Product Landscape
- 10.16.4 Strategic Outlook
- 10.16.5 SWOT Analysis
- 10.17 Mapleton Agri Biotec Pty Ltd
- 10.17.1 Business Overview
- 10.17.2 Financial Data
- 10.17.3 Product Landscape
- 10.17.4 Strategic Outlook
- 10.17.5 SWOT Analysis
- 10.18 Biomax Naturals
- 10.18.1 Business Overview
- 10.18.2 Financial Data
- 10.18.3 Product Landscape
- 10.18.4 Strategic Outlook
- 10.18.5 SWOT Analysis
- 10.19 SKS Bioproducts Pvt. Ltd.
- 10.19.1 Business Overview
- 10.19.2 Financial Data
- 10.19.3 Product Landscape
- 10.19.4 Strategic Outlook
- 10.19.5 SWOT Analysis
- 10.20 Sushila Biofertilizer Company (SuBiCo) Pvt. Ltd
- 10.20.1 Business Overview
- 10.20.2 Financial Data
- 10.20.3 Product Landscape
- 10.20.4 Strategic Outlook
- 10.20.5 SWOT Analysis
- 10.21 Saosis Biotech Private Limited
- 10.21.1 Business Overview
- 10.21.2 Financial Data
- 10.21.3 Product Landscape
- 10.21.4 Strategic Outlook
- 10.21.5 SWOT Analysis
- 10.22 Camson Bio Technologies Limited
- 10.22.1 Business Overview
- 10.22.2 Financial Data
- 10.22.3 Product Landscape
- 10.22.4 Strategic Outlook
- 10.22.5 SWOT Analysis
- 10.23 Koppert B.V.
- 10.23.1 Business Overview
- 10.23.2 Financial Data
- 10.23.3 Product Landscape
- 10.23.4 Strategic Outlook
- 10.23.5 SWOT Analysis
- 10.24 Nutramax Laboratories, Inc.
- 10.24.1 Business Overview
- 10.24.2 Financial Data
- 10.24.3 Product Landscape
- 10.24.4 Strategic Outlook
- 10.24.5 SWOT Analysis
- 10.25 CBF China Bio-Fertilizer AG
- 10.25.1 Business Overview
- 10.25.2 Financial Data
- 10.25.3 Product Landscape
- 10.25.4 Strategic Outlook
- 10.25.5 SWOT Analysis
- 10.26 Criyagen
- 10.26.1 Business Overview
- 10.26.2 Financial Data
- 10.26.3 Product Landscape
- 10.26.4 Strategic Outlook
- 10.26.5 SWOT Analysis
- 10.27 Bharat Biocon
- 10.27.1 Business Overview
- 10.27.2 Financial Data
- 10.27.3 Product Landscape
- 10.27.4 Strategic Outlook
- 10.27.5 SWOT Analysis
- 10.28 Glaze Trading India Pvt. Ltd.
- 10.28.1 Business Overview
- 10.28.2 Financial Data
- 10.28.3 Product Landscape
- 10.28.4 Strategic Outlook
- 10.28.5 SWOT Analysis
- 10.29 Bodisen Biotech, Inc.
- 10.29.1 Business Overview
- 10.29.2 Financial Data
- 10.29.3 Product Landscape
- 10.29.4 Strategic Outlook
- 10.29.5 SWOT Analysis
- 10.30 Kiwa Bio-Tech Products Group Corporation
- 10.30.1 Business Overview
- 10.30.2 Financial Data
- 10.30.3 Product Landscape
- 10.30.4 Strategic Outlook
- 10.30.5 SWOT Analysis
- 10.31 T Stanes & Company Limited
- 10.31.1 Business Overview
- 10.31.2 Financial Data
- 10.31.3 Product Landscape
- 10.31.4 Strategic Outlook
- 10.31.5 SWOT Analysis
- 10.32 Agro-Bio Trading
- 10.32.1 Business Overview
- 10.32.2 Financial Data
- 10.32.3 Product Landscape
- 10.32.4 Strategic Outlook
- 10.32.5 SWOT Analysis