
デジタルセラピューティクスの市場機会、成長促進要因、産業動向分析、2024~2032年予測
Digital Therapeutics Market Opportunity, Growth Drivers, Industry Trend Analysis, and Forecast 2024 - 2032- 発行日
- ページ情報
- 英文 150 Pages
- 納期
- 2~3営業日
- 商品コード
- 1858982
- カスタマイズ可能 お客様のご希望に応じて、既存データの加工や未掲載情報(例:国別セグメント)の追加などの対応が可能です。詳細はお問い合わせください。
- 翻訳ツール提供対象 PDF対応AI翻訳ツールの無料貸し出しサービスのご利用が可能です
デジタルセラピューティクスの世界市場規模は2024年に77億米ドルとなり、CAGR 25.7%で成長し、2034年には754億米ドルに達すると推定されます。
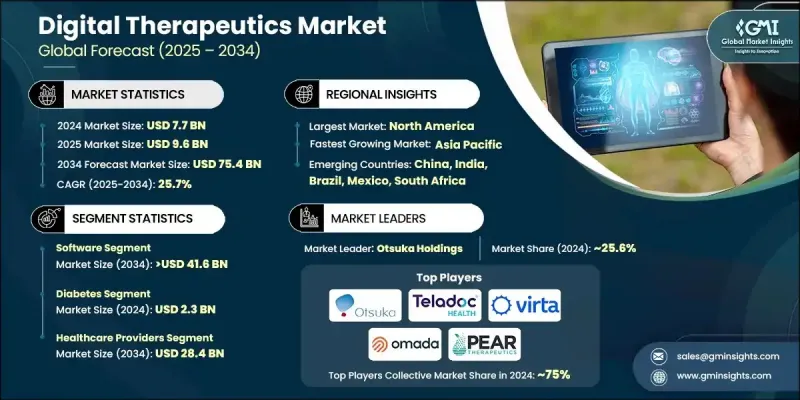
成長の原動力となっているのは、心血管疾患、糖尿病、精神疾患などの慢性疾患の世界的な有病率の上昇です。このようなヘルスケアにおける継続的な課題が、コスト効率に優れ、スケーラブルで個別化された治療法を提供するデジタルセラピューティクスの需要を促進しています。これらのソフトウェア主導型医療介入は、アドヒアランス、患者の転帰、エンゲージメントを改善する人工知能、ウェアラブル、ゲーミフィケーション、行動健康ツールとの統合が進んでいます。単独で、あるいは従来の治療と連携して機能するように設計されたこれらのツールは、現代ヘルスケアの礎となりつつあります。医療提供者や患者が柔軟で非侵襲的なソリューションを求めるようになるにつれ、デジタルセラピューティクスの魅力はますます高まっています。臨床的に証明された結果をもたらすと同時に、全体的な医療コストを削減するその能力は、雇用者、保険者、公的医療システムにとって特に魅力的なものとなっています。支払者からの支持の高まりと、主要市場における規制当局の受け入れ拡大により、代謝性疾患からメンタルヘルスに至るまで、治療分野における開発と展開がさらに加速しています。
| 市場範囲 | |
|---|---|
| 開始年 | 2024 |
| 予測年 | 2025-2034 |
| 市場規模 | 77億米ドル |
| 予測金額 | 754億米ドル |
| CAGR | 25.7% |
ソフトウェア分野は2024年に54.3%のシェアを占め、2034年にはCAGR 25.9%の成長率で416億米ドルに達すると予測されます。このセグメントには、ユーザーデータ、行動動向、AI主導のアルゴリズムに基づいてオーダーメイドの治療介入を可能にするオンプレミス型とクラウド型のプラットフォームが含まれます。これらのソリューションは、習慣形成や慢性疾患管理を促進するだけでなく、スマートフォン、コンピューター、タブレットなどのデジタル機器にまたがる拡張性とアクセス可能性により、広く採用されています。アクセスが容易になり、継続的な治療を遠隔で提供できるようになったことで、ソフトウェアベースのデジタルセラピューティクスは予防や継続的な治療の枠組みで好まれるモデルとなっています。
糖尿病分野は、2024年に23億米ドルを生み出しました。1型糖尿病、2型糖尿病、妊娠糖尿病など、あらゆる糖尿病の罹患率の増加が、リアルタイムのモニタリングと持続可能なライフスタイルの変更を可能にするツールに対する需要の高まりに寄与しています。デジタルセラピューティクスは、行動コーチング、グルコース追跡、服薬リマインダー、分析に基づく洞察など、オーダーメイドの介入を提供し、長期的な糖尿病ケア計画における重要なコンポーネントとして位置づけられています。このセグメントは、代謝健康管理におけるDTxに対する患者の認識と臨床的認知の高まりから恩恵を受け続けています。
北米デジタルセラピューティクス2024年のシェアは58.1%。同地域の強力なヘルスケアインフラ、慢性疾患の有病率の上昇、有利な規制状況が採用を後押ししています。米国とカナダでは、雇用主が従業員の健康増進と保険料削減のため、職場のウェルネス戦略にDTxプラットフォームを取り入れるケースが増えています。さらに、保険償還が広く利用可能であり、技術導入が堅調であることが、DTxの主流臨床およびウェルネス環境への統合を後押ししています。
デジタルセラピューティクス世界市場の主要企業は、Teladoc Health、Virta Health、LifeScan、Hyfe、Omada Health、Akili Interactive、Pear Therapeutics、Orexo、Otsuka Holdings、Click Therapeutics、Propeller Health(ResMed)、AmerisourceBergenです。デジタルセラピューティクス企業はプレゼンスを強化するため、支払者、製薬会社、医療システムとの戦略的パートナーシップに注力し、リーチを広げ、償還の適用範囲を確保しています。多くの企業は、AI、機械学習、リアルタイムの患者モニタリングを使用してプラットフォームの機能を強化するために研究開発に多額の投資を行いながら、新興市場に参入するためにグローバルな販売網を拡大しています。規制当局の承認は依然として優先事項であり、企業はより迅速な承認を得るために当局と緊密に連携しています。電子カルテや遠隔医療プラットフォームとの統合も、相互運用性と患者エンゲージメントの向上を目指した中核的な取り組みです。
よくあるご質問
目次
第1章 調査手法と範囲
第2章 エグゼクティブサマリー
第3章 業界考察
- エコシステム分析
- 業界への影響要因
- 促進要因
- 慢性疾患の増加
- コスト抑制に対する需要の高まり
- クオリティ・オブ・ケア提供の拡大
- 高まるデジタルセラピューティクスの人気
- 業界の潜在的リスク&課題
- データ・セキュリティとプライバシーへの懸念
- 熟練ITプロフェッショナルの不足
- 市場機会
- 予防医療とバリューベース医療へのシフトの高まり
- 併用療法モデルの拡大
- 促進要因
- 成長可能性分析
- 規制情勢
- 北米
- 米国
- カナダ
- 欧州
- アジア太平洋地域
- ラテンアメリカ
- 中東・アフリカ
- 北米
- テクノロジー・情勢
- 現在の技術動向
- 新興技術
- 今後の市場動向
- ポーター分析
- PESTEL分析
第4章 競合情勢
- イントロダクション
- 企業の市場シェア分析
- グローバル
- 北米
- 欧州
- 企業マトリックス分析
- 主要市場企業の競合分析
- 競合ポジショニングマトリックス
- 主な発展
- 合併と買収
- パートナーシップとコラボレーション
- 新製品発表
- 拡張計画
第5章 市場推計・予測:コンポーネント別、2021-2034
- 主要動向
- ソフトウェア
- オンプレミス
- クラウドベース
- ハードウェア
- ウェアラブルデバイス
- センサーおよびモニタリング機器
- その他のデバイス
- サービス
- コンサルティングとインテグレーション
- トレーニングと教育
- その他のサービス
第6章 市場推計・予測:用途別、2021-2034
- 主要動向
- 糖尿病
- 肥満
- 心血管
- 精神・行動健康
- 高血圧症
- 不眠症
- その他の用途
第7章 市場推計・予測:最終用途別、2021-2034
- 主要動向
- ヘルスケアプロバイダー
- 病院
- 診療所
- テレヘルスプラットフォーム
- 支払者
- 患者
- その他のエンドユース
第8章 市場推計・予測:地域別、2021-2034
- 主要動向
- 北米
- 米国
- カナダ
- 欧州
- ドイツ
- 英国
- フランス
- スペイン
- イタリア
- オランダ
- アジア太平洋地域
- 中国
- インド
- 日本
- オーストラリア
- 韓国
- ラテンアメリカ
- ブラジル
- メキシコ
- アルゼンチン
- 中東・アフリカ
- 南アフリカ
- サウジアラビア
- アラブ首長国連邦
第9章 企業プロファイル
- AmerisourceBergen
- Akili Interactive
- Click Therapeutics
- Hyfe
- LifeScan
- Omada Health
- Orexo
- Otsuka Holdings
- Pear Therapeutics
- Propeller Health(ResMed)
- Teladoc Health
- Virta Health
- 発行日
- 発行
- Global Market Insights Inc.
- ページ情報
- 英文 150 Pages
- 納期
- 2~3営業日

