
|
市場調査レポート
商品コード
1667005
トラクションバッテリー市場の機会、成長促進要因、産業動向分析、2025~2034年の予測Traction Battery Market Opportunity, Growth Drivers, Industry Trend Analysis, and Forecast 2025 - 2034 |
||||||
カスタマイズ可能
|
|||||||
| トラクションバッテリー市場の機会、成長促進要因、産業動向分析、2025~2034年の予測 |
|
出版日: 2024年12月06日
発行: Global Market Insights Inc.
ページ情報: 英文 80 Pages
納期: 2~3営業日
|

全表示
- 概要
- 目次
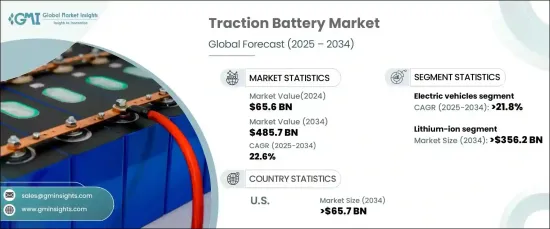
トラクションバッテリーの世界市場は、2024年に656億米ドルと評価され、2025年から2034年にかけて22.6%のCAGRで堅調に成長すると予測されています。
トラクションバッテリーは、再生可能エネルギーシステムの重要なコンポーネントとして、特にエネルギー効率とグリッドの信頼性を高める役割で脚光を浴びています。これらの電池は、車両への電力供給とエネルギー貯蔵ソリューションとしての役割という2つの目的を果たすことで、クリーンエネルギーの移行をサポートします。その統合は、再生可能エネルギー・インフラと持続可能なエネルギー管理の実践に重点を置く地域にとって不可欠です。
技術の進歩がトラクションバッテリー市場の進化を促し、バッテリー材料と化学物質の革新が性能を大幅に向上させています。リチウムイオン電池は、その高いエネルギー密度、耐久性、効率により、現在市場をリードしています。ソリッド・ステート・バッテリーのような新技術は、安全機能の強化と充電の高速化を実現し、将来のアプリケーションの強力な代替品として位置づけられています。メーカー各社はまた、シリコン負極やコバルトフリー正極を採用した電池を開発することで持続可能なソリューションを模索しており、コスト削減と環境への影響の最小化を目指しています。
| 市場範囲 | |
|---|---|
| 開始年 | 2024 |
| 予測年 | 2025-2034 |
| 開始金額 | 656億米ドル |
| 予測金額 | 4,857億米ドル |
| CAGR | 22.6% |
電池化学分野別では、リチウムイオン分野が著しい成長を遂げ、2034年には市場規模3,562億米ドルに達すると予想されます。この成長の促進要因となっているのは、特に持続可能なエネルギー用途を中心に、産業界全体で高度なバッテリーソリューションに対する需要が高まっていることです。リチウムイオン電池の優れた性能は、費用効率が高く環境に優しい設計の継続的な研究と相まって、市場での地位を強化しています。
用途別では、トラクションバッテリー市場は輸送セクターで大幅な拡大が見られます。持続可能なモビリティ・ソリューションへのシフトが、より厳しい排出政策と環境に優しい代替品への意識の高まりが勢いを増すにつれて、これらの電池の採用を促進しています。エネルギー貯蔵能力の向上、充電の高速化、寿命の延長など、バッテリー技術の一貫した改良が、輸送分野における効率的なエネルギー・ソリューションのニーズの高まりを支えています。
地域別では、米国がトラクション・バッテリー市場を独占し、2034年までに657億米ドルを超えると予想されています。持続可能なエネルギー戦略への強い関心が、有利な政府の取り組みや技術革新と相まって、市場の成長を後押ししています。高度なバッテリー技術の開発は、エネルギー効率を高め、より広範な環境目標に沿うものです。
目次
第1章 調査手法と調査範囲
- 市場の定義
- 基本推定と計算
- 予測計算
- データソース
- 1次データ
- 2次データ
- 有償
- 公的
第2章 エグゼクティブサマリー
第3章 業界洞察
- エコシステム分析
- 規制状況
- 業界への影響要因
- 促進要因
- 業界の潜在的リスク&課題
- 成長可能性分析
- ポーターの分析
- 供給企業の交渉力
- 買い手の交渉力
- 新規参入業者の脅威
- 代替品の脅威
- PESTEL分析
第4章 競合情勢
- 戦略ダッシュボード
- イノベーションと持続可能性の展望
第5章 市場規模・予測:化学分野別、2021年~2034年
- 主要動向
- 鉛酸
- リチウムイオン
- ニッケルベース
- その他
第6章 市場規模・予測:用途別、2021年~2034年
- 主要動向
- 電気自動車
- BEV
- PHEV
- 産業用
- フォークリフト
- 鉄道
- その他
- Eバイク
- Eスクーター
- Eモーターサイクル
第7章 市場規模・予測:地域別、2021年~2034年
- 主要動向
- 北米
- 米国
- カナダ
- メキシコ
- 欧州
- 英国
- フランス
- ドイツ
- イタリア
- ロシア
- スペイン
- アジア太平洋
- 中国
- オーストラリア
- インド
- 日本
- 韓国
- 中東・アフリカ
- サウジアラビア
- アラブ首長国連邦
- トルコ
- 南アフリカ
- エジプト
- ラテンアメリカ
- ブラジル
- アルゼンチン
第8章 企業プロファイル
- Aliant Battery
- Amara Raja Batteries
- BYD
- Camel Group
- Ecovolta
- EnerSys
- Exide Industries
- Farasis Energy
- Guoxuan High-tech Power Energy
- Hitachi Energy
- Hoppecke Batteries
- LG Energy
- Midac
- Mutlu
- Panasonic
- Samsung
- Sunwoda Electronic
- Toshiba
The Global Traction Battery Market, valued at USD 65.6 billion in 2024, is projected to grow at a robust CAGR of 22.6% from 2025 to 2034. Traction batteries are gaining prominence as a critical component of renewable energy systems, especially for their role in enhancing energy efficiency and grid reliability. These batteries support clean energy transitions by serving dual purposes-powering vehicles and acting as energy storage solutions. Their integration is vital for regions focusing on renewable energy infrastructure and sustainable energy management practices.
Advancements in technology are driving the evolution of the traction battery market, with innovations in battery materials and chemistries significantly improving performance. Lithium-ion batteries currently lead the market due to their high energy density, durability, and efficiency. Emerging technologies, such as solid-state batteries, offer enhanced safety features and faster charging, positioning them as a strong alternative for future applications. Manufacturers are also exploring sustainable solutions by developing batteries with silicon anodes and cobalt-free cathodes, which aim to reduce costs and minimize environmental impact.
| Market Scope | |
|---|---|
| Start Year | 2024 |
| Forecast Year | 2025-2034 |
| Start Value | $65.6 Billion |
| Forecast Value | $485.7 Billion |
| CAGR | 22.6% |
By battery chemistry, the lithium-ion segment is expected to experience remarkable growth, reaching a market size of USD 356.2 billion by 2034. This growth is fueled by increasing demand for advanced battery solutions across industries, especially for sustainable energy applications. The superior performance of lithium-ion batteries, combined with ongoing research into cost-efficient and environmentally friendly designs, strengthens their position in the market.
In terms of application, the traction battery market is witnessing significant expansion in the transportation sector. The shift toward sustainable mobility solutions has driven higher adoption of these batteries as stricter emission policies and increased awareness of eco-friendly alternatives gain momentum. The consistent improvement in battery technology, including better energy storage capacity, faster charging, and enhanced lifespan, supports the growing need for efficient energy solutions in the transportation sector.
Regionally, the U.S. is expected to dominate the traction battery market, surpassing USD 65.7 billion by 2034. A strong focus on sustainable energy strategies, coupled with favorable government initiatives and technological innovations, is propelling market growth. The development of advanced battery technologies continues to enhance energy efficiency and align with broader environmental goals.
Table of Contents
Chapter 1 Methodology & Scope
- 1.1 Market definition
- 1.2 Base estimates & calculations
- 1.3 Forecast calculation
- 1.4 Data sources
- 1.4.1 Primary
- 1.4.2 Secondary
- 1.4.2.1 Paid
- 1.4.2.2 Public
Chapter 2 Executive Summary
- 2.1 Industry synopsis, 2021 – 2034
Chapter 3 Industry Insights
- 3.1 Industry ecosystem analysis
- 3.2 Regulatory landscape
- 3.3 Industry impact forces
- 3.3.1 Growth drivers
- 3.3.2 Industry pitfalls & challenges
- 3.4 Growth potential analysis
- 3.5 Porter's analysis
- 3.5.1 Bargaining power of suppliers
- 3.5.2 Bargaining power of buyers
- 3.5.3 Threat of new entrants
- 3.5.4 Threat of substitutes
- 3.6 PESTEL analysis
Chapter 4 Competitive landscape, 2024
- 4.1 Strategic dashboard
- 4.2 Innovation & sustainability landscape
Chapter 5 Market Size and Forecast, By Chemistry, 2021 – 2034 (USD Million)
- 5.1 Key trends
- 5.2 Lead acid
- 5.3 Lithium-ion
- 5.4 Nickel-based
- 5.5 Others
Chapter 6 Market Size and Forecast, By Application, 2021 – 2034 (USD Million)
- 6.1 Key trends
- 6.2 Electric vehicles
- 6.2.1 BEV
- 6.2.2 PHEV
- 6.3 Industrial
- 6.3.1 Forklifts
- 6.3.2 Railroads
- 6.3.3 Others
- 6.4 E-bike
- 6.4.1 E-scooters
- 6.4.2 E-motorcycles
Chapter 7 Market Size and Forecast, By Region, 2021 – 2034 (USD million)
- 7.1 Key trends
- 7.2 North America
- 7.2.1 U.S.
- 7.2.2 Canada
- 7.2.3 Mexico
- 7.3 Europe
- 7.3.1 UK
- 7.3.2 France
- 7.3.3 Germany
- 7.3.4 Italy
- 7.3.5 Russia
- 7.3.6 Spain
- 7.4 Asia Pacific
- 7.4.1 China
- 7.4.2 Australia
- 7.4.3 India
- 7.4.4 Japan
- 7.4.5 South Korea
- 7.5 Middle East & Africa
- 7.5.1 Saudi Arabia
- 7.5.2 UAE
- 7.5.3 Turkey
- 7.5.4 South Africa
- 7.5.5 Egypt
- 7.6 Latin America
- 7.6.1 Brazil
- 7.6.2 Argentina
Chapter 8 Company Profiles
- 8.1 Aliant Battery
- 8.2 Amara Raja Batteries
- 8.3 BYD
- 8.4 Camel Group
- 8.5 Ecovolta
- 8.6 EnerSys
- 8.7 Exide Industries
- 8.8 Farasis Energy
- 8.9 Guoxuan High-tech Power Energy
- 8.10 Hitachi Energy
- 8.11 Hoppecke Batteries
- 8.12 LG Energy
- 8.13 Midac
- 8.14 Mutlu
- 8.15 Panasonic
- 8.16 Samsung
- 8.17 Sunwoda Electronic
- 8.18 Toshiba

