
|
市場調査レポート
商品コード
1699279
固体電池市場の機会、成長促進要因、産業動向分析、2025年~2034年の予測Solid State Battery Market Opportunity, Growth Drivers, Industry Trend Analysis, and Forecast 2025-2034 |
||||||
カスタマイズ可能
|
|||||||
| 固体電池市場の機会、成長促進要因、産業動向分析、2025年~2034年の予測 |
|
出版日: 2025年02月18日
発行: Global Market Insights Inc.
ページ情報: 英文 109 Pages
納期: 2~3営業日
|

全表示
- 概要
- 目次
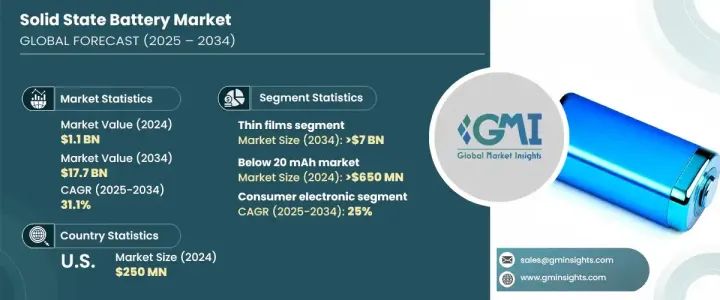
世界の固体電池市場は、2024年には11億米ドルに達し、2025年から2034年にかけてCAGR 31.1%で成長すると予測され、大幅な拡大が見込まれています。
新興経済圏で電気自動車の普及が進み、高度な電池技術への投資が増加していることが、この成長を後押ししています。これらの電池は、優れたエネルギー密度、安全性の向上、急速充電機能を提供し、複数の産業で非常に望ましいものとなっています。この市場は、ポリマー、酸化物、硫化物などの固体電解質材料の継続的な進歩によってさらに恩恵を受け、電池の性能と寿命が向上しています。
特に、ウェアラブル、スマートフォン、IoTデバイスが普及しているコンシューマー・エレクトロニクスでは、コンパクトで大容量のパワー・ソリューションに対する需要が急増しています。研究開発に対する政府資金や民間投資の流入と、主要市場プレーヤー間の戦略的パートナーシップにより、技術革新が加速しています。自動車メーカーやテクノロジー企業は、生産能力の拡大に積極的に取り組んでおり、こうした次世代電池の迅速な展開を確実なものにしています。固体電解質技術は経年劣化を最小限に抑え、電池寿命を大幅に向上させる。さらに、イオンの移動度が高いため、わずか10~15分で満充電を達成できる能力は、効率性とダウンタイムの削減を必要とする用途において大きな利点となります。
| 市場範囲 | |
|---|---|
| 開始年 | 2024 |
| 予測年 | 2025-2034 |
| 開始金額 | 11億米ドル |
| 予測金額 | 177億米ドル |
| CAGR | 31.1% |
市場は製品別にポータブル電池と薄膜電池に分類されます。家電、自動車、グリッド・ストレージなどの業界では、これらの技術を急速に統合しており、幅広い普及を促進しています。容量別では、20mAh未満、20~500mAh、500mAh以上のカテゴリーに分類されます。20mAh未満セグメントは2024年に6億5,000万米ドル超を占め、持続可能性への取り組みの増加、安全性の重視の高まり、研究開発投資の増加に支えられています。
用途別では、市場は自動車、産業、家電、エネルギー貯蔵に区分されます。民生用電子機器分野は、コンパクトで高性能な電池への旺盛な需要を反映して、2024年の評価額が4億5,000万米ドル超に達しました。一方、産業用分野は2034年までCAGR 25%で成長すると予測されており、さまざまな分野で使用事例が拡大していることを示しています。
米国のソリッドステート・バッテリー市場は2024年に2億5,000万米ドルと評価され、大手自動車メーカーによる最先端バッテリー技術への多額の投資がその原動力となっています。メーカーや研究機関が電池の寿命、イオン伝導性、電解液の安定性といった重要課題の解決に取り組んでいることから、より広範な北米市場は2034年までCAGR 30%で拡大すると予想されます。このような開発により、競合情勢は再構築され、今後10年間の業界情勢は勢いを増すことになります。
目次
第1章 調査手法と調査範囲
- 市場範囲と定義
- 市場推計・予測パラメータ
- 予測計算
- データソース
第2章 エグゼクティブサマリー
第3章 業界洞察
- エコシステム分析
- 規制状況
- 業界への影響要因
- 促進要因
- 業界の潜在的リスク&課題
- 成長可能性分析
- ポーター分析
- PESTEL分析
第4章 競合情勢
- イントロダクション
- 戦略的展望
- イノベーションと持続可能性の展望
第5章 市場規模・予測:製品別、2021年~2034年
- 主要動向
- ポータブル
- 薄膜
第6章 市場規模・予測:容量別、2021年~2034年
- 主要動向
- 20mAh未満
- 20~500mAh
- 500mAh以上
第7章 市場規模・予測:用途別、2021~2034年
- 主要動向
- 産業
- 自動車
- コンシューマーエレクトロニクス
- エネルギー貯蔵
- その他
第8章 市場規模・予測:地域別、2021年~2034年
- 主要動向
- 北米
- 米国
- カナダ
- メキシコ
- 欧州
- ドイツ
- 英国
- フランス
- イタリア
- スペイン
- オーストリア
- スウェーデン
- アジア太平洋
- 中国
- 日本
- 韓国
- インド
- オーストラリア
- 世界のその他の地域
- ブラジル
- UAE
- サウジアラビア
- その他
第9章 企業プロファイル
- Beijing WELION New Energy Technology
- Factorial
- Honda Motor
- Ilika
- Ion Storage Systems
- ITEN
- Johnson Energy Storage
- Kanadevia Corporation
- LG Energy Solution
- Nissan
- QuantumScape Battery
- Samsung
- Solid Power
- STMicroelectronics
- Toyota
The Global Solid State Battery Market is poised for significant expansion, with its valuation reaching USD 1.1 billion in 2024 and projected to grow at a CAGR of 31.1% from 2025 to 2034. The rising adoption of electric vehicles across emerging economies and increasing investment in advanced battery technologies are key drivers fueling this growth. These batteries offer superior energy density, enhanced safety, and rapid charging capabilities, making them highly desirable across multiple industries. The market is further benefiting from continuous advancements in solid electrolyte materials, including polymers, oxides, and sulfides, which enhance battery performance and longevity.
Demand is surging for compact, high-capacity power solutions, especially in consumer electronics, where wearables, smartphones, and IoT devices are becoming more prevalent. The influx of government funding and private investments in research and development, along with strategic partnerships among key market players, is accelerating technological innovation. Automakers and technology firms are actively working to scale up production capacities, ensuring a faster rollout of these next-generation batteries. Their solid-state electrolyte technology minimizes degradation over time, significantly improving battery lifespan. Additionally, their ability to achieve full charge in just 10 to 15 minutes due to higher ion mobility is a major advantage in applications requiring efficiency and reduced downtime.
| Market Scope | |
|---|---|
| Start Year | 2024 |
| Forecast Year | 2025-2034 |
| Start Value | $1.1 Billion |
| Forecast Value | $17.7 Billion |
| CAGR | 31.1% |
The market is categorized by product into portable and thin-film batteries. Industries such as consumer electronics, automotive, and grid storage are rapidly integrating these technologies, driving broader adoption. By capacity, the market is divided into Below 20 mAh, 20-500 mAh, and above 500 mAh categories. The Below 20 mAh segment accounted for over USD 650 million in 2024, supported by increasing sustainability efforts, a growing emphasis on safety, and rising R&D investments.
In terms of application, the market is segmented into automotive, industrial, consumer electronics, and energy storage. The consumer electronics segment reached a valuation of over USD 450 million in 2024, reflecting strong demand for compact, high-performance batteries. Meanwhile, the industrial segment is projected to grow at a CAGR of 25% through 2034, indicating expanding use cases in various sectors.
The U.S. solid-state battery market was valued at USD 250 million in 2024, driven by substantial investments from major automakers in cutting-edge battery technologies. The broader North American market is anticipated to expand at a CAGR of 30% through 2034 as manufacturers and research institutions work to address critical challenges such as battery lifespan, ionic conductivity, and electrolyte stability. These developments are set to reshape the competitive landscape and drive industry momentum over the coming decade.
Table of Contents
Chapter 1 Methodology & Scope
- 1.1 Market scope & definitions
- 1.2 Market estimates & forecast parameters
- 1.3 Forecast calculation
- 1.4 Data sources
- 1.4.1 Primary
- 1.4.2 Secondary
- 1.4.2.1 Paid
- 1.4.2.2 Public
Chapter 2 Executive Summary
- 2.1 Industry synopsis, 2021 - 2034
Chapter 3 Industry Insights
- 3.1 Industry ecosystem analysis
- 3.2 Regulatory landscape
- 3.3 Industry impact forces
- 3.3.1 Growth drivers
- 3.3.2 Industry pitfalls & challenges
- 3.4 Growth potential analysis
- 3.5 Porter's Analysis
- 3.5.1 Bargaining power of suppliers
- 3.5.2 Bargaining power of buyers
- 3.5.3 Threat of new entrants
- 3.5.4 Threat of substitutes
- 3.6 PESTEL Analysis
Chapter 4 Competitive Landscape, 2024
- 4.1 Introduction
- 4.2 Strategic outlook
- 4.3 Innovation & sustainability landscape
Chapter 5 Market Size and Forecast, By Product, 2021 – 2034 (USD Million)
- 5.1 Key trends
- 5.2 Portable
- 5.3 Thin-film
Chapter 6 Market Size and Forecast, By Capacity, 2021 – 2034 (USD Million)
- 6.1 Key trends
- 6.2 Below 20 mAh
- 6.3 20 - 500 mAh
- 6.4 Above 500 mAh
Chapter 7 Market Size and Forecast, By Application, 2021 – 2034 (USD Million)
- 7.1 Key trends
- 7.2 Industrial
- 7.3 Automotive
- 7.4 Consumer electronics
- 7.5 Energy storage
- 7.6 Others
Chapter 8 Market Size and Forecast, By Region, 2021 – 2034 (USD Million)
- 8.1 Key trends
- 8.2 North America
- 8.2.1 U.S.
- 8.2.2 Canada
- 8.2.3 Mexico
- 8.3 Europe
- 8.3.1 Germany
- 8.3.2 UK
- 8.3.3 France
- 8.3.4 Italy
- 8.3.5 Spain
- 8.3.6 Austria
- 8.3.7 Sweden
- 8.4 Asia Pacific
- 8.4.1 China
- 8.4.2 Japan
- 8.4.3 South Korea
- 8.4.4 India
- 8.4.5 Australia
- 8.5 Rest of World
- 8.5.1 Brazil
- 8.5.2 UAE
- 8.5.3 Saudi Arabia
- 8.5.4 Others
Chapter 9 Company Profiles
- 9.1 Beijing WELION New Energy Technology
- 9.2 Factorial
- 9.3 Honda Motor
- 9.4 Ilika
- 9.5 Ion Storage Systems
- 9.6 ITEN
- 9.7 Johnson Energy Storage
- 9.8 Kanadevia Corporation
- 9.9 LG Energy Solution
- 9.10 Nissan
- 9.11 QuantumScape Battery
- 9.12 Samsung
- 9.13 Solid Power
- 9.14 STMicroelectronics
- 9.15 Toyota

