
バイオリアクター市場における機会、成長要因、業界動向分析、および2026年から2035年までの予測
Bioreactors Market Opportunity, Growth Drivers, Industry Trend Analysis, and Forecast 2026 - 2035- 発行日
- ページ情報
- 英文 140 Pages
- 納期
- 2~3営業日
- 商品コード
- 1936603
- カスタマイズ可能 お客様のご希望に応じて、既存データの加工や未掲載情報(例:国別セグメント)の追加などの対応が可能です。詳細はお問い合わせください。
- 翻訳ツール提供対象 PDF対応AI翻訳ツールの無料貸し出しサービスのご利用が可能です
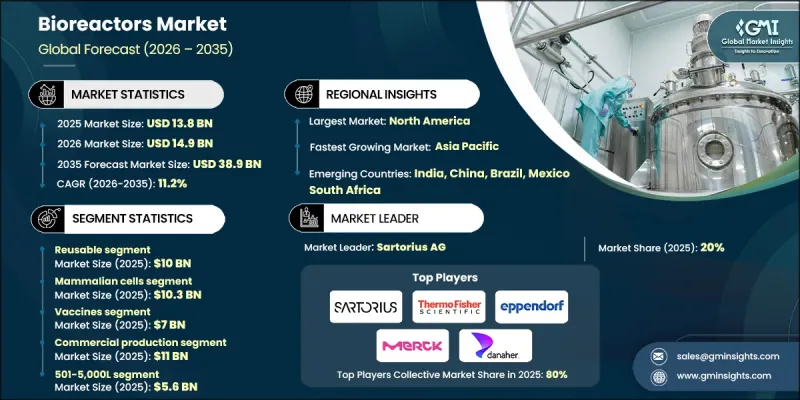
世界のバイオリアクター市場は、2025年に138億米ドルと評価され、2035年までにCAGR 11.2%で成長し、389億米ドルに達すると予測されています。
この成長は、製薬・バイオテクノロジー分野の拡大、バイオリアクターシステムの技術革新、個別化医療や先進治療法への需要増加によって牽引されています。バイオリアクターは、ワクチン、モノクローナル抗体、細胞治療薬の製造において中核的な役割を担っており、慢性疾患の増加や革新的な治療法の追求により、これらの製品に対する需要が高まっています。遺伝子工学、再生医療、バイオシミラーの進歩により、製品品質を維持しつつ大規模生産を支える、拡張性・効率性・規制適合性を兼ね備えたバイオリアクターシステムの必要性が高まっています。規制面の優遇措置のもと、希少疾患治療薬として開発が進むバイオロジクスやオーファンドラッグに企業が注力する中、シングルユースシステム、自動化プラットフォーム、その他の先進バイオリアクター技術への投資が活発化しています。これらの要因が相まって、バイオリアクターは現代のバイオ製造において不可欠な存在となっています。
| 市場範囲 | |
|---|---|
| 開始年 | 2025年 |
| 予測年度 | 2026-2035 |
| 開始時価値 | 138億米ドル |
| 予測金額 | 389億米ドル |
| CAGR | 11.2% |
再利用可能なバイオリアクター分野は、2025年に100億米ドルに達しました。再利用可能なバイオリアクターは、複数の生産サイクルにわたって滅菌・再利用が可能であるため、費用対効果の高さから大規模生産に好まれます。その耐久性と汎用性により、多様な製造条件下での運用が可能であり、これはバイオ医薬品生産における高収率で複雑なプロセスにとって極めて重要です。これらの特長により、再利用可能なシステムは、品質を損なうことなく大量バッチを管理することが不可欠な、効率的な生物学的製剤製造の基盤となっています。
哺乳類細胞セグメントは2025年に103億米ドルの市場規模を記録しました。哺乳類細胞は、ヒト細胞の挙動を再現し治療上の安全性と有効性を確保するため、モノクローナル抗体、組換えタンパク質、ワクチンなどの複雑な生物学的製剤の生産に広く利用されています。これらの細胞は、温度、pH、酸素濃度、栄養素の利用可能性などの環境パラメータに非常に敏感です。バイオリアクターは細胞の成長と生産性を最適化する制御された条件を提供し、先進的治療法の開発に不可欠な存在です。
米国バイオリアクター市場は2025年に47億米ドルと評価されました。この拡大は、同国の先進的な製薬・バイオテクノロジー産業、生物学的製剤への投資増加、個別化医療の普及拡大によって推進されています。バイオリアクターは、ワクチン、モノクローナル抗体、遺伝子治療の高品質かつ大規模な生産を可能にし、米国産業が高度な生物学的製剤や先進的な治療ソリューションへと移行する動きを支えています。
よくあるご質問
目次
第1章 調査手法と範囲
第2章 エグゼクティブサマリー
第3章 業界考察
- エコシステム分析
- 業界への影響要因
- 促進要因
- 成長を続ける製薬・バイオテクノロジー産業
- バイオリアクターにおける技術的進歩
- 希少疾病用医薬品開発への注目の高まり
- 個別化医療への需要の高まり
- 業界の潜在的リスク&課題
- シングルユースバイオリアクターの低容量
- 抽出物および溶出物に関する懸念事項
- 市場機会
- 新規医療応用に向けた精密発酵技術
- 促進要因
- 成長可能性分析
- 規制情勢
- 技術的進歩
- 現在の技術動向
- 新興技術
- 価格分析、2024
- 将来の市場動向
- ポーター分析
- PESTEL分析
第4章 競合情勢
- イントロダクション
- 企業の市場シェア分析
- 企業マトリクス分析
- 主要市場企業の競合分析
- 競合ポジショニングマトリックス
- 主な発展
- 合併・買収
- 提携および共同事業
- 新製品の発売
- 拡大計画
第5章 市場推計・予測:製品タイプ別、2022-2035
- 使い捨て(プラスチック製)
- 再利用可能
第6章 市場推計・予測:細胞別、2022-2035
- 哺乳類細胞
- 細菌細胞
- 酵母細胞
- その他の細胞
第7章 市場推計・予測:分子別、2022-2035
- モノクローナル抗体
- ワクチン
- 組換えタンパク質
- 幹細胞
- 遺伝子治療
- その他の分子
第8章 市場推計・予測用途別、2022-2035
- 開発段階、非臨床試験及び臨床試験段階
- 商業生産
第9章 市場推計・予測:素材別、2022-2035
- ステンレス鋼
- ガラス
- 使い捨て
第10章 市場推計・予測:容量別、2022-2035
- 500リットル未満
- 501~5,000リットル
- 5,000リットル超
第11章 市場推計・予測:最終用途別、2022-2035
- 研究開発機関
- バイオ医薬品メーカー
- 受託製造機関(CMO)
第12章 市場推計・予測:地域別、2022-2035
- 北米
- 米国
- カナダ
- 欧州
- ドイツ
- 英国
- フランス
- スペイン
- イタリア
- オランダ
- アジア太平洋地域
- 中国
- インド
- 日本
- オーストラリア
- 韓国
- ラテンアメリカ
- ブラジル
- メキシコ
- アルゼンチン
- 中東・アフリカ
- サウジアラビア
- 南アフリカ
- アラブ首長国連邦
第13章 企業プロファイル
- Altrad Group
- BaiLun Biotechnology Co., Ltd
- Bbi-biotech
- Cellexus
- CerCell A/S
- Danaher Corporation
- Donaldson Company, Inc
- Eppendorf Group
- Esco Micro Pte. Ltd.
- GEA Group Aktiengesellschaft
- Getinge AB
- Merck KGaA
- PBS Biotech, Inc.
- Sartorius AG
- Thermo Fisher Scientific Inc.
- 発行日
- 発行
- Global Market Insights Inc.
- ページ情報
- 英文 140 Pages
- 納期
- 2~3営業日