|
|
市場調査レポート
商品コード
1164841
アジア太平洋地域のセラミックファイバー市場 (2023年~2032年):市場規模 (製品・形状・温度定格・用途・エンドユーザー別)・地域別展望・用途の潜在性・価格動向・競合市場シェア・予測Asia Pacific Ceramic Fiber Market Size By Product, Form, Temperature Rating, Application, End-user Industry, Industry Analysis Report, Regional Outlook, Application Growth Potential, Price Trends, Competitive Market Share & Forecast, 2023 - 2032 |
||||||
|
|
|||||||
|
● お客様のご希望に応じて、既存データの加工や未掲載情報(例:国別セグメント)の追加などの対応が可能です。 詳細はお問い合わせください。 |
|||||||


| アジア太平洋地域のセラミックファイバー市場 (2023年~2032年):市場規模 (製品・形状・温度定格・用途・エンドユーザー別)・地域別展望・用途の潜在性・価格動向・競合市場シェア・予測 |
|
出版日: 2022年11月25日
発行: Global Market Insights Inc.
ページ情報: 英文 359 Pages
納期: 2~3営業日
|
- 全表示
- 概要
- 図表
- 目次
アジア太平洋地域のセラミックファイバーの市場は、代替エネルギーソリューションやその他の用途でのセラミックファイバーへの需要の増加により、2032年にかけて安定した成長を示すと予測されています。
セラミックファイバーに関連するさまざまな利点に対する意識の高まりも同市場の成長を拡大させる可能性があります。
形状別では、さまざまな温度定格、厚さ、密度、長さ、幅や、特注の真空成形形状で利用できることから、ボードの部門が予測期間中に大きく成長すると予測されています。一方、低熱伝導率、温度安定性、軽量、低熱貯蔵などの有益な特性により、紙の部門は2023年から2032年にかけてCAGR 6.5%で成長すると予想されています。
当レポートでは、アジア太平洋地域のセラミックファイバーの市場を調査し、市場概要、市場成長への各種影響因子の分析、法規制環境、イノベーション・持続可能性の情勢、市場規模の推移・予測、各種区分・主要国別の内訳、競合環境、主要企業のプロファイルなどをまとめています。
目次
第1章 調査手法・調査範囲
第2章 エグゼクティブサマリー
第3章 アジア太平洋地域のセラミックファイバー産業の考察
- 産業の分類
- 産業規模と予測
- 産業エコシステム分析
- イノベーション・持続可能性
- 産業への影響要因
- 促進要因
- 潜在的リスク&課題
- 規制動向
- 成長性分析
- 地域の価格動向
- ポーターの分析
- PESTEL分析
- COVID-19がエンドユーザーのセラミックファイバー需要に与える影響
- ロシア・ウクライナ戦争がアジア太平洋地域のセラミックファイバー市場に与える影響
第4章 競合情勢
- 企業の市場シェア
- 主要企業の競合分析
- ベンダー採用マトリックス
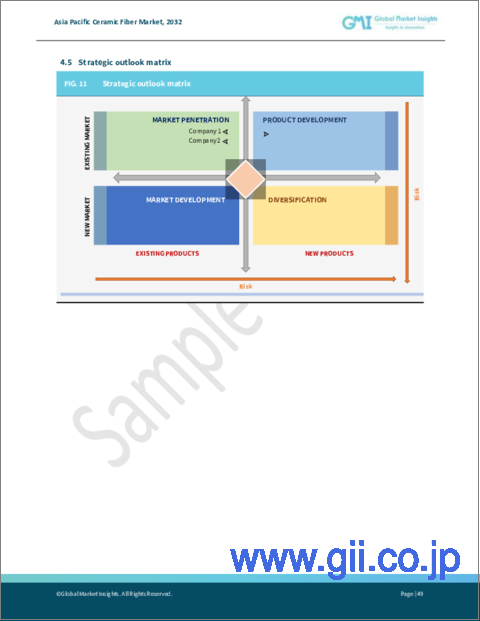
- 戦略的展望マトリックス
第5章 アジア太平洋地域のセラミックファイバー市場:製品別
- 市場シェア
- 耐火セラミックファイバー(RCF)
- アルカリ土ケイ酸塩(AES)
- その他
第6章 アジア太平洋地域のセラミックファイバー市場:形状別
- 市場シェア
- ブランケット
- モジュール
- ボード
- 紙
- その他
第7章 アジア太平洋地域のセラミックファイバー市場:温度定格別
- 市場シェア
- 1,000以下
- 1,001~1,200
- 1,201~1,400
- 1,400超
第8章 アジア太平洋地域のセラミックファイバー市場:用途別
- 市場シェア
- 伸縮継手ファイバーバリア
- 高温パイプ・ダクト・チューブ断熱材
- 工業炉ベースシール
- 防火ダンパー/シーリングディフューザー
- 高温ガスケット・パッキン
- その他
第9章 アジア太平洋地域のセラミックファイバー市場:エンドユーザー別
- 市場シェア
- 石油・ガス
- 鉄鋼
- 発電
- アルミニウム
- 化学処理
- セラミックス
- その他
第10章 アジア太平洋地域のセラミックファイバー市場:国別
- 市場シェア
- 日本
- インド
- オーストラリア
- インドネシア
- マレーシア
- 韓国
- ベトナム
- タイ
- フィリピン
- 中国
- 台湾
- シンガポール
第11章 企業プロファイル
- Unifrax I LLC.
- Morgan Advanced Materials PLC.
- Ibiden Co. Ltd.
- Isolite Insulating Products Co., Ltd.
- Luyang Energy-saving Materials Co., Ltd.
- Nutec Fibratec
- Yeso Insulating Products Co., Ltd.
- Rath Inc.
- Lewco Specialty Products
- PAR Group
- NGP Industries Limited
- Simond Fibertech Limited
Data Tables
- TABLE 1 Asia Pacific ceramic fiber market estimates, 2018 - 2022, (Tons) (USD Million)
- TABLE 2 Asia Pacific ceramic fiber market forecast, 2023 - 2032, (Tons) (USD Million)
- TABLE 3 Asia Pacific ceramic fiber market estimates, by product, 2018 - 2022, (Tons)
- TABLE 4 Asia Pacific ceramic fiber market forecast, by product, 2023 - 2032, (Tons)
- TABLE 5 Asia Pacific ceramic fiber market estimates, by product, 2018 - 2022, (USD Million)
- TABLE 6 Asia Pacific ceramic fiber market forecast, by product, 2023 - 2032, (USD Million)
- TABLE 7 Asia Pacific ceramic fiber market estimates, by form, 2018 - 2022, (Tons)
- TABLE 8 Asia Pacific ceramic fiber market forecast, by form, 2023 - 2032, (Tons)
- TABLE 9 Asia Pacific ceramic fiber market estimates, by form, 2018 - 2022, (USD Million)
- TABLE 10 Asia Pacific ceramic fiber market forecast, by form, 2023 - 2032, (USD Million)
- TABLE 11 Asia Pacific ceramic fiber market estimates, by temperature ratings, 2018 - 2022, (Tons)
- TABLE 12 Asia Pacific ceramic fiber market forecast, by temperature ratings, 2023 - 2032, (Tons)
- TABLE 13 Asia Pacific ceramic fiber market estimates, by temperature ratings, 2018 - 2022, (USD Million)
- TABLE 14 Asia Pacific ceramic fiber market forecast, by temperature ratings, 2023 - 2032, (USD Million)
- TABLE 15 Asia Pacific ceramic fiber market estimates, by application, 2018 - 2022, (Tons)
- TABLE 16 Asia Pacific ceramic fiber market forecast, by application, 2023 - 2032, (Tons)
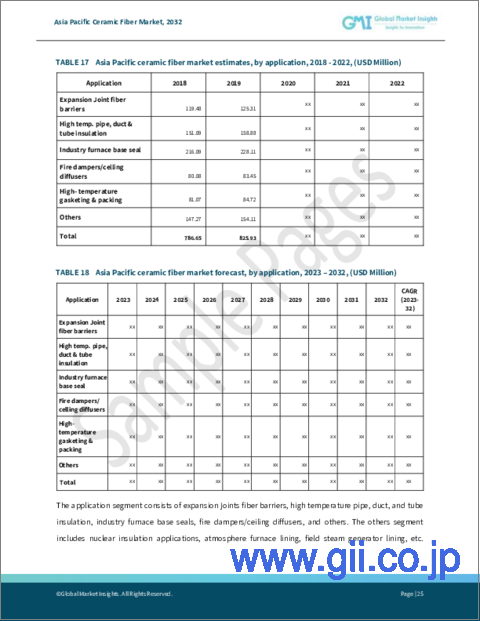
- TABLE 17 Asia Pacific ceramic fiber market estimates, by application, 2018 - 2022, (USD Million)
- TABLE 18 Asia Pacific ceramic fiber market forecast, by application, 2023 - 2032, (USD Million)
- TABLE 19 Asia Pacific ceramic fiber market estimates, by end-user, 2018 - 2022, (Tons)
- TABLE 20 Asia Pacific ceramic fiber market forecast, by end-user, 2023 - 2032, (Tons)
- TABLE 21 Asia Pacific ceramic fiber market estimates, by end-user, 2018 - 2022, (USD Million)
- TABLE 22 Asia Pacific ceramic fiber market forecast, by end-user, 2023 - 2032, (USD Million)
- TABLE 23 Asia Pacific ceramic fiber market estimates, by country, 2018 - 2022, (Tons)
- TABLE 24 Asia Pacific ceramic fiber market forecast, by country, 2023 - 2032, (Tons)
- TABLE 25 Asia Pacific ceramic fiber market estimates, by country, 2018 - 2022, (USD Million)
- TABLE 26 Asia Pacific ceramic fiber market forecast, by country, 2023 - 2032, (USD Million)
- TABLE 27 List of key raw material suppliers
- TABLE 28 List of key manufacturers/distributors
- TABLE 29 List of key potential customers
- TABLE 30 Pyro-Bloc Module velocity data
- TABLE 31 Industry impact forces
- TABLE 32 GDP growth of 5 Asian mainland
- TABLE 33 Thermal comparison of ceramic fiber lining, Fireclay brick lining, and IFB for Furnace Operating at 1,800°F
- TABLE 34 Competitive analysis of major market players
- TABLE 35 Asia Pacific market estimates, 2018 - 2022, (Tons) (USD Million)
- TABLE 36 Asia Pacific market forecast, 2023 - 2032, (Tons) (USD Million)
- TABLE 37 Asia Pacific market estimates, by country, 2018 - 2022, (Tons)
- TABLE 38 Asia Pacific market forecast, by country, 2023 - 2032, (Tons)
- TABLE 39 Asia Pacific market estimates, by country, 2018 - 2022, (USD Million)
- TABLE 40 Asia Pacific market forecast, by country, 2023 - 2032, (USD Million)
- TABLE 41 Asia Pacific market estimates, 2018 - 2022, (Tons) (USD Million)
- TABLE 42 Asia Pacific market forecast, 2023 - 2032, (Tons) (USD Million)
- TABLE 43 Asia Pacific market estimates, by country, 2018 - 2022, (Tons)
- TABLE 44 Asia Pacific market forecast, by country, 2023 - 2032, (Tons)
- TABLE 45 Asia Pacific market estimates, by country, 2018 - 2022, (USD Million)
- TABLE 46 Asia Pacific market forecast, by country, 2023 - 2032, (USD Million)
- TABLE 47 Asia Pacific market estimates, 2018 - 2022, (Tons) (USD Million)
- TABLE 48 Asia Pacific market forecast, 2023 - 2032, (Tons) (USD Million)
- TABLE 49 Asia Pacific market estimates, by country, 2018 - 2022, (Tons)
- TABLE 50 Asia Pacific market forecast, by country, 2023 - 2032, (Tons)
- TABLE 51 Asia Pacific market estimates, by country, 2018 - 2022, (USD Million)
- TABLE 52 Asia Pacific market forecast, by country, 2023 - 2032, (USD Million)
- TABLE 53 Asia Pacific market estimates, 2018 - 2022, (Tons) (USD Million)
- TABLE 54 Asia Pacific market forecast, 2023 - 2032, (Tons) (USD Million)
- TABLE 55 Asia Pacific market estimates, by country, 2018 - 2022, (Tons)
- TABLE 56 Asia Pacific market forecast, by country, 2023 - 2032, (Tons)
- TABLE 57 Asia Pacific market estimates, by country, 2018 - 2022, (USD Million)
- TABLE 58 Asia Pacific market forecast, by country, 2023 - 2032, (USD Million)
- TABLE 59 Asia Pacific market estimates, 2018 - 2022, (Tons) (USD Million)
- TABLE 60 Asia Pacific market forecast, 2023 - 2032, (Tons) (USD Million)
- TABLE 61 Asia Pacific market estimates, by country, 2018 - 2022, (Tons)
- TABLE 62 Asia Pacific market forecast, by country, 2023 - 2032, (Tons)
- TABLE 63 Asia Pacific market estimates, by country, 2018 - 2022, (USD Million)
- TABLE 64 Asia Pacific market forecast, by country, 2023 - 2032, (USD Million)
- TABLE 65 Asia Pacific market estimates, 2018 - 2022, (Tons) (USD Million)
- TABLE 66 Asia Pacific market forecast, 2023 - 2032, (Tons) (USD Million)
- TABLE 67 Asia Pacific market estimates, by country, 2018 - 2022, (Tons)
- TABLE 68 Asia Pacific market forecast, by country, 2023 - 2032, (Tons)
- TABLE 69 Asia Pacific market estimates, by country, 2018 - 2022, (USD Million)
- TABLE 70 Asia Pacific market forecast, by country, 2023 - 2032, (USD Million)
- TABLE 71 Asia Pacific market estimates, 2018 - 2022, (Tons) (USD Million)
- TABLE 72 Asia Pacific market forecast, 2023 - 2032, (Tons) (USD Million)
- TABLE 73 Asia Pacific market estimates, by country, 2018 - 2022, (Tons)
- TABLE 74 Asia Pacific market forecast, by country, 2023 - 2032, (Tons)
- TABLE 75 Asia Pacific market estimates, by country, 2018 - 2022, (USD Million)
- TABLE 76 Asia Pacific market forecast, by country, 2023 - 2032, (USD Million)
- TABLE 77 Asia Pacific market estimates, 2018 - 2022, (Tons) (USD Million)
- TABLE 78 Asia Pacific market forecast, 2023 - 2032, (Tons) (USD Million)
- TABLE 79 Asia Pacific market estimates, by country, 2018 - 2022, (Tons)
- TABLE 80 Asia Pacific market forecast, by country, 2023 - 2032, (Tons)
- TABLE 81 Asia Pacific market estimates, by country, 2018 - 2022, (USD Million)
- TABLE 82 Asia Pacific market forecast, by country, 2023 - 2032, (USD Million)
- TABLE 83 Asia Pacific market estimates, 2018 - 2022, (Tons) (USD Million)
- TABLE 84 Asia Pacific market forecast, 2023 - 2032, (Tons) (USD Million)
- TABLE 85 Asia Pacific market estimates, by country, 2018 - 2022, (Tons)
- TABLE 86 Asia Pacific market forecast, by country, 2023 - 2032, (Tons)
- TABLE 87 Asia Pacific market estimates, by country, 2018 - 2022, (USD Million)
- TABLE 88 Asia Pacific market forecast, by country, 2023 - 2032, (USD Million)
- TABLE 89 Asia Pacific market estimates, 2018 - 2022, (Tons) (USD Million)
- TABLE 90 Asia Pacific market forecast, 2023 - 2032, (Tons) (USD Million)
- TABLE 91 Asia Pacific market estimates, by country, 2018 - 2022, (Tons)
- TABLE 92 Asia Pacific market forecast, by country, 2023 - 2032, (Tons)
- TABLE 93 Asia Pacific market estimates, by country, 2018 - 2022, (USD Million)
- TABLE 94 Asia Pacific market forecast, by country, 2023 - 2032, (USD Million)
- TABLE 95 Asia Pacific market estimates, 2018 - 2022, (Tons) (USD Million)
- TABLE 96 Asia Pacific market forecast, 2023 - 2032, (Tons) (USD Million)
- TABLE 97 Asia Pacific market estimates, by country, 2018 - 2022, (Tons)
- TABLE 98 Asia Pacific market forecast, by country, 2023 - 2032, (Tons)
- TABLE 99 Asia Pacific market estimates, by country, 2018 - 2022, (USD Million)
- TABLE 100 Asia Pacific market forecast, by country, 2023 - 2032, (USD Million)
- TABLE 101 Asia Pacific market estimates, 2018 - 2022, (Tons) (USD Million)
- TABLE 102 Asia Pacific market forecast, 2023 - 2032, (Tons) (USD Million)
- TABLE 103 Asia Pacific market estimates, by country, 2018 - 2022, (Tons)
- TABLE 104 Asia Pacific market forecast, by country, 2023 - 2032, (Tons)
- TABLE 105 Asia Pacific market estimates, by country, 2018 - 2022, (USD Million)
- TABLE 106 Asia Pacific market forecast, by country, 2023 - 2032, (USD Million)
- TABLE 107 Asia Pacific market estimates, 2018 - 2022, (Tons) (USD Million)
- TABLE 108 Asia Pacific market forecast, 2023 - 2032, (Tons) (USD Million)
- TABLE 109 Asia Pacific market estimates, by country, 2018 - 2022, (Tons)
- TABLE 110 Asia Pacific market forecast, by country, 2023 - 2032, (Tons)
- TABLE 111 Asia Pacific market estimates, by country, 2018 - 2022, (USD Million)
- TABLE 112 Asia Pacific market forecast, by country, 2023 - 2032, (USD Million)
- TABLE 113 Asia Pacific market estimates, 2018 - 2022, (Tons) (USD Million)
- TABLE 114 Asia Pacific market forecast, 2023 - 2032, (Tons) (USD Million)
- TABLE 115 Asia Pacific market estimates, by country, 2018 - 2022, (Tons)
- TABLE 116 Asia Pacific market forecast, by country, 2023 - 2032, (Tons)
- TABLE 117 Asia Pacific market estimates, by country, 2018 - 2022, (USD Million)
- TABLE 118 Asia Pacific market forecast, by country, 2023 - 2032, (USD Million)
- TABLE 119 Asia Pacific market estimates, 2018 - 2022, (Tons) (USD Million)
- TABLE 120 Asia Pacific market forecast, 2023 - 2032, (Tons) (USD Million)
- TABLE 121 Asia Pacific market estimates, by country, 2018 - 2022, (Tons)
- TABLE 122 Asia Pacific market forecast, by country, 2023 - 2032, (Tons)
- TABLE 123 Asia Pacific market estimates, by country, 2018 - 2022, (USD Million)
- TABLE 124 Asia Pacific market forecast, by country, 2023 - 2032, (USD Million)
- TABLE 125 Asia Pacific market estimates, 2018 - 2022, (Tons) (USD Million)
- TABLE 126 Asia Pacific market forecast, 2023 - 2032, (Tons) (USD Million)
- TABLE 127 Asia Pacific market estimates, by country, 2018 - 2022, (Tons)
- TABLE 128 Asia Pacific market forecast, by country, 2023 - 2032, (Tons)
- TABLE 129 Asia Pacific market estimates, by country, 2018 - 2022, (USD Million)
- TABLE 130 Asia Pacific market forecast, by country, 2023 - 2032, (USD Million)
- TABLE 131 Asia Pacific market estimates, 2018 - 2022, (Tons) (USD Million)
- TABLE 132 Asia Pacific market forecast, 2023 - 2032, (Tons) (USD Million)
- TABLE 133 Asia Pacific market estimates, by country, 2018 - 2022, (Tons)
- TABLE 134 Asia Pacific market forecast, by country, 2023 - 2032, (Tons)
- TABLE 135 Asia Pacific market estimates, by country, 2018 - 2022, (USD Million)
- TABLE 136 Asia Pacific market forecast, by country, 2023 - 2032, (USD Million)
- TABLE 137 Asia Pacific market estimates, 2018 - 2022, (Tons) (USD Million)
- TABLE 138 Asia Pacific market forecast, 2023 - 2032, (Tons) (USD Million)
- TABLE 139 Asia Pacific market estimates, by country, 2018 - 2022, (Tons)
- TABLE 140 Asia Pacific market forecast, by country, 2023 - 2032, (Tons)
- TABLE 141 Asia Pacific market estimates, by country, 2018 - 2022, (USD Million)
- TABLE 142 Asia Pacific market forecast, by country, 2023 - 2032, (USD Million)
- TABLE 143 Asia Pacific market estimates, 2018 - 2022, (Tons) (USD Million)
- TABLE 144 Asia Pacific market forecast, 2023 - 2032, (Tons) (USD Million)
- TABLE 145 Asia Pacific market estimates, by country, 2018 - 2022, (Tons)
- TABLE 146 Asia Pacific market forecast, by country, 2023 - 2032, (Tons)
- TABLE 147 Asia Pacific market estimates, by country, 2018 - 2022, (USD Million)
- TABLE 148 Asia Pacific market forecast, by country, 2023 - 2032, (USD Million)
- TABLE 149 Asia Pacific market estimates, 2018 - 2022, (Tons) (USD Million)
- TABLE 150 Asia Pacific market forecast, 2023 - 2032, (Tons) (USD Million)
- TABLE 151 Asia Pacific market estimates, by country, 2018 - 2022, (Tons)
- TABLE 152 Asia Pacific market forecast, by country, 2023 - 2032, (Tons)
- TABLE 153 Asia Pacific market estimates, by country, 2018 - 2022, (USD Million)
- TABLE 154 Asia Pacific market forecast, by country, 2023 - 2032, (USD Million)
- TABLE 155 Asia Pacific market estimates, 2018 - 2022, (Tons) (USD Million)
- TABLE 156 Asia Pacific market forecast, 2023 - 2032, (Tons) (USD Million)
- TABLE 157 Asia Pacific market estimates, by country, 2018 - 2022, (Tons)
- TABLE 158 Asia Pacific market forecast, by country, 2023 - 2032, (Tons)
- TABLE 159 Asia Pacific market estimates, by country, 2018 - 2022, (USD Million)
- TABLE 160 Asia Pacific market forecast, by country, 2023 - 2032, (USD Million)
- TABLE 161 Asia Pacific market estimates, 2018 - 2022, (Tons) (USD Million)
- TABLE 162 Asia Pacific market forecast, 2023 - 2032, (Tons) (USD Million)
- TABLE 163 Asia Pacific market estimates, by country, 2018 - 2022, (Tons)
- TABLE 164 Asia Pacific market forecast, by country, 2023 - 2032, (Tons)
- TABLE 165 Asia Pacific market estimates, by country, 2018 - 2022, (USD Million)
- TABLE 166 Asia Pacific market forecast, by country, 2023 - 2032, (USD Million)
- TABLE 167 Asia Pacific market estimates, 2018 - 2022, (Tons) (USD Million)
- TABLE 168 Asia Pacific market forecast, 2023 - 2032, (Tons) (USD Million)
- TABLE 169 Asia Pacific market estimates, by country, 2018 - 2022, (Tons)
- TABLE 170 Asia Pacific market forecast, by country, 2023 - 2032, (Tons)
- TABLE 171 Asia Pacific market estimates, by country, 2018 - 2022, (USD Million)
- TABLE 172 Asia Pacific market forecast, by country, 2023 - 2032, (USD Million)
- TABLE 173 Asia Pacific market estimates, 2018 - 2022, (Tons) (USD Million)
- TABLE 174 Asia Pacific market forecast, 2023 - 2032, (Tons) (USD Million)
- TABLE 175 Asia Pacific market estimates, by country, 2018 - 2022, (Tons)
- TABLE 176 Asia Pacific market forecast, by country, 2023 - 2032, (Tons)
- TABLE 177 Asia Pacific market estimates, by country, 2018 - 2022, (USD Million)
- TABLE 178 Asia Pacific market forecast, by country, 2023 - 2032, (USD Million)
- TABLE 179 Asia Pacific market estimates, 2018 - 2022, (Tons) (USD Million)
- TABLE 180 Asia Pacific market forecast, 2023 - 2032, (Tons) (USD Million)
- TABLE 181 Asia Pacific market estimates, by country, 2018 - 2022, (Tons)
- TABLE 182 Asia Pacific market forecast, by country, 2023 - 2032, (Tons)
- TABLE 183 Asia Pacific market estimates, by country, 2018 - 2022, (USD Million)
- TABLE 184 Asia Pacific market forecast, by country, 2023 - 2032, (USD Million)
- TABLE 185 Market estimates, 2018-2022, (Tons) (USD Million)
- TABLE 186 Market forecast, 2023 - 2032, (Tons) (USD Million)
- TABLE 187 Market volume estimate, by product, 2018 - 2022 (Tons)
- TABLE 188 Market volume forecast, by product, 2023 - 2032 (Tons)
- TABLE 189 Market revenue estimate, by product, 2018 - 2022 (USD Million)
- TABLE 190 Market revenue forecast, by product, 2023 - 2032 (USD Million)
- TABLE 191 Market volume estimates, by form, 2018 - 2022 (Tons)
- TABLE 192 Market volume forecast, by form, 2023 - 2032 (Tons)
- TABLE 193 Market revenue estimates, by form, 2018 - 2022 (USD Million)
- TABLE 194 Market revenue forecast, by form, 2023 - 2032 (USD Million)
- TABLE 195 Market volume estimates, by temperature rating, 2018 - 2022 (Tons)
- TABLE 196 Market volume forecast, by temperature rating, 2023 - 2032 (Tons)
- TABLE 197 Market revenue estimates, by temperature rating, 2018 - 2022 (USD Million)
- TABLE 198 Market revenue forecast, by temperature rating, 2023 - 2032 (USD Million)
- TABLE 199 Market volume estimates, by application, 2018 - 2022 (Tons)
- TABLE 200 Market volume forecast, by application, 2023 - 2032 (Tons)
- TABLE 201 Market revenue estimates, by application, 2018 - 2022 (USD Million)
- TABLE 202 Market revenue forecast, by application, 2023 - 2032 (USD Million)
- TABLE 203 Market volume estimates, by end-use industry, 2018 - 2022 (Tons)
- TABLE 204 Market volume forecast, by end-use industry, 2023 - 2032 (Tons)
- TABLE 205 Market revenue estimates, by end-use industry, 2018 - 2022 (USD Million)
- TABLE 206 Market revenue forecast, by end-use industry, 2023 - 2032 (USD Million)
- TABLE 207 Market estimates, 2018-2022, (Tons) (USD Million)
- TABLE 208 Market forecast, 2023 - 2032, (Tons) (USD Million)
- TABLE 209 Market volume estimate, by product, 2018 - 2022 (Tons)
- TABLE 210 Market volume forecast, by product, 2023 - 2032 (Tons)
- TABLE 211 Market revenue estimate, by product, 2018 - 2022 (USD Million)
- TABLE 212 Market revenue forecast, by product, 2023 - 2032 (USD Million)
- TABLE 213 Market volume estimates, by form, 2018 - 2022 (Tons)
- TABLE 214 Market volume forecast, by form, 2023 - 2032 (Tons)
- TABLE 215 Market revenue estimates, by form, 2018 - 2022 (USD Million)
- TABLE 216 Market revenue forecast, by form, 2023 - 2032 (USD Million)
- TABLE 217 Market volume estimates, by temperature rating, 2018 - 2022 (Tons)
- TABLE 218 Market volume forecast, by temperature rating, 2023 - 2032 (Tons)
- TABLE 219 Market revenue estimates, by temperature rating, 2018 - 2022 (USD Million)
- TABLE 220 Market revenue forecast, by temperature rating, 2023 - 2032 (USD Million)
- TABLE 221 Market volume estimates, by application, 2018 - 2022 (Tons)
- TABLE 222 Market volume forecast, by application, 2023 - 2032 (Tons)
- TABLE 223 Market revenue estimates, by application, 2018 - 2022 (USD Million)
- TABLE 224 Market revenue forecast, by application, 2023 - 2032 (USD Million)
- TABLE 225 Market volume estimates, by end-use industry, 2018 - 2022 (Tons)
- TABLE 226 Market volume forecast, by end-use industry, 2023 - 2032 (Tons)
- TABLE 227 Market revenue estimates, by end-use industry, 2018 - 2022 (USD Million)
- TABLE 228 Market revenue forecast, by end-use industry, 2023 - 2032 (USD Million)
- TABLE 229 Market estimates, 2018-2022, (Tons) (USD Million)
- TABLE 230 Market forecast, 2023 - 2032, (Tons) (USD Million)
- TABLE 231 Market volume estimate, by product, 2018 - 2022 (Tons)
- TABLE 232 Market volume forecast, by product, 2023 - 2032 (Tons)
- TABLE 233 Market revenue estimate, by product, 2018 - 2022 (USD Million)
- TABLE 234 Market revenue forecast, by product, 2023 - 2032 (USD Million)
- TABLE 235 Market volume estimates, by form, 2018 - 2022 (Tons)
- TABLE 236 Market volume forecast, by form, 2023 - 2032 (Tons)
- TABLE 237 Market revenue estimates, by form, 2018 - 2022 (USD Million)
- TABLE 238 Market revenue forecast, by form, 2023 - 2032 (USD Million)
- TABLE 239 Market volume estimates, by temperature rating, 2018 - 2022 (Tons)
- TABLE 240 Market volume forecast, by temperature rating, 2023 - 2032 (Tons)
- TABLE 241 Market revenue estimates, by temperature rating, 2018 - 2022 (USD Million)
- TABLE 242 Market revenue forecast, by temperature rating, 2023 - 2032 (USD Million)
- TABLE 243 Market volume estimates, by application, 2018 - 2022 (Tons)
- TABLE 244 Market volume forecast, by application, 2023 - 2032 (Tons)
- TABLE 245 Market revenue estimates, by application, 2018 - 2022 (USD Million)
- TABLE 246 Market revenue forecast, by application, 2023 - 2032 (USD Million)
- TABLE 247 Market volume estimates, by end-use industry, 2018 - 2022 (Tons)
- TABLE 248 Market volume forecast, by end-use industry, 2023 - 2032 (Tons)
- TABLE 249 Market revenue estimates, by end-use industry, 2018 - 2022 (USD Million)
- TABLE 250 Market revenue forecast, by end-use industry, 2023 - 2032 (USD Million)
- TABLE 251 Market estimates, 2018-2022, (Tons) (USD Million)
- TABLE 252 Market forecast, 2023 - 2032, (Tons) (USD Million)
- TABLE 253 Market volume estimate, by product, 2018 - 2022 (Tons)
- TABLE 254 Market volume forecast, by product, 2023 - 2032 (Tons)
- TABLE 255 Market revenue estimate, by product, 2018 - 2022 (USD Million)
- TABLE 256 Market revenue forecast, by product, 2023 - 2032 (USD Million)
- TABLE 257 Market volume estimates, by form, 2018 - 2022 (Tons)
- TABLE 258 Market volume forecast, by form, 2023 - 2032 (Tons)
- TABLE 259 Market revenue estimates, by form, 2018 - 2022 (USD Million)
- TABLE 260 Market revenue forecast, by form, 2023 - 2032 (USD Million)
- TABLE 261 Market volume estimates, by temperature rating, 2018 - 2022 (Tons)
- TABLE 262 Market volume forecast, by temperature rating, 2023 - 2032 (Tons)
- TABLE 263 Market revenue estimates, by temperature rating, 2018 - 2022 (USD Million)
- TABLE 264 Market revenue forecast, by temperature rating, 2023 - 2032 (USD Million)
- TABLE 265 Market volume estimates, by application, 2018 - 2022 (Tons)
- TABLE 266 Market volume forecast, by application, 2023 - 2032 (Tons)
- TABLE 267 Market revenue estimates, by application, 2018 - 2022 (USD Million)
- TABLE 268 Market revenue forecast, by application, 2023 - 2032 (USD Million)
- TABLE 269 Market volume estimates, by end-use industry, 2018 - 2022 (Tons)
- TABLE 270 Market volume forecast, by end-use industry, 2023 - 2032 (Tons)
- TABLE 271 Market revenue estimates, by end-use industry, 2018 - 2022 (USD Million)
- TABLE 272 Market revenue forecast, by end-use industry, 2023 - 2032 (USD Million)
- TABLE 273 Market estimates, 2018-2022, (Tons) (USD Million)
- TABLE 274 Market forecast, 2023 - 2032, (Tons) (USD Million)
- TABLE 275 Market volume estimate, by product, 2018 - 2022 (Tons)
- TABLE 276 Market volume forecast, by product, 2023 - 2032 (Tons)
- TABLE 277 Market revenue estimate, by product, 2018 - 2022 (USD Million)
- TABLE 278 Market revenue forecast, by product, 2023 - 2032 (USD Million)
- TABLE 279 Market volume estimates, by form, 2018 - 2022 (Tons)
- TABLE 280 Market volume forecast, by form, 2023 - 2032 (Tons)
- TABLE 281 Market revenue estimates, by form, 2018 - 2022 (USD Million)
- TABLE 282 Market revenue forecast, by form, 2023 - 2032 (USD Million)
- TABLE 283 Market volume estimates, by temperature rating, 2018 - 2022 (Tons)
- TABLE 284 Market volume forecast, by temperature rating, 2023 - 2032 (Tons)
- TABLE 285 Market revenue estimates, by temperature rating, 2018 - 2022 (USD Million)
- TABLE 286 Market revenue forecast, by temperature rating, 2023 - 2032 (USD Million)
- TABLE 287 Market volume estimates, by application, 2018 - 2022 (Tons)
- TABLE 288 Market volume forecast, by application, 2023 - 2032 (Tons)
- TABLE 289 Market revenue estimates, by application, 2018 - 2022 (USD Million)
- TABLE 290 Market revenue forecast, by application, 2023 - 2032 (USD Million)
- TABLE 291 Market volume estimates, by end-use industry, 2018 - 2022 (Tons)
- TABLE 292 Market volume forecast, by end-use industry, 2023 - 2032 (Tons)
- TABLE 293 Market revenue estimates, by end-use industry, 2018 - 2022 (USD Million)
- TABLE 294 Market revenue forecast, by end-use industry, 2023 - 2032 (USD Million)
- TABLE 295 Market estimates, 2018-2022, (Tons) (USD Million)
- TABLE 296 Market forecast, 2023 - 2032, (Tons) (USD Million)
- TABLE 297 Market volume estimate, by product, 2018 - 2022 (Tons)
- TABLE 298 Market volume forecast, by product, 2023 - 2032 (Tons)
- TABLE 299 Market revenue estimate, by product, 2018 - 2022 (USD Million)
- TABLE 300 Market revenue forecast, by product, 2023 - 2032 (USD Million)
- TABLE 301 Market volume estimates, by form, 2018 - 2022 (Tons)
- TABLE 302 Market volume forecast, by form, 2023 - 2032 (Tons)
- TABLE 303 Market revenue estimates, by form, 2018 - 2022 (USD Million)
- TABLE 304 Market revenue forecast, by form, 2023 - 2032 (USD Million)
- TABLE 305 Market volume estimates, by temperature rating, 2018 - 2022 (Tons)
- TABLE 306 Market volume forecast, by temperature rating, 2023 - 2032 (Tons)
- TABLE 307 Market revenue estimates, by temperature rating, 2018 - 2022 (USD Million)
- TABLE 308 Market revenue forecast, by temperature rating, 2023 - 2032 (USD Million)
- TABLE 309 Market volume estimates, by application, 2018 - 2022 (Tons)
- TABLE 310 Market volume forecast, by application, 2023 - 2032 (Tons)
- TABLE 311 Market revenue estimates, by application, 2018 - 2022 (USD Million)
- TABLE 312 Market revenue forecast, by application, 2023 - 2032 (USD Million)
- TABLE 313 Market volume estimates, by end-use industry, 2018 - 2022 (Tons)
- TABLE 314 Market volume forecast, by end-use industry, 2023 - 2032 (Tons)
- TABLE 315 Market revenue estimates, by end-use industry, 2018 - 2022 (USD Million)
- TABLE 316 Market revenue forecast, by end-use industry, 2023 - 2032 (USD Million)
- TABLE 317 Market estimates, 2018-2022, (Tons) (USD Million)
- TABLE 318 Market forecast, 2023 - 2032, (Tons) (USD Million)
- TABLE 319 Market volume estimate, by product, 2018 - 2022 (Tons)
- TABLE 320 Market volume forecast, by product, 2023 - 2032 (Tons)
- TABLE 321 Market revenue estimate, by product, 2018 - 2022 (USD Million)
- TABLE 322 Market revenue forecast, by product, 2023 - 2032 (USD Million)
- TABLE 323 Market volume estimates, by form, 2018 - 2022 (Tons)
- TABLE 324 Market volume forecast, by form, 2023 - 2032 (Tons)
- TABLE 325 Market revenue estimates, by form, 2018 - 2022 (USD Million)
- TABLE 326 Market revenue forecast, by form, 2023 - 2032 (USD Million)
- TABLE 327 Market volume estimates, by temperature rating, 2018 - 2022 (Tons)
- TABLE 328 Market volume forecast, by temperature rating, 2023 - 2032 (Tons)
- TABLE 329 Market revenue estimates, by temperature rating, 2018 - 2022 (USD Million)
- TABLE 330 Market revenue forecast, by temperature rating, 2023 - 2032 (USD Million)
- TABLE 331 Market volume estimates, by application, 2018 - 2022 (Tons)
- TABLE 332 Market volume forecast, by application, 2023 - 2032 (Tons)
- TABLE 333 Market revenue estimates, by application, 2018 - 2022 (USD Million)
- TABLE 334 Market revenue forecast, by application, 2023 - 2032 (USD Million)
- TABLE 335 Market volume estimates, by end-use industry, 2018 - 2022 (Tons)
- TABLE 336 Market volume forecast, by end-use industry, 2023 - 2032 (Tons)
- TABLE 337 Market revenue estimates, by end-use industry, 2018 - 2022 (USD Million)
- TABLE 338 Market revenue forecast, by end-use industry, 2023 - 2032 (USD Million)
- TABLE 339 Market estimates, 2018-2022, (Tons) (USD Million)
- TABLE 340 Market forecast, 2023 - 2032, (Tons) (USD Million)
- TABLE 341 Market volume estimate, by product, 2018 - 2022 (Tons)
- TABLE 342 Market volume forecast, by product, 2023 - 2032 (Tons)
- TABLE 343 Market revenue estimate, by product, 2018 - 2022 (USD Million)
- TABLE 344 Market revenue forecast, by product, 2023 - 2032 (USD Million)
- TABLE 345 Market volume estimates, by form, 2018 - 2022 (Tons)
- TABLE 346 Market volume forecast, by form, 2023 - 2032 (Tons)
- TABLE 347 Market revenue estimates, by form, 2018 - 2022 (USD Million)
- TABLE 348 Market revenue forecast, by form, 2023 - 2032 (USD Million)
- TABLE 349 Market volume estimates, by temperature rating, 2018 - 2022 (Tons)
- TABLE 350 Market volume forecast, by temperature rating, 2023 - 2032 (Tons)
- TABLE 351 Market revenue estimates, by temperature rating, 2018 - 2022 (USD Million)
- TABLE 352 Market revenue forecast, by temperature rating, 2023 - 2032 (USD Million)
- TABLE 353 Market volume estimates, by application, 2018 - 2022 (Tons)
- TABLE 354 Market volume forecast, by application, 2023 - 2032 (Tons)
- TABLE 355 Market revenue estimates, by application, 2018 - 2022 (USD Million)
- TABLE 356 Market revenue forecast, by application, 2023 - 2032 (USD Million)
- TABLE 357 Market volume estimates, by end-use industry, 2018 - 2022 (Tons)
- TABLE 358 Market volume forecast, by end-use industry, 2023 - 2032 (Tons)
- TABLE 359 Market revenue estimates, by end-use industry, 2018 - 2022 (USD Million)
- TABLE 360 Market revenue forecast, by end-use industry, 2023 - 2032 (USD Million)
- TABLE 361 Market estimates, 2018-2022, (Tons) (USD Million)
- TABLE 362 Market forecast, 2023 - 2032, (Tons) (USD Million)
- TABLE 363 Market volume estimate, by product, 2018 - 2022 (Tons)
- TABLE 364 Market volume forecast, by product, 2023 - 2032 (Tons)
- TABLE 365 Market revenue estimate, by product, 2018 - 2022 (USD Million)
- TABLE 366 Market revenue forecast, by product, 2023 - 2032 (USD Million)
- TABLE 367 Market volume estimates, by form, 2018 - 2022 (Tons)
- TABLE 368 Market volume forecast, by form, 2023 - 2032 (Tons)
- TABLE 369 Market revenue estimates, by form, 2018 - 2022 (USD Million)
- TABLE 370 Market revenue forecast, by form, 2023 - 2032 (USD Million)
- TABLE 371 Market volume estimates, by temperature rating, 2018 - 2022 (Tons)
- TABLE 372 Market volume forecast, by temperature rating, 2023 - 2032 (Tons)
- TABLE 373 Market revenue estimates, by temperature rating, 2018 - 2022 (USD Million)
- TABLE 374 Market revenue forecast, by temperature rating, 2023 - 2032 (USD Million)
- TABLE 375 Market volume estimates, by application, 2018 - 2022 (Tons)
- TABLE 376 Market volume forecast, by application, 2023 - 2032 (Tons)
- TABLE 377 Market revenue estimates, by application, 2018 - 2022 (USD Million)
- TABLE 378 Market revenue forecast, by application, 2023 - 2032 (USD Million)
- TABLE 379 Market volume estimates, by end-use industry, 2018 - 2022 (Tons)
- TABLE 380 Market volume forecast, by end-use industry, 2023 - 2032 (Tons)
- TABLE 381 Market revenue estimates, by end-use industry, 2018 - 2022 (USD Million)
- TABLE 382 Market revenue forecast, by end-use industry, 2023 - 2032 (USD Million)
- TABLE 383 Market estimates, 2018-2022, (Tons) (USD Million)
- TABLE 384 Market forecast, 2023 - 2032, (Tons) (USD Million)
- TABLE 385 Market volume estimate, by product, 2018 - 2022 (Tons)
- TABLE 386 Market volume forecast, by product, 2023 - 2032 (Tons)
- TABLE 387 Market revenue estimate, by product, 2018 - 2022 (USD Million)
- TABLE 388 Market revenue forecast, by product, 2023 - 2032 (USD Million)
- TABLE 389 Market volume estimates, by form, 2018 - 2022 (Tons)
- TABLE 390 Market volume forecast, by form, 2023 - 2032 (Tons)
- TABLE 391 Market revenue estimates, by form, 2018 - 2022 (USD Million)
- TABLE 392 Market revenue forecast, by form, 2023 - 2032 (USD Million)
- TABLE 393 Market volume estimates, by temperature rating, 2018 - 2022 (Tons)
- TABLE 394 Market volume forecast, by temperature rating, 2023 - 2032 (Tons)
- TABLE 395 Market revenue estimates, by temperature rating, 2018 - 2022 (USD Million)
- TABLE 396 Market revenue forecast, by temperature rating, 2023 - 2032 (USD Million)
- TABLE 397 Market volume estimates, by application, 2018 - 2022 (Tons)
- TABLE 398 Market volume forecast, by application, 2023 - 2032 (Tons)
- TABLE 399 Market revenue estimates, by application, 2018 - 2022 (USD Million)
- TABLE 400 Market revenue forecast, by application, 2023 - 2032 (USD Million)
- TABLE 401 Market volume estimates, by end-use industry, 2018 - 2022 (Tons)
- TABLE 402 Market volume forecast, by end-use industry, 2023 - 2032 (Tons)
- TABLE 403 Market revenue estimates, by end-use industry, 2018 - 2022 (USD Million)
- TABLE 404 Market revenue forecast, by end-use industry, 2023 - 2032 (USD Million)
- TABLE 405 Market estimates, 2018-2022, (Tons) (USD Million)
- TABLE 406 Market forecast, 2023 - 2032, (Tons) (USD Million)
- TABLE 407 Market volume estimate, by product, 2018 - 2022 (Tons)
- TABLE 408 Market volume forecast, by product, 2023 - 2032 (Tons)
- TABLE 409 Market revenue estimate, by product, 2018 - 2022 (USD Million)
- TABLE 410 Market revenue forecast, by product, 2023 - 2032 (USD Million)
- TABLE 411 Market volume estimates, by form, 2018 - 2022 (Tons)
- TABLE 412 Market volume forecast, by form, 2023 - 2032 (Tons)
- TABLE 413 Market revenue estimates, by form, 2018 - 2022 (USD Million)
- TABLE 414 Market revenue forecast, by form, 2023 - 2032 (USD Million)
- TABLE 415 Market volume estimates, by temperature rating, 2018 - 2022 (Tons)
- TABLE 416 Market volume forecast, by temperature rating, 2023 - 2032 (Tons)
- TABLE 417 Market revenue estimates, by temperature rating, 2018 - 2022 (USD Million)
- TABLE 418 Market revenue forecast, by temperature rating, 2023 - 2032 (USD Million)
- TABLE 419 Market volume estimates, by application, 2018 - 2022 (Tons)
- TABLE 420 Market volume forecast, by application, 2023 - 2032 (Tons)
- TABLE 421 Market revenue estimates, by application, 2018 - 2022 (USD Million)
- TABLE 422 Market revenue forecast, by application, 2023 - 2032 (USD Million)
- TABLE 423 Market volume estimates, by end-use industry, 2018 - 2022 (Tons)
- TABLE 424 Market volume forecast, by end-use industry, 2023 - 2032 (Tons)
- TABLE 425 Market revenue estimates, by end-use industry, 2018 - 2022 (USD Million)
- TABLE 426 Market revenue forecast, by end-use industry, 2023 - 2032 (USD Million)
- TABLE 427 Market estimates, 2018-2022, (Tons) (USD Million)
- TABLE 428 Market forecast, 2023 - 2032, (Tons) (USD Million)
- TABLE 429 Market volume estimate, by product, 2018 - 2022 (Tons)
- TABLE 430 Market volume forecast, by product, 2023 - 2032 (Tons)
- TABLE 431 Market revenue estimate, by product, 2018 - 2022 (USD Million)
- TABLE 432 Market revenue forecast, by product, 2023 - 2032 (USD Million)
- TABLE 433 Market volume estimates, by form, 2018 - 2022 (Tons)
- TABLE 434 Market volume forecast, by form, 2023 - 2032 (Tons)
- TABLE 435 Market revenue estimates, by form, 2018 - 2022 (USD Million)
- TABLE 436 Market revenue forecast, by form, 2023 - 2032 (USD Million)
- TABLE 437 Market volume estimates, by temperature rating, 2018 - 2022 (Tons)
- TABLE 438 Market volume forecast, by temperature rating, 2023 - 2032 (Tons)
- TABLE 439 Market revenue estimates, by temperature rating, 2018 - 2022 (USD Million)
- TABLE 440 Market revenue forecast, by temperature rating, 2023 - 2032 (USD Million)
- TABLE 441 Market volume estimates, by application, 2018 - 2022 (Tons)
- TABLE 442 Market volume forecast, by application, 2023 - 2032 (Tons)
- TABLE 443 Market revenue estimates, by application, 2018 - 2022 (USD Million)
- TABLE 444 Market revenue forecast, by application, 2023 - 2032 (USD Million)
- TABLE 445 Market volume estimates, by end-use industry, 2018 - 2022 (Tons)
- TABLE 446 Market volume forecast, by end-use industry, 2023 - 2032 (Tons)
- TABLE 447 Market revenue estimates, by end-use industry, 2018 - 2022 (USD Million)
- TABLE 448 Market revenue forecast, by end-use industry, 2023 - 2032 (USD Million)
Charts & Figures
- FIG. 1 Asia Pacific ceramic fiber market 360 degree synopsis, 2018 - 2032
- FIG. 2 Global top 6 steel producing countries, 2021 (Million Tons)
- FIG. 3 Global electricity generation, 2021 (Terawatt-hours)
- FIG. 4 Asia Pacific oil production, 2021 (Million Tons)
- FIG. 5 Industry segmentation
- FIG. 6 Industry size and forecast, (Kilo Tons) (USD Million), 2018 - 2032
- FIG. 7 Industry ecosystem analysis
- FIG. 8 Value addition at each stage
- FIG. 9 Asia Pacific steel production, 2017-2021, (Million Tons)
- FIG. 10 Growth potential analysis, 2022
- FIG. 11 Cost structure analysis
- FIG. 12 Porter's analysis
- FIG. 13 PESTLE analysis
- FIG. 14 Company market share analysis, 2022
- FIG. 15 Competitive analysis of major market players, 2022
- FIG. 16 Vendor adoption matrix
- FIG. 17 Strategic outlook matrix
- FIG. 18 Asia Pacific ceramic fiber market volume share by product, 2022 & 2032
- FIG. 19 Asia Pacific ceramic fiber market volume share by form, 2022 & 2032
- FIG. 20 Asia Pacific ceramic fiber market volume share by temperature rating, 2022 & 2032
- FIG. 21 Asia Pacific ceramic fiber market volume share by application, 2022 & 2032
- FIG. 22 Asia Pacific ceramic fiber market volume share by end-user industry, 2022 & 2032
- FIG. 23 Asia Pacific ceramic fiber market volume share by country, 2022 & 2032
- FIG. 24 SWOT Analysis, Unifrax I LLC
- FIG. 25 SWOT Analysis, Morgan Advanced Materials PLC
- FIG. 26 SWOT Analysis, Ibiden Co. Ltd.
- FIG. 27 SWOT Analysis, Isolite Insulating Products Co., Ltd.
- FIG. 28 SWOT Analysis, Luyang Energy-saving materials Co., Ltd.
- FIG. 29 SWOT Analysis, Nutec Fibratec
- FIG. 30 SWOT Analysis, Yeso Insulating Products Co., Ltd
- FIG. 31 SWOT Analysis, Rath Inc.
- FIG. 32 SWOT Analysis, Lewco Specialty Products
- FIG. 33 SWOT Analysis, PAR Group
- FIG. 34 SWOT Analysis, NGP Industries Limited
- FIG. 35 SWOT Analysis, Simond Fibertech Limited
Asia Pacific ceramic fiber market is anticipated to witness steady growth through 2032 owing to the increasing demand for ceramic fiber for alternative energy solutions and other applications.
Surging awareness among people concerning the various benefits associated with ceramic fibers is likely to expand the market growth. Major players in the industry are working on technological advancements to cater to the growing need for innovative products among customers, supporting the market progression. For instance, in July 2022, Unifrax announced the takeover of Rex Materials Group (Rex Materials), a prominent supplier of tailored thermal components. Improvements in material technology, custom-designed technologies, and cutting-edge manufacturing skills have all contributed to Rex Materials' success.
The Asia Pacific ceramic fiber market has been divided in terms of product, form, temperature, application, and region.
Based on form, the board segment is poised to register positive market expansion over the analysis timeline facilitated by its availability in a range of temperature ratings, thicknesses, densities, lengths, and widths, as well as in bespoke vacuum-formed shapes.
On the other hand, the paper segment is slated to grow at 6.5% CAGR from 2023 to 2032 fueled by beneficial characteristics such as low thermal conductivity, temperature stability, lightweight, and low heat storage. In addition to these, exceptional attributes including strong dielectric strength, thermal shock resistance, good flame resistance, high tensile strength, and ease of cutting would add to the segmental growth.
With respect to temperature, the 1,001°C to 1,200°C segment is expected to foresee positive market expansion over the review timeline. Ceramic fibers with a temperature range of 1,001°C to 1,200°C are alkaline earth silicate ceramic fibers that are utilized in fire prevention, industrial equipment, vehicle exhaust systems, and household appliances.
In terms of application, the high-temp. pipe, duct & tube insulation segment is set to garner sizable growth through the forthcoming timeline. The expansion can be attributed to the creation of numerous new power generation projects throughout the area, particularly in Australia, Vietnam, and other nations.
Meanwhile, the others segment is speculated to advance substantially by the end of the research period spurred by the expanding demand for ceramic fiber products in the construction sector as well as the Asia Pacific's expanding steel and aluminum industries.
From the regional front, the Asia Pacific ceramic fiber market is projected to amass more than $1.7 billion by 2032. The growth of the regional market is characterized by the presence of many low-cost product producers in China, India, as well as Southeast Asian nations.
Meanwhile, the India ceramic fiber industry is estimated to attain high gains over the forecast years supported by ongoing infrastructure development projects as well as expanding residential and commercial building construction activity nationwide.
Table of Contents
Chapter 1 Methodology & Scope
- 1.1 Scope & definitions
- 1.2 Base estimates & calculations
COVID-19 impact parameters
North America
Europe
Asia Pacific
Latin America
MEA
- 1.3 Forecast calculations
- 1.4 Data Sources
- 1.4.1 Primary
- 1.4.2 Secondary
- 1.4.2.1 Paid Sources
- 1.4.2.2 Public Sources
Chapter 2 Executive Summary
- 2.1 Asia Pacific ceramic fiber market 360 degree synopsis, 2018 - 2032
- 2.1.1 Business trends
- 2.1.2 Product trends
- 2.1.3 Form trends
- 2.1.4 Temperature ratings trends
- 2.1.5 Application trends
- 2.1.6 End-user trends
- 2.1.7 Country trends
Chapter 3 Asia Pacific Ceramic Fiber Industry Insights
- 3.1 Industry segmentation
- 3.2 Industry size and forecast, 2018 - 2032
- 3.2.1 COVID-19 impact on industry landscape
- 3.3 Industry ecosystem analysis
- 3.3.1 Raw material suppliers
- 3.3.1.1 COVID-19 impact on raw material supply
- 3.3.2 Manufacturers
- 3.3.3 Profit margin
- 3.3.4 Value addition at each stage
- 3.3.5 Distributors
- 3.3.6 Value chain disruption analysis (COVID-19 impact)
- 3.3.7 Vendor matrix
- 3.3.7.1 List of key raw material suppliers
- 3.3.7.2 List of key manufactures/distributors
- 3.3.7.3 List of key potential customers
- 3.3.1 Raw material suppliers
- 3.4 Innovation & sustainability
- 3.4.1 Patent analysis
- 3.4.2 Technology landscape
- 3.4.2.1 Monolithic ceramic fiber module
- 3.4.3 Production process
- 3.4.3.1 Non oxide fiber processing
- 3.4.3.2 Preceramic polymer processing
- 3.4.3.3 Oxide fiber processing
- 3.4.4 Comparative analysis of manufacturing techniques
- 3.4.4.1 Vitreous alumina silica ceramic fiber manufacturing process
- 3.4.4.2 Crystalline alumina ceramic fiber manufacturing process
- 3.4.5 Future trends
- 3.4.5.1 Upcoming trend in the wristwatch industry
- 3.5 Industry impact forces
- 3.5.1 Growth drivers
- 3.5.1.1 Growing steel industry in the Asia Pacific region
- 3.5.1.2 Excellent thermal insulation properties of ceramic fibers
- 3.5.1.3 Rising ceramic fiber demand for alternative energy and other applications
- 3.5.2 Industry pitfalls & challenges
- 3.5.2.1 Stringent regulation pertaining to material toxicity
- 3.5.2.2 Availability of substitutes
- 3.5.1 Growth drivers
- 3.6 Regulatory trends
- 3.7 Growth potential analysis, 2022
- 3.8 Regional price trends
- 3.8.1 Cost structure analysis
- 3.8.1.1 R&D Cost
- 3.8.1.2 Manufacturing Cost
- 3.8.1.3 Raw Material Cost
- 3.8.1.4 Distribution Cost
- 3.8.1.5 Operating Cost
- 3.8.1.6 Miscellaneous Cost
- 3.8.2 Price by product
- 3.8.3 Price by end-user
- 3.8.4 COVID-19 impact on pricing
- 3.8.1 Cost structure analysis
- 3.9 Porter's analysis
- 3.9.1 Bargaining power of suppliers
- 3.9.2 Bargaining power of buyers
- 3.9.3 Threat of new entrants
- 3.9.4 Threat of substitutes
- 3.10 PESTEL analysis
- 3.11 COVID-19 impact on ceramic fiber demand by end-user
- 3.11.1 Oil & gas
- 3.11.2 Iron & steel
- 3.11.3 Power generation
- 3.11.4 Aluminum
- 3.11.5 Chemical Processing Industry (CPI)
- 3.11.6 Ceramics
- 3.11.7 Others
- 3.12 Impact of Russia-Ukraine war impact on Asia Pacific ceramic fiber market
Chapter 4 Competitive Landscape, 2022
- 4.1 Introduction
- 4.2 Company market share, 2022
- 4.3 Competitive analysis of major market players
- 4.3.1 Morgan Advanced Materials PLC.
- 4.3.2 IBIDEN
- 4.3.3 Rath Inc.
- 4.3.4 Luyang Energy-saving Materials Co., Ltd.
- 4.4 Vendor adoption matrix
- 4.5 Strategic outlook matrix
Chapter 5 Asia Pacific Ceramic Fiber Market, By Product
- 5.1 Asia Pacific ceramic fiber market share by product, 2022 & 2032
- 5.2 Refractory Ceramic Fiber (RCF)
- 5.2.1 Asia Pacific market estimates & forecast, 2018-2032, (Tons) (USD Million)
- 5.2.2 Asia Pacific market estimates & forecast, by country, 2018-2032, (Tons) (USD Million)
- 5.3 Alkaline Earth Silicate (AES)
- 5.3.1 Asia Pacific market estimates & forecast, 2018-2032, (Tons) (USD Million)
- 5.3.2 Asia Pacific market estimates & forecast, by country, 2018-2032, (Tons) (USD Million)
- 5.4 Others
- 5.4.1 Asia Pacific market estimates & forecast, 2018-2032, (Tons) (USD Million)
- 5.4.2 Asia Pacific market estimates & forecast, by country, 2018-2032, (Tons) (USD Million)
Chapter 6 Asia Pacific Ceramic Fiber Market, By Form
- 6.1 Asia Pacific ceramic fiber market share by form, 2022 & 2032
- 6.2 Blanket
- 6.2.1 Asia Pacific market estimates & forecast, 2018-2032, (Tons) (USD Million)
- 6.2.2 Asia Pacific market estimates & forecast, by country, 2018-2032, (Tons) (USD Million)
- 6.3 Module
- 6.3.1 Asia Pacific market estimates & forecast, 2018-2032, (Tons) (USD Million)
- 6.3.2 Asia Pacific market estimates & forecast, by country, 2018-2032, (Tons) (USD Million)
- 6.4 Board
- 6.4.1 Asia Pacific market estimates & forecast, 2018-2032, (Tons) (USD Million)
- 6.4.2 Asia Pacific market estimates & forecast, by country, 2018-2032, (Tons) (USD Million)
- 6.5 Paper
- 6.5.1 Asia Pacific market estimates & forecast, 2018-2032, (Tons) (USD Million)
- 6.5.2 Asia Pacific market estimates & forecast, by country, 2018-2032, (Tons) (USD Million)
- 6.6 Others
- 6.6.1 Asia Pacific market estimates & forecast, 2018-2032, (Tons) (USD Million)
- 6.6.2 Asia Pacific market estimates & forecast, by country, 2018-2032,(Tons)(USD Million)
Chapter 7 Asia Pacific Ceramic Fiber Market, By Temperature Rating
- 7.1 Asia Pacific ceramic fiber market share by temperature rating, 2022 & 2032
- 7.2 Up to 1000
- 7.2.1 Asia Pacific market estimates & forecast, 2018-2032, (Tons) (USD Million)
- 7.2.2 Asia Pacific market estimates & forecast, by country, 2018-2032, (Tons) (USD Million)
- 7.3 1001 to 1200
- 7.3.1 Asia Pacific market estimates & forecast, 2018-2032, (Tons) (USD Million)
- 7.3.2 Asia Pacific market estimates & forecast, by country, 2018-2032, (Tons) (USD Million)
- 7.4 1201 to 1400
- 7.4.1 Asia Pacific market estimates & forecast, 2018-2032, (Tons) (USD Million)
- 7.4.2 Asia Pacific market estimates & forecast, by country, 2018-2032, (Tons) (USD Million)
- 7.5 Over 1400
- 7.5.1 Asia Pacific market estimates & forecast, 2018-2032, (Tons) (USD Million)
- 7.5.2 Asia Pacific market estimates & forecast, by country, 2018-2032, (Tons) (USD Million)
Chapter 8 Asia Pacific Ceramic Fiber Market, By Application
- 8.1 Asia Pacific ceramic fiber market share by application, 2022 & 2032
- 8.2 Expansion Joint fiber barriers
- 8.2.1 Asia Pacific market estimates & forecast, 2018-2032, (Tons) (USD Million)
- 8.2.2 Asia Pacific market estimates & forecast, by country, 2018-2032, (Tons) (USD Million)
- 8.3 High temp. pipe, duct & tube insulation
- 8.3.1 Asia Pacific market estimates & forecast, 2018-2032, (Tons) (USD Million)
- 8.3.2 Asia Pacific market estimates & forecast, by country, 2018-2032, (Tons) (USD Million)
- 8.4 Industry furnace base seal
- 8.4.1 Asia Pacific market estimates & forecast, 2018-2032, (Tons) (USD Million)
- 8.4.2 Asia Pacific market estimates & forecast, by country, 2018-2032, (Tons) (USD Million)
- 8.5 Fire dampers/celing diffusers
- 8.5.1 Asia Pacific market estimates & forecast, 2018-2032, (Tons) (USD Million)
- 8.5.2 Asia Pacific market estimates & forecast, by country, 2018-2032, (Tons) (USD Million)
- 8.6 High- temperature gasketing & packing
- 8.6.1 Asia Pacific market estimates & forecast, 2018-2032, (Tons) (USD Million)
- 8.6.2 Asia Pacific market estimates & forecast, by country, 2018-2032, (Tons) (USD Million)
- 8.7 Others
- 8.7.1 Asia Pacific market estimates & forecast, 2018-2032, (Tons) (USD Million)
- 8.7.2 Asia Pacific market estimates & forecast, by country, 2018-2032, (Tons) (USD Million)
Chapter 9 Asia Pacific Ceramic Fiber Market, By End-user
- 9.1 Asia Pacific ceramic fiber market share by end-user industry, 2022 & 2032
- 9.2 Oil & Gas
- 9.2.1 Asia Pacific market estimates & forecast, 2018-2032, (Tons) (USD Million)
- 9.2.2 Asia Pacific market estimates & forecast, by country, 2018-2032, (Tons) (USD Million)
- 9.3 Iron & Steel
- 9.3.1 Asia Pacific market estimates & forecast, 2018-2032, (Tons) (USD Million)
- 9.3.2 Asia Pacific market estimates & forecast, by country, 2018-2032, (Tons) (USD Million)
- 9.4 Power Generation
- 9.4.1 Asia Pacific market estimates & forecast, 2018-2032, (Tons) (USD Million)
- 9.4.2 Asia Pacific market estimates & forecast, by country, 2018-2032, (Tons) (USD Million)
- 9.5 Aluminum
- 9.5.1 Asia Pacific market estimates & forecast, 2018-2032, (Tons) (USD Million)
- 9.5.2 Asia Pacific market estimates & forecast, by country, 2018-2032, (Tons) (USD Million)
- 9.6 Chemical Processing Industry
- 9.6.1 Asia Pacific market estimates & forecast, 2018-2032, (Tons) (USD Million)
- 9.6.2 Asia Pacific market estimates & forecast, by country, 2018-2032, (Tons) (USD Million)
- 9.7 Ceramics
- 9.7.1 Asia Pacific market estimates & forecast, 2018-2032, (Tons) (USD Million)
- 9.7.2 Asia Pacific market estimates & forecast, by country, 2018-2032, (Tons) (USD Million)
- 9.8 Others
- 9.8.1 Asia Pacific market estimates & forecast, 2018-2032, (Tons) (USD Million)
- 9.8.2 Asia Pacific market estimates & forecast, by country, 2018-2032, (Tons) (USD Million)
Chapter 10 Asia Pacific Ceramic Fiber Market, By Country
- 10.1 Asia Pacific ceramic fibre market, share by country, 2022 & 2032
- 10.2 Japan
- 10.2.1 Market estimates & forecast, 2018-2032, (Tons) (USD Million)
- 10.2.2 Market estimates & forecast, by product, 2018 - 2032, (Tons) (USD Million)
- 10.2.3 Market estimates & forecast, by form, 2018 - 2032, (Tons) (USD Million)
- 10.2.4 Market estimates & forecast, by temperature rating, 2018 - 2032, (Tons) (USD Million)
- 10.2.5 Market estimates & forecast, by application, 2018 - 2032, (Tons) (USD Million)
- 10.2.6 Market estimates & forecast, by end-use industry, 2018 - 2032, (Tons) (USD Million)
- 10.3 India
- 10.3.1 Market estimates & forecast, 2018-2032, (Tons) (USD Million)
- 10.3.2 Market estimates & forecast, by product, 2018 - 2032, (Tons) (USD Million)
- 10.3.3 Market estimates & forecast, by form, 2018 - 2032, (Tons) (USD Million)
- 10.3.4 Market estimates & forecast, by temperature rating, 2018 - 2032, (Tons) (USD Million)
- 10.3.5 Market estimates & forecast, by application, 2018 - 2032, (Tons) (USD Million)
- 10.3.6 Market estimates & forecast, by end-use industry, 2018 - 2032, (Tons) (USD Million)
- 10.4 Australia
- 10.4.1 Market estimates & forecast, 2018-2032, (Tons) (USD Million)
- 10.4.2 Market estimates & forecast, by product, 2018 - 2032, (Tons) (USD Million)
- 10.4.3 Market estimates & forecast, by form, 2018 - 2032, (Tons) (USD Million)
- 10.4.4 Market estimates & forecast, by temperature rating, 2018 - 2032, (Tons) (USD Million)
- 10.4.5 Market estimates & forecast, by application, 2018 - 2032, (Tons) (USD Million)
- 10.4.6 Market estimates & forecast, by end-use industry, 2018 - 2032, (Tons) (USD Million)
- 10.5 Indonesia
- 10.5.1 Market estimates & forecast, 2018-2032, (Tons) (USD Million)
- 10.5.2 Market estimates & forecast, by product, 2018 - 2032, (Tons) (USD Million)
- 10.5.3 Market estimates & forecast, by form, 2018 - 2032, (Tons) (USD Million)
- 10.5.4 Market estimates & forecast, by temperature rating, 2018 - 2032, (Tons) (USD Million)
- 10.5.5 Market estimates & forecast, by application, 2018 - 2032, (Tons) (USD Million)
- 10.5.6 Market estimates & forecast, by end-use industry, 2018 - 2032, (Tons) (USD Million)
- 10.6 Malaysia
- 10.6.1 Market estimates & forecast, 2018-2032, (Tons) (USD Million)
- 10.6.2 Market estimates & forecast, by product, 2018 - 2032, (Tons) (USD Million)
- 10.6.3 Market estimates & forecast, by form, 2018 - 2032, (Tons) (USD Million)
- 10.6.4 Market estimates & forecast, by temperature rating, 2018 - 2032, (Tons) (USD Million)
- 10.6.5 Market estimates & forecast, by application, 2018 - 2032, (Tons) (USD Million)
- 10.6.6 Market estimates & forecast, by end-use industry, 2018 - 2032, (Tons) (USD Million)
- 10.7 South Korea
- 10.7.1 Market estimates & forecast, 2018-2032, (Tons) (USD Million)
- 10.7.2 Market estimates & forecast, by product, 2018 - 2032, (Tons) (USD Million)
- 10.7.3 Market estimates & forecast, by form, 2018 - 2032, (Tons) (USD Million)
- 10.7.4 Market estimates & forecast, by temperature rating, 2018 - 2032, (Tons) (USD Million)
- 10.7.5 Market estimates & forecast, by application, 2018 - 2032, (Tons) (USD Million)
- 10.7.6 Market estimates & forecast, by end-use industry, 2018 - 2032, (Tons) (USD Million)
- 10.8 Vietnam
- 10.8.1 Market estimates & forecast, 2018-2032, (Tons) (USD Million)
- 10.8.2 Market estimates & forecast, by product, 2018 - 2032, (Tons) (USD Million)
- 10.8.3 Market estimates & forecast, by form, 2018 - 2032, (Tons) (USD Million)
- 10.8.4 Market estimates & forecast, by temperature rating, 2018 - 2032, (Tons) (USD Million)
- 10.8.5 Market estimates & forecast, by application, 2018 - 2032, (Tons) (USD Million)
- 10.8.6 Market estimates & forecast, by end-use industry, 2018 - 2032, (Tons) (USD Million)
- 10.9 Thailand
- 10.9.1 Market estimates & forecast, 2018-2032, (Tons) (USD Million)
- 10.9.2 Market estimates & forecast, by product, 2018 - 2032, (Tons) (USD Million)
- 10.9.3 Market estimates & forecast, by form, 2018 - 2032, (Tons) (USD Million)
- 10.9.4 Market estimates & forecast, by temperature rating, 2018 - 2032, (Tons) (USD Million)
- 10.9.5 Market estimates & forecast, by application, 2018 - 2032, (Tons) (USD Million)
- 10.9.6 Market estimates & forecast, by end-use industry, 2018 - 2032, (Tons) (USD Million)
- 10.10 Philippines
- 10.10.1 Market estimates & forecast, 2018-2032, (Tons) (USD Million)
- 10.10.2 Market estimates & forecast, by product, 2018 - 2032, (Tons) (USD Million)
- 10.10.3 Market estimates & forecast, by form, 2018 - 2032, (Tons) (USD Million)
- 10.10.4 Market estimates & forecast, by temperature rating, 2018 - 2032, (Tons) (USD Million)
- 10.10.5 Market estimates & forecast, by application, 2018 - 2032, (Tons) (USD Million)
- 10.10.6 Market estimates & forecast, by end-use industry, 2018 - 2032, (Tons) (USD Million)
- 10.11 China
- 10.11.1 Market estimates & forecast, 2018-2032, (Tons) (USD Million)
- 10.11.2 Market estimates & forecast, by product, 2018 - 2032, (Tons) (USD Million)
- 10.11.3 Market estimates & forecast, by form, 2018 - 2032, (Tons) (USD Million)
- 10.11.4 Market estimates & forecast, by temperature rating, 2018 - 2032, (Tons) (USD Million)
- 10.11.5 Market estimates & forecast, by application, 2018 - 2032, (Tons) (USD Million)
- 10.11.6 Market estimates & forecast, by end-use industry, 2018 - 2032, (Tons) (USD Million)
- 10.12 Taiwan
- 10.12.1 Market estimates & forecast, 2018-2032, (Tons) (USD Million)
- 10.12.2 Market estimates & forecast, by product, 2018 - 2032, (Tons) (USD Million)
- 10.12.3 Market estimates & forecast, by form, 2018 - 2032, (Tons) (USD Million)
- 10.12.4 Market estimates & forecast, by temperature rating, 2018 - 2032, (Tons) (USD Million)
- 10.12.5 Market estimates & forecast, by application, 2018 - 2032, (Tons) (USD Million)
- 10.12.6 Market estimates & forecast, by end-use industry, 2018 - 2032, (Tons) (USD Million)
- 10.13 Singapore
- 10.13.1 Market estimates & forecast, 2018-2032, (Tons) (USD Million)
- 10.13.2 Market estimates & forecast, by product, 2018 - 2032, (Tons) (USD Million)
- 10.13.3 Market estimates & forecast, by form, 2018 - 2032, (Tons) (USD Million)
- 10.13.4 Market estimates & forecast, by temperature rating, 2018 - 2032, (Tons) (USD Million)
- 10.13.5 Market estimates & forecast, by application, 2018 - 2032, (Tons) (USD Million)
- 10.13.6 Market estimates & forecast, by end-use industry, 2018 - 2032, (Tons) (USD Million)
Chapter 11 Company Profiles
- 11.1 Unifrax I LLC.
- 11.1.1 Business overview
- 11.1.2 Financial data
- 11.1.3 Product landscape
- 11.1.4 Go-to-Market Strategy
- 11.1.5 SWOT analysis
- 11.2 Morgan Advanced Materials PLC.
- 11.2.1 Business overview
- 11.2.2 Financial data
- 11.2.3 Product landscape
- 11.2.4 Go-To-Market Strategy
- 11.2.5 SWOT analysis
- 11.3 Ibiden Co. Ltd.
- 11.3.1 Business overview
- 11.3.2 Financial data
- 11.3.3 Product landscape
- 11.3.4 SWOT analysis
- 11.4 Isolite Insulating Products Co., Ltd.
- 11.4.1 Business overview
- 11.4.2 Financial data
- 11.4.3 Product landscape
- 11.4.4 Go-To-Market Strategy
- 11.4.5 SWOT analysis
- 11.5 Luyang Energy-saving Materials Co., Ltd.
- 11.5.1 Business Overview
- 11.5.2 Financial Data
- 11.5.3 Product Landscape
- 11.5.4 Go-To-Market Strategy
- 11.5.5 Swot Analysis
- 11.6 Nutec Fibratec
- 11.6.1 Business overview
- 11.6.2 Financial data
- 11.6.3 Product landscape
- 11.6.4 SWOT analysis
- 11.7 Yeso Insulating Products Co., Ltd.
- 11.7.1 Business overview
- 11.7.2 Financial data
- 11.7.3 Product landscape
- 11.7.4 SWOT analysis
- 11.8 Rath Inc.
- 11.8.1 Business overview
- 11.8.2 Financial data
- 11.8.3 Product landscape
- 11.8.4 SWOT analysis
- 11.9 Lewco Specialty Products
- 11.9.1 Business overview
- 11.9.2 Financial data
- 11.9.3 Product landscape
- 11.9.4 SWOT analysis
- 11.10 PAR Group
- 11.10.1 Business overview
- 11.10.2 Financial data
- 11.10.3 Product landscape
- 11.10.4 SWOT analysis
- 11.11 NGP Industries Limited
- 11.11.1 Business overview
- 11.11.2 Financial data
- 11.11.3 Product landscape
- 11.11.4 SWOT analysis
- 11.12 Simond Fibertech Limited
- 11.12.1 Business overview
- 11.12.2 Financial data
- 11.12.3 Product landscape
- 11.12.4 SWOT analysis