|
|
市場調査レポート
商品コード
1269640
ワイヤー・ケーブルの欧州市場規模:製品別(同軸ケーブル/電子ワイヤ、光ファイバーケーブル、電力ケーブル、信号・制御ケーブル、通信・データケーブル)、電圧別、用途別、世界予測:2023年~2032年Europe Wire and Cable Market Size By Product (Coaxial Cables/Electronic Wires, Fiber Optics Cables, Power Cables, Signal & Control Cable, Telecom & Data Cables), By Voltage, Application, & Global Forecast, 2023 - 2032 |
||||||
|
|
|||||||
|
● お客様のご希望に応じて、既存データの加工や未掲載情報(例:国別セグメント)の追加などの対応が可能です。 詳細はお問い合わせください。 |
|||||||


| ワイヤー・ケーブルの欧州市場規模:製品別(同軸ケーブル/電子ワイヤ、光ファイバーケーブル、電力ケーブル、信号・制御ケーブル、通信・データケーブル)、電圧別、用途別、世界予測:2023年~2032年 |
|
出版日: 2023年04月25日
発行: Global Market Insights Inc.
ページ情報: 英文 360 Pages
納期: 2~3営業日
|
- 全表示
- 概要
- 図表
- 目次
欧州のワイヤー・ケーブル市場のシェアは、スマートグリッド導入の拡大と、効果的なグリッド技術による再生可能エネルギー統合プログラムの急増により、2030年まで顕著な成長を遂げると思われます。
エネルギー・気候変動省によると、2021年には英国で800万個のスマートメーターが設置され、データ通信会社に接続された記録があります。
さらに、効果的なエネルギー管理のための新しい高度なソリューションで、既存および古い電力インフラを刷新することは、2022年から2030年の間の市場成長を補完することになります。
欧州のワイヤー・ケーブル市場全体は、製品、電圧、アプリケーション、地域に基づいて分割されています。
製品別では、光ファイバーケーブルが市場の伸びを牽引すると思われます。長距離・高性能データネットワーク、特に通信サービスのための技術的進歩が、このセグメントの拡大に寄与すると思われます。また、家電製品の普及が進み、高速インターネットへの依存度が高まっていることも、市場情勢に拍車をかけると考えられます。
一方、通信・データセンター分野は、2021年に10億米ドル以上の市場シェアを占め、2030年まで大きく成長すると予測されています。この成長は、老朽化した通信インフラの交換・改修需要の高まりと、通信ネットワークを強化するための研究開発プロジェクトへの高額な投資によるものと考えられます。
電圧の面では、高電圧ワイヤーとケーブルが市場で顕著な伸びを示しています。欧州では、エネルギー需要の増大と送電網の老朽化が、業界の成長を後押ししているようです。また、スマートグリッドの急速な普及と電力網のIT化により、同地域での製品展開がさらに強化されるでしょう。
自動車産業は、欧州のワイヤー・ケーブル産業の中で最も高い収益を上げるアプリケーションのひとつになると予想されています。市場成長の要因は、持続可能でクリーンな自動車の導入に対する関心の高まりと、同地域における商用車の販売と要件の急増です。OICAの統計によると、ドイツでは2021年に21万台を超える商用車の生産が記録されました。
一方、レジャーやアミューズメント活動への消費者の傾倒と、プロモーション用ライブイベントの増加により、2022年から2030年にかけて製品の導入が促進され、業界全体におけるエンターテイメント/レジャー分野が活性化すると考えられます。
地域的には、欧州のワイヤー・ケーブル産業は、ロシア、ドイツ、フランス、英国に分散されています。なかでも英国は、二酸化炭素排出量を削減するため、政府によるEV導入の奨励策を導入しており、2030年末までにかなりの利益を上げると予想されています。また、クリーンで持続可能なエネルギー需要を支えるための送電・配電プロジェクトが進行中であり、市場の需要をさらに促進させるでしょう。
目次
第1章 調査手法とスコープ
第2章 欧州のワイヤー・ケーブル産業洞察
- 産業エコシステム分析
- ベンダーマトリクス
- 規制状況について
- The Exclusive Economic Zone and Continental Shelf Laws of 2004 and 2014
- 規格
- 電気的仕様
- メカニカル仕様
- 欧州
- Regulation (EU) 2017/1485 — Guideline on electricity transmission system operation
- キーポイント
- 一般的な側面
- テクニカルセクション
- 爆発物施設における電気設備・機器の安全基準(英国)
- ケーブルに関する英国火災安全規制
- 電力供給当局の架空送電線からの保護
- 架空線の位置、絶縁、保護について
- 爆発物エリア内の配電について
- 道路と鉄道の交差点
- European Construction Products Regulation (CPR)
- Regulation (EU) 2017/1485 — Guideline on electricity transmission system operation
- ポーランド
- ロシア
- The Exclusive Economic Zone and Continental Shelf Laws of 2004 and 2014
- 業界への影響要因
- 促進要因
- 盛んな通信・インターネット産業
- スマートグリッドネットワークの採用
- 拡大するインフラ投資
- 業界の潜在的リスク&課題
- 輸入依存度が高い
- 促進要因
- COVID-19業界の展望に与える影響について
- 全体シナリオ
- 成長性分析
- ポーターの分析
- PESTEL分析
第3章 競合ベンチマーキング
- イノベーションとサステナビリティの展望
- Prysmian Group
- Nexans
- Sumitomo Electric Industries Limited
- NKT A/S
- Lapp Group
- igus
- HELUKABEL
- Friedrich Lütze GmbH
- TFKable
- Kabelwerk Eupen AG
- 競合情勢、2022年
- 戦略ダッシュボード
- Prysmian Group
- Nexans
- Furukawa Electric Co., Ltd.
- Elsewedy Electric
- igus
- HELUKABEL
- Viakon
- Shawcor
- Hellenic Group
- Kabelwerk Eupen AG
- 戦略ダッシュボード
第4章 欧州のワイヤー・ケーブル市場:製品別
- 主な製品動向
- 同軸ケーブル/電子線
- 光ファイバーケーブル
- 電源ケーブル
- 信号・制御
- 通信・データ
第5章 欧州のワイヤー・ケーブル市場:電圧別
- 主な電圧動向
- 低電圧
- 中電圧
- 高電圧
第6章 欧州のワイヤー・ケーブル市場:用途別
- 主なアプリケーション動向
- 飲食品
- 自動車
- マテリアルハンドリング/ロジスティクス
- エンターテインメント/レジャー
- ユーティリティ
- 鉄道
- コンシューマーエレクトロニクス
- インフラ構築
- その他
第7章 欧州のワイヤー・ケーブル市場:国別一覧
- 主な国の動向
- 英国
- フランス
- オランダ
- イタリア
- スペイン
- スウェーデン
- デンマーク
- ベルギー
- ドイツ
- ポーランド
- ロシア
- ギリシア
- チェコ共和国
- ルーマニア
- ハンガリー
- ボスニア
- クロアチア
- マケドニア
- モンテネグロ
- セルビア
- スロベニア
第8章 企業プロファイル
- Prysmian Group
- Nexans
- Sumitomo Electric Industries Limited
- NKT A/S
- Belden Inc.
- LS Cable & System Ltd.
- Furukawa Electric Co., Ltd.
- CommScope
- Lapp Group
- Elsewedy Electric
- igus
- HELUKABEL GmbH
- Friedrich Lütze GmbH
- Viakon
- Shawcor
- SAB Bröckskes GmbH & Co. KG
- Waskönig & Walter(DE)
- Klaus Faber AG
- Dätwyler IT Infra GmbH
- Studer Cables AG
- Hellenic Group
- TFKable
- TKH GROUP
- Tecnikabel SpA
- Kabelwerk Eupen AG
Data Tables
- TABLE 1 Industry impact forces
- TABLE 2 Europe market from coaxial cables/electronic wires, 2019 - 2022 (Revenue)
- TABLE 3 Europe market from coaxial cables/electronic wires, 2023 - 2028 (Revenue)
- TABLE 4 Europe market from coaxial cables/electronic wires, 2029 - 2032 (Revenue)
- TABLE 5 Europe market from coaxial cables/electronic wires, by country, 2019 - 2022 (USD Million)
- TABLE 6 Europe market from coaxial cables/electronic wires, by country, 2023 - 2028 (USD Million)
- TABLE 7 Europe market from coaxial cables/electronic wires, by country, 2029 - 2032 (USD Million)
- TABLE 8 Europe market from fiber optics cable, 2019 - 2022 (Revenue)
- TABLE 9 Europe market from fiber optics cable, 2023 - 2028 (Revenue)
- TABLE 10 Europe market from fiber optics cable, 2029 - 2032 (Revenue)
- TABLE 11 Europe market from fiber optics cable, by country, 2019 - 2022 (USD Million)
- TABLE 12 Europe market from fiber optics cable, by country, 2023 - 2028 (USD Million)
- TABLE 13 Europe market from fiber optics cable, by country, 2029 - 2032 (USD Million)
- TABLE 14 Europe market from power cables, 2019 - 2022 (Revenue)
- TABLE 15 Europe market from power cables, 2023 - 2028 (Revenue)
- TABLE 16 Europe market from power cables, 2029 - 2032 (Revenue)
- TABLE 17 Europe market from power cables, by country, 2019 - 2022 (USD Million)
- TABLE 18 Europe market from power cables, by country, 2023 - 2028 (USD Million)
- TABLE 19 Europe market from power cables, by country, 2029 - 2032 (USD Million)
- TABLE 20 Europe market from signal & control, 2019 - 2022 (Revenue)
- TABLE 21 Europe market from signal & control, 2023 - 2028 (Revenue)
- TABLE 22 Europe market from signal & control, 2029 - 2032 (Revenue)
- TABLE 23 Europe market from signal & control, by country, 2019 - 2022 (USD Million)
- TABLE 24 Europe market from signal & control, by country, 2023 - 2028 (USD Million)
- TABLE 25 Europe market from signal & control, by country, 2029 - 2032 (USD Million)
- TABLE 26 Europe market from telecom & data, 2019 - 2022 (Revenue)
- TABLE 27 Europe market from telecom & data, 2023 - 2028 (Revenue)
- TABLE 28 Europe market from telecom & data, 2029 - 2032 (Revenue)
- TABLE 29 Europe market from telecom & data, by country, 2019 - 2022 (USD Million)
- TABLE 30 Europe market from telecom & data, by country, 2023 - 2028 (USD Million)
- TABLE 31 Europe market from telecom & data, by country, 2029 - 2032 (USD Million)
- TABLE 32 Europe market from low, 2019 - 2022 (Revenue)
- TABLE 33 Europe market from low, 2023 - 2028 (Revenue)
- TABLE 34 Europe market from low, 2029 - 2032 (Revenue)
- TABLE 35 Europe market from low, by country, 2019 - 2022 (USD Million)
- TABLE 36 Europe market from low, by country, 2023 - 2028 (USD Million)
- TABLE 37 Europe market from low, by country, 2029 - 2032 (USD Million)
- TABLE 38 Europe market from medium, 2019 - 2022 (Revenue)
- TABLE 39 Europe market from medium, 2023 - 2028 (Revenue)
- TABLE 40 Europe market from medium, 2029 - 2032 (Revenue)
- TABLE 41 Europe market from medium, by country, 2019 - 2022 (USD Million)
- TABLE 42 Europe market from medium, by country, 2023 - 2028 (USD Million)
- TABLE 43 Europe market from medium, by country, 2029 - 2032 (USD Million)
- TABLE 44 Europe market from high, 2019 - 2022 (Revenue)
- TABLE 45 Europe market from high, 2023 - 2028 (Revenue)
- TABLE 46 Europe market from high, 2029 - 2032 (Revenue)
- TABLE 47 Europe market from high, by country, 2019 - 2022 (USD Million)
- TABLE 48 Europe market from high, by country, 2023 - 2028 (USD Million)
- TABLE 49 Europe market from high, by country, 2029 - 2032 (USD Million)
- TABLE 50 Europe market from food & beverages, 2019 - 2022 (Revenue)
- TABLE 51 Europe market from food & beverages, 2023 - 2028 (Revenue)
- TABLE 52 Europe market from food & beverages, 2029 - 2032 (Revenue)
- TABLE 53 Europe market from food & beverages, by country, 2019 - 2022 (USD Million)
- TABLE 54 Europe market from food & beverages, by country, 2023 - 2028 (USD Million)
- TABLE 55 Europe market from food & beverages, by country, 2029 - 2032 (USD Million)
- TABLE 56 Europe market from automotive, 2019 - 2022 (Revenue)
- TABLE 57 Europe market from automotive, 2023 - 2028 (Revenue)
- TABLE 58 Europe market from automotive, 2029 - 2032 (Revenue)
- TABLE 59 Europe market from automotive, by country, 2019 - 2022 (USD Million)
- TABLE 60 Europe market from automotive, by country, 2023 - 2028 (USD Million)
- TABLE 61 Europe market from automotive, by country, 2029 - 2032 (USD Million)
- TABLE 62 Europe market from material handling/logistics, 2019 - 2022 (Revenue)
- TABLE 63 Europe market from material handling/logistics, 2023 - 2028 (Revenue)
- TABLE 64 Europe market from material handling/logistics, 2029 - 2032 (Revenue)
- TABLE 65 Europe market from material handling/logistics, by country, 2019 - 2022 (USD Million)
- TABLE 66 Europe market from material handling/logistics, by country, 2023 - 2028 (USD Million)
- TABLE 67 Europe market from material handling/logistics, by country, 2029 - 2032 (USD Million)
- TABLE 68 Europe market from entertainment/leisure, 2019 - 2022 (Revenue)
- TABLE 69 Europe market from entertainment/leisure, 2023 - 2028 (Revenue)
- TABLE 70 Europe market from entertainment/leisure, 2029 - 2032 (Revenue)
- TABLE 71 Europe market from entertainment/leisure, by country, 2019 - 2022 (USD Million)
- TABLE 72 Europe market from entertainment/leisure, by country, 2023 - 2028 (USD Million)
- TABLE 73 Europe market from entertainment/leisure, by country, 2029 - 2032 (USD Million)
- TABLE 74 Europe market from utilities, 2019 - 2022 (Revenue)
- TABLE 75 Europe market from utilities, 2023 - 2028 (Revenue)
- TABLE 76 Europe market from utilities, 2029 - 2032 (Revenue)
- TABLE 77 Europe market from utilities, by country, 2019 - 2022 (USD Million)
- TABLE 78 Europe market from utilities, by country, 2023 - 2028 (USD Million)
- TABLE 79 Europe market from utilities, by country, 2029 - 2032 (USD Million)
- TABLE 80 Europe market from railways, 2019 - 2022 (Revenue)
- TABLE 81 Europe market from railways, 2023 - 2028 (Revenue)
- TABLE 82 Europe market from railways, 2029 - 2032 (Revenue)
- TABLE 83 Europe market from railways, by country, 2019 - 2022 (USD Million)
- TABLE 84 Europe market from railways, by country, 2023 - 2028 (USD Million)
- TABLE 85 Europe market from railways, by country, 2029 - 2032 (USD Million)
- TABLE 86 Europe market from consumer electronics, 2019 - 2022 (Revenue)
- TABLE 87 Europe market from consumer electronics, 2023 - 2028 (Revenue)
- TABLE 88 Europe market from consumer electronics, 2029 - 2032 (Revenue)
- TABLE 89 Europe market from consumer electronics, by country, 2019 - 2022 (USD Million)
- TABLE 90 Europe market from consumer electronics, by country, 2023 - 2028 (USD Million)
- TABLE 91 Europe market from consumer electronics, by country, 2029 - 2032 (USD Million)
- TABLE 92 Europe market from building infrastructure, 2019 - 2022 (Revenue)
- TABLE 93 Europe market from building infrastructure, 2023 - 2028 (Revenue)
- TABLE 94 Europe market from building infrastructure, 2029 - 2032 (Revenue)
- TABLE 95 Europe market from building infrastructure, by country, 2019 - 2022 (USD Million)
- TABLE 96 Europe market from building infrastructure, by country, 2023 - 2028 (USD Million)
- TABLE 97 Europe market from building infrastructure, by country, 2029 - 2032 (USD Million)
- TABLE 98 Europe market from others, 2019 - 2022 (Revenue)
- TABLE 99 Europe market from others, 2023 - 2028 (Revenue)
- TABLE 100 Europe market from others, 2029 - 2032 (Revenue)
- TABLE 101 Europe market from others, by country, 2019 - 2022 (USD Million)
- TABLE 102 Europe market from others, by country, 2023 - 2028 (USD Million)
- TABLE 103 Europe market from others, by country, 2029 - 2032 (USD Million)
- TABLE 104 UK market, 2019 - 2022 (Revenue)
- TABLE 105 UK market, 2023 - 2028 (Revenue)
- TABLE 106 UK market, 2029 - 2032 (Revenue)
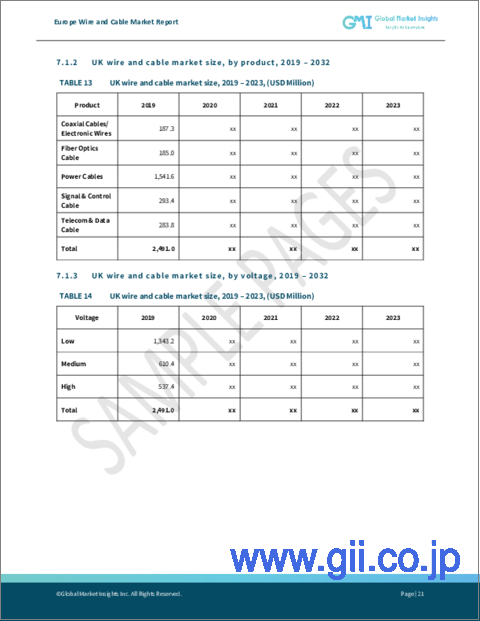
- TABLE 107 UK market by product, 2019 - 2022 (USD Million)
- TABLE 108 UK market by product, 2023 - 2028 (USD Million)
- TABLE 109 UK market by product, 2029 - 2032 (USD Million)
- TABLE 110 UK market by voltage, 2019 - 2022 (USD Million)
- TABLE 111 UK market by voltage, 2023 - 2028 (USD Million)
- TABLE 112 UK market by voltage, 2029 - 2032 (USD Million)
- TABLE 113 UK market by application, 2019 - 2022 (USD Million)
- TABLE 114 UK market by application, 2023 - 2028 (USD Million)
- TABLE 115 UK market by application, 2029 - 2032 (USD Million)
- TABLE 116 France market, 2019 - 2022 (Revenue)
- TABLE 117 France market, 2023 - 2028 (Revenue)
- TABLE 118 France market, 2029 - 2032 (Revenue)
- TABLE 119 France market by product, 2019 - 2022 (USD Million)
- TABLE 120 France market by product, 2023 - 2028 (USD Million)
- TABLE 121 France market by product, 2029 - 2032 (USD Million)
- TABLE 122 France market by voltage, 2019 - 2022 (USD Million)
- TABLE 123 France market by voltage, 2023 - 2028 (USD Million)
- TABLE 124 France market by voltage, 2029 - 2032 (USD Million)
- TABLE 125 France market by application, 2019 - 2022 (USD Million)
- TABLE 126 France market by application, 2023 - 2028 (USD Million)
- TABLE 127 France market by application, 2029 - 2032 (USD Million)
- TABLE 128 Netherlands market, 2019 - 2022 (Revenue)
- TABLE 129 Netherlands market, 2023 - 2028 (Revenue)
- TABLE 130 Netherlands market, 2029 - 2032 (Revenue)
- TABLE 131 Netherlands market by product, 2019 - 2022 (USD Million)
- TABLE 132 Netherlands market by product, 2023 - 2028 (USD Million)
- TABLE 133 Netherlands market by product, 2029 - 2032 (USD Million)
- TABLE 134 Netherlands market by voltage, 2019 - 2022 (USD Million)
- TABLE 135 Netherlands market by voltage, 2023 - 2028 (USD Million)
- TABLE 136 Netherlands market by voltage, 2029 - 2032 (USD Million)
- TABLE 137 Netherlands market by application, 2019 - 2022 (USD Million)
- TABLE 138 Netherlands market by application, 2023 - 2028 (USD Million)
- TABLE 139 Netherlands market by application, 2029 - 2032 (USD Million)
- TABLE 140 Italy market, 2019 - 2022 (Revenue)
- TABLE 141 Italy market, 2023 - 2028 (Revenue)
- TABLE 142 Italy market, 2029 - 2032 (Revenue)
- TABLE 143 Italy market by product, 2019 - 2022 (USD Million)
- TABLE 144 Italy market by product, 2023 - 2028 (USD Million)
- TABLE 145 Italy market by product, 2029 - 2032 (USD Million)
- TABLE 146 Italy market by voltage, 2019 - 2022 (USD Million)
- TABLE 147 Italy market by voltage, 2023 - 2028 (USD Million)
- TABLE 148 Italy market by voltage, 2029 - 2032 (USD Million)
- TABLE 149 Italy market by application, 2019 - 2022 (USD Million)
- TABLE 150 Italy market by application, 2023 - 2028 (USD Million)
- TABLE 151 Italy market by application, 2029 - 2032 (USD Million)
- TABLE 152 Spain market, 2019 - 2022 (Revenue)
- TABLE 153 Spain market, 2023 - 2028 (Revenue)
- TABLE 154 Spain market, 2029 - 2032 (Revenue)
- TABLE 155 Spain market by product, 2019 - 2022 (USD Million)
- TABLE 156 Spain market by product, 2023 - 2028 (USD Million)
- TABLE 157 Spain market by product, 2029 - 2032 (USD Million)
- TABLE 158 Spain market by voltage, 2019 - 2022 (USD Million)
- TABLE 159 Spain market by voltage, 2023 - 2028 (USD Million)
- TABLE 160 Spain market by voltage, 2029 - 2032 (USD Million)
- TABLE 161 Spain market by application, 2019 - 2022 (USD Million)
- TABLE 162 Spain market by application, 2023 - 2028 (USD Million)
- TABLE 163 Spain market by application, 2029 - 2032 (USD Million)
- TABLE 164 Sweden market, 2019 - 2022 (Revenue)
- TABLE 165 Sweden market, 2023 - 2028 (Revenue)
- TABLE 166 Sweden market, 2029 - 2032 (Revenue)
- TABLE 167 Sweden market by product, 2019 - 2022 (USD Million)
- TABLE 168 Sweden market by product, 2023 - 2028 (USD Million)
- TABLE 169 Sweden market by product, 2029 - 2032 (USD Million)
- TABLE 170 Sweden market by voltage, 2019 - 2022 (USD Million)
- TABLE 171 Sweden market by voltage, 2023 - 2028 (USD Million)
- TABLE 172 Sweden market by voltage, 2029 - 2032 (USD Million)
- TABLE 173 Sweden market by application, 2019 - 2022 (USD Million)
- TABLE 174 Sweden market by application, 2023 - 2028 (USD Million)
- TABLE 175 Sweden market by application, 2029 - 2032 (USD Million)
- TABLE 176 Denmark market, 2019 - 2022 (Revenue)
- TABLE 177 Denmark market, 2023 - 2028 (Revenue)
- TABLE 178 Denmark market, 2029 - 2032 (Revenue)
- TABLE 179 Denmark market by product, 2019 - 2022 (USD Million)
- TABLE 180 Denmark market by product, 2023 - 2028 (USD Million)
- TABLE 181 Denmark market by product, 2029 - 2032 (USD Million)
- TABLE 182 Denmark market by voltage, 2019 - 2022 (USD Million)
- TABLE 183 Denmark market by voltage, 2023 - 2028 (USD Million)
- TABLE 184 Denmark market by voltage, 2029 - 2032 (USD Million)
- TABLE 185 Denmark market by application, 2019 - 2022 (USD Million)
- TABLE 186 Denmark market by application, 2023 - 2028 (USD Million)
- TABLE 187 Denmark market by application, 2029 - 2032 (USD Million)
- TABLE 188 Belgium market, 2019 - 2022 (Revenue)
- TABLE 189 Belgium market, 2023 - 2028 (Revenue)
- TABLE 190 Belgium market, 2029 - 2032 (Revenue)
- TABLE 191 Belgium market by product, 2019 - 2022 (USD Million)
- TABLE 192 Belgium market by product, 2023 - 2028 (USD Million)
- TABLE 193 Belgium market by product, 2029 - 2032 (USD Million)
- TABLE 194 Belgium market by voltage, 2019 - 2022 (USD Million)
- TABLE 195 Belgium market by voltage, 2023 - 2028 (USD Million)
- TABLE 196 Belgium market by voltage, 2029 - 2032 (USD Million)
- TABLE 197 Belgium market by application, 2019 - 2022 (USD Million)
- TABLE 198 Belgium market by application, 2023 - 2028 (USD Million)
- TABLE 199 Belgium market by application, 2029 - 2032 (USD Million)
- TABLE 200 Germany market, 2019 - 2022 (Revenue)
- TABLE 201 Germany market, 2023 - 2028 (Revenue)
- TABLE 202 Germany market, 2029 - 2032 (Revenue)
- TABLE 203 Germany market by product, 2019 - 2022 (USD Million)
- TABLE 204 Germany market by product, 2023 - 2028 (USD Million)
- TABLE 205 Germany market by product, 2029 - 2032 (USD Million)
- TABLE 206 Germany market by voltage, 2019 - 2022 (USD Million)
- TABLE 207 Germany market by voltage, 2023 - 2028 (USD Million)
- TABLE 208 Germany market by voltage, 2029 - 2032 (USD Million)
- TABLE 209 Germany market by application, 2019 - 2022 (USD Million)
- TABLE 210 Germany market by application, 2023 - 2028 (USD Million)
- TABLE 211 Germany market by application, 2029 - 2032 (USD Million)
- TABLE 212 Poland market, 2019 - 2022 (Revenue)
- TABLE 213 Poland market, 2023 - 2028 (Revenue)
- TABLE 214 Poland market, 2029 - 2032 (Revenue)
- TABLE 215 Poland market by product, 2019 - 2022 (USD Million)
- TABLE 216 Poland market by product, 2023 - 2028 (USD Million)
- TABLE 217 Poland market by product, 2029 - 2032 (USD Million)
- TABLE 218 Poland market by voltage, 2019 - 2022 (USD Million)
- TABLE 219 Poland market by voltage, 2023 - 2028 (USD Million)
- TABLE 220 Poland market by voltage, 2029 - 2032 (USD Million)
- TABLE 221 Poland market by application, 2019 - 2022 (USD Million)
- TABLE 222 Poland market by application, 2023 - 2028 (USD Million)
- TABLE 223 Poland market by application, 2029 - 2032 (USD Million)
- TABLE 224 Russia market, 2019 - 2022 (Revenue)
- TABLE 225 Russia market, 2023 - 2028 (Revenue)
- TABLE 226 Russia market, 2029 - 2032 (Revenue)
- TABLE 227 Russia market by product, 2019 - 2022 (USD Million)
- TABLE 228 Russia market by product, 2023 - 2028 (USD Million)
- TABLE 229 Russia market by product, 2029 - 2032 (USD Million)
- TABLE 230 Russia market by voltage, 2019 - 2022 (USD Million)
- TABLE 231 Russia market by voltage, 2023 - 2028 (USD Million)
- TABLE 232 Russia market by voltage, 2029 - 2032 (USD Million)
- TABLE 233 Russia market by application, 2019 - 2022 (USD Million)
- TABLE 234 Russia market by application, 2023 - 2028 (USD Million)
- TABLE 235 Russia market by application, 2029 - 2032 (USD Million)
- TABLE 236 Greece market, 2019 - 2022 (Revenue)
- TABLE 237 Greece market, 2023 - 2028 (Revenue)
- TABLE 238 Greece market, 2029 - 2032 (Revenue)
- TABLE 239 Greece market by product, 2019 - 2022 (USD Million)
- TABLE 240 Greece market by product, 2023 - 2028 (USD Million)
- TABLE 241 Greece market by product, 2029 - 2032 (USD Million)
- TABLE 242 Greece market by voltage, 2019 - 2022 (USD Million)
- TABLE 243 Greece market by voltage, 2023 - 2028 (USD Million)
- TABLE 244 Greece market by voltage, 2029 - 2032 (USD Million)
- TABLE 245 Greece market by application, 2019 - 2022 (USD Million)
- TABLE 246 Greece market by application, 2023 - 2028 (USD Million)
- TABLE 247 Greece market by application, 2029 - 2032 (USD Million)
- TABLE 248 Czech Republic market, 2019 - 2022 (Revenue)
- TABLE 249 Czech Republic market, 2023 - 2028 (Revenue)
- TABLE 250 Czech Republic market, 2029 - 2032 (Revenue)
- TABLE 251 Czech Republic market by product, 2019 - 2022 (USD Million)
- TABLE 252 Czech Republic market by product, 2023 - 2028 (USD Million)
- TABLE 253 Czech Republic market by product, 2029 - 2032 (USD Million)
- TABLE 254 Czech Republic market by voltage, 2019 - 2022 (USD Million)
- TABLE 255 Czech Republic market by voltage, 2023 - 2028 (USD Million)
- TABLE 256 Czech Republic market by voltage, 2029 - 2032 (USD Million)
- TABLE 257 Czech Republic market by application, 2019 - 2022 (USD Million)
- TABLE 258 Czech Republic market by application, 2023 - 2028 (USD Million)
- TABLE 259 Czech Republic market by application, 2029 - 2032 (USD Million)
- TABLE 260 Romania market, 2019 - 2022 (Revenue)
- TABLE 261 Romania market, 2023 - 2028 (Revenue)
- TABLE 262 Romania market, 2029 - 2032 (Revenue)
- TABLE 263 Romania market by product, 2019 - 2022 (USD Million)
- TABLE 264 Romania market by product, 2023 - 2028 (USD Million)
- TABLE 265 Romania market by product, 2029 - 2032 (USD Million)
- TABLE 266 Romania market by voltage, 2019 - 2022 (USD Million)
- TABLE 267 Romania market by voltage, 2023 - 2028 (USD Million)
- TABLE 268 Romania market by voltage, 2029 - 2032 (USD Million)
- TABLE 269 Romania market by application, 2019 - 2022 (USD Million)
- TABLE 270 Romania market by application, 2023 - 2028 (USD Million)
- TABLE 271 Romania market by application, 2029 - 2032 (USD Million)
- TABLE 272 Hungary market, 2019 - 2022 (Revenue)
- TABLE 273 Hungary market, 2023 - 2028 (Revenue)
- TABLE 274 Hungary market, 2029 - 2032 (Revenue)
- TABLE 275 Hungary market by product, 2019 - 2022 (USD Million)
- TABLE 276 Hungary market by product, 2023 - 2028 (USD Million)
- TABLE 277 Hungary market by product, 2029 - 2032 (USD Million)
- TABLE 278 Hungary market by voltage, 2019 - 2022 (USD Million)
- TABLE 279 Hungary market by voltage, 2023 - 2028 (USD Million)
- TABLE 280 Hungary market by voltage, 2029 - 2032 (USD Million)
- TABLE 281 Hungary market by application, 2019 - 2022 (USD Million)
- TABLE 282 Hungary market by application, 2023 - 2028 (USD Million)
- TABLE 283 Hungary market by application, 2029 - 2032 (USD Million)
- TABLE 284 Bosnia market, 2019 - 2022 (Revenue)
- TABLE 285 Bosnia market, 2023 - 2028 (Revenue)
- TABLE 286 Bosnia market, 2029 - 2032 (Revenue)
- TABLE 287 Bosnia market by product, 2019 - 2022 (USD Million)
- TABLE 288 Bosnia market by product, 2023 - 2028 (USD Million)
- TABLE 289 Bosnia market by product, 2029 - 2032 (USD Million)
- TABLE 290 Bosnia market by voltage, 2019 - 2022 (USD Million)
- TABLE 291 Bosnia market by voltage, 2023 - 2028 (USD Million)
- TABLE 292 Bosnia market by voltage, 2029 - 2032 (USD Million)
- TABLE 293 Bosnia market by application, 2019 - 2022 (USD Million)
- TABLE 294 Bosnia market by application, 2023 - 2028 (USD Million)
- TABLE 295 Bosnia market by application, 2029 - 2032 (USD Million)
- TABLE 296 Croatia market, 2019 - 2022 (Revenue)
- TABLE 297 Croatia market, 2023 - 2028 (Revenue)
- TABLE 298 Croatia market, 2029 - 2032 (Revenue)
- TABLE 299 Croatia market by product, 2019 - 2022 (USD Million)
- TABLE 300 Croatia market by product, 2023 - 2028 (USD Million)
- TABLE 301 Croatia market by product, 2029 - 2032 (USD Million)
- TABLE 302 Croatia market by voltage, 2019 - 2022 (USD Million)
- TABLE 303 Croatia market by voltage, 2023 - 2028 (USD Million)
- TABLE 304 Croatia market by voltage, 2029 - 2032 (USD Million)
- TABLE 305 Croatia market by application, 2019 - 2022 (USD Million)
- TABLE 306 Croatia market by application, 2023 - 2028 (USD Million)
- TABLE 307 Croatia market by application, 2029 - 2032 (USD Million)
- TABLE 308 Macedonia market, 2019 - 2022 (Revenue)
- TABLE 309 Macedonia market, 2023 - 2028 (Revenue)
- TABLE 310 Macedonia market, 2029 - 2032 (Revenue)
- TABLE 311 Macedonia market by product, 2019 - 2022 (USD Million)
- TABLE 312 Macedonia market by product, 2023 - 2028 (USD Million)
- TABLE 313 Macedonia market by product, 2029 - 2032 (USD Million)
- TABLE 314 Macedonia market by voltage, 2019 - 2022 (USD Million)
- TABLE 315 Macedonia market by voltage, 2023 - 2028 (USD Million)
- TABLE 316 Macedonia market by voltage, 2029 - 2032 (USD Million)
- TABLE 317 Macedonia market by application, 2019 - 2022 (USD Million)
- TABLE 318 Macedonia market by application, 2023 - 2028 (USD Million)
- TABLE 319 Macedonia market by application, 2029 - 2032 (USD Million)
- TABLE 320 Montenegro market, 2019 - 2022 (Revenue)
- TABLE 321 Montenegro market, 2023 - 2028 (Revenue)
- TABLE 322 Montenegro market, 2029 - 2032 (Revenue)
- TABLE 323 Montenegro market by product, 2019 - 2022 (USD Million)
- TABLE 324 Montenegro market by product, 2023 - 2028 (USD Million)
- TABLE 325 Montenegro market by product, 2029 - 2032 (USD Million)
- TABLE 326 Montenegro market by voltage, 2019 - 2022 (USD Million)
- TABLE 327 Montenegro market by voltage, 2023 - 2028 (USD Million)
- TABLE 328 Montenegro market by voltage, 2029 - 2032 (USD Million)
- TABLE 329 Montenegro market by application, 2019 - 2022 (USD Million)
- TABLE 330 Montenegro market by application, 2023 - 2028 (USD Million)
- TABLE 331 Montenegro market by application, 2029 - 2032 (USD Million)
- TABLE 332 Serbia market, 2019 - 2022 (Revenue)
- TABLE 333 Serbia market, 2023 - 2028 (Revenue)
- TABLE 334 Serbia market, 2029 - 2032 (Revenue)
- TABLE 335 Serbia market by product, 2019 - 2022 (USD Million)
- TABLE 336 Serbia market by product, 2023 - 2028 (USD Million)
- TABLE 337 Serbia market by product, 2029 - 2032 (USD Million)
- TABLE 338 Serbia market by voltage, 2019 - 2022 (USD Million)
- TABLE 339 Serbia market by voltage, 2023 - 2028 (USD Million)
- TABLE 340 Serbia market by voltage, 2029 - 2032 (USD Million)
- TABLE 341 Serbia market by application, 2019 - 2022 (USD Million)
- TABLE 342 Serbia market by application, 2023 - 2028 (USD Million)
- TABLE 343 Serbia market by application, 2029 - 2032 (USD Million)
- TABLE 344 Slovenia market, 2019 - 2022 (Revenue)
- TABLE 345 Slovenia market, 2023 - 2028 (Revenue)
- TABLE 346 Slovenia market, 2029 - 2032 (Revenue)
- TABLE 347 Slovenia market by product, 2019 - 2022 (USD Million)
- TABLE 348 Slovenia market by product, 2023 - 2028 (USD Million)
- TABLE 349 Slovenia market by product, 2029 - 2032 (USD Million)
- TABLE 350 Slovenia market by voltage, 2019 - 2022 (USD Million)
- TABLE 351 Slovenia market by voltage, 2023 - 2028 (USD Million)
- TABLE 352 Slovenia market by voltage, 2029 - 2032 (USD Million)
- TABLE 353 Slovenia market by application, 2019 - 2022 (USD Million)
- TABLE 354 Slovenia market by application, 2023 - 2028 (USD Million)
- TABLE 355 Slovenia market by application, 2029 - 2032 (USD Million)
Charts & Figures
- FIG. 1 GMI report coverage: critical research elements
- FIG. 2 Industry segmentation
- FIG. 3 Market forecasting methodology
- FIG. 4 Industry ecosystem analysis
- FIG. 5 COVID- 19 impact on the industry, 2019 - 2032 (USD Million)
- FIG. 6 Growth potential analysis
- FIG. 7 Porter's Analysis
- FIG. 8 PESTEL Analysis
- FIG. 9 SWOT Analysis, Prysmian Group
- FIG. 10 SWOT Analysis, Nexans
- FIG. 11 SWOT Analysis, Sumitomo Electric Industries Limited
- FIG. 12 SWOT Analysis, NKT A/S
- FIG. 13 SWOT Analysis, Belden Inc.
- FIG. 14 SWOT Analysis, LS Cable & System Ltd.
- FIG. 15 SWOT Analysis, Furukawa Electric Co., Ltd.
- FIG. 16 SWOT Analysis, CommScope
- FIG. 17 SWOT Analysis, LAPP Group
- FIG. 18 SWOT Analysis, Elsewedy Electric
- FIG. 19 SWOT Analysis, igus
- FIG. 20 SWOT Analysis, HELUKABEL GmbH
- FIG. 21 SWOT Analysis, Friedrich Lütze GmbH
- FIG. 22 SWOT Analysis, Viakon
- FIG. 23 SWOT Analysis, Shawcor
- FIG. 24 SWOT Analysis, SAB Bröckskes GmbH & Co. KG
- FIG. 25 SWOT Analysis, Waskönig & Walter (DE)
- FIG. 26 SWOT Analysis, Klaus Faber AG
- FIG. 27 SWOT Analysis, Dätwyler IT Infra GmbH
- FIG. 28 SWOT Analysis, Studer Cables AG
- FIG. 29 SWOT Analysis, Hellenic Group
- FIG. 30 SWOT Analysis, TFKable
- FIG. 31 SWOT Analysis, TKH Group
- FIG. 32 SWOT Analysis, Tecnikabel SpA
- FIG. 33 SWOT Analysis, Kabelwerk Eupen AG
Europe Wire & Cable Market share would grow notably through 2030 driven by the growing smart grid adoption and burgeoning renewable energy integration programs with effective grid technologies. According to the Department of Energy and Climate Change, a record 8 million smart meters were installed and connected to the Data Communications Company in the UK in 2021.
Additionally, revamping existing and old electricity infrastructure with new and advanced solutions for effective energy management would complement the market growth between 2022-2030.
The overall Europe wire and cable market is divided based on product, voltage, application, and regions.
Based on the product bifurcation, the market growth is likely to be characterized by fiber optic cables segment. Mounting technological advancements for long-distance and high-performance data networking, especially for telecommunication services, would contribute to the segmental expansion. Moreover, booming penetration of consumer electronics and increasing dependency on hi-speed internet would add impetus to the market landscape.
On the other hand, the telecom and data center segment accounted for a market share of over USD 1 billion in 2021 and is projected to grow appreciably through 2030. The growth can be credited to the elevating demand for replacement and refurbishment of aging telecommunication infrastructure and hefty investment in research and development projects to boost the telecom network.
In terms of voltage, high voltage wires and cables are amassing notable gains across the market. Proliferating energy demand across the region and aging electric transmission networks are likely to be responsible for the thriving industry growth across Europe. Besides, rapid adoption of smart grid infrastructure and IT integration across electricity network would further strengthen the product deployment in the region.
The automotive sector is anticipated to be one of the highest revenue generating application verticals across Europe wire and cable industry. Factors fueling the market growth are growing concern toward adoption of sustainable and clean vehicles and soaring sales and requirement for commercial vehicles in the region. As per OICA statistics, Germany recorded the production of more than 210,000 commercial vehicles in 2021.
Meanwhile, consumer inclination towards leisure and amusement activities along with rising placement of promotional live events would stimulate the product adoption during 2022-2030, thereby impelling the entertainment/leisure segment across the overall industry.
Regionally, the Europe wire and cable industry is diversified into Russia, Germany, France, and the United Kingdom. Amongst these, the UK is slated to amass considerable profits by 2030 end driven by the introduction of favorable government schemes and incentives for EV adoption in the country to reduce carbon footprint. Ongoing transmission and distribution projects in the country to support clean and sustainable energy demand would further promote the market demand.
Companies operating in Europe wire and cable market include LAPP Group, Furukawa Electric Co., Ltd., Prysmian Group, Nexans, Commscope, HELUKABEL, Viakon, Friedrich Lutze GmbH, LS Cable and System Ltd., and others.
Table of Contents
Chapter 1 Methodology & Scope
- 1.1 Market scope & definitions
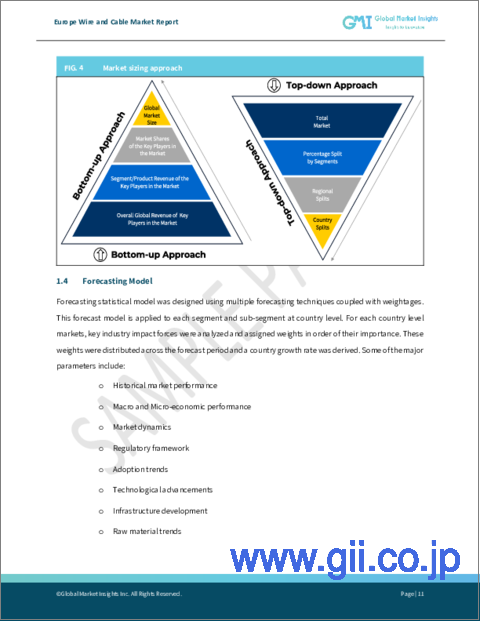
- 1.2 Market estimates and forecast parameters.
- 1.3 Forecast calculations
- 1.4 Data sources
- 1.4.1 Primary
- 1.4.2 Secondary
- 1.4.2.1 Paid sources
- 1.4.2.2 Public sources
Chapter 2 Europe Wire and Cable Industry Insights
- 2.1 Industry ecosystem analysis
- 2.1.1 Vendor Matrix
- 2.2 Regulatory landscape
- 2.2.1 The Exclusive Economic Zone and Continental Shelf Laws of 2004 and 2014
- 2.2.1.1 Standards
- 2.2.1.2 Electrical specification
- 2.2.1.3 Mechanical specification
- 2.2.2 Europe
- 2.2.2.1 Regulation (EU) 2017/1485 — Guideline on electricity transmission system operation
- 2.2.2.1.1 Key points
- 2.2.2.1.2 General aspects
- 2.2.2.1.3 Technical sections
- 2.2.2.2 Safety Standards for Electrical Installations and Equipment in Explosives Facilities (UK)
- 2.2.2.2.1 UK Fire Safety Regulations for Cables
- 2.2.2.2.2 Protection from Power Supply Authority Overhead Power Lines
- 2.2.2.2.3 Position, insulation, and protection of overhead lines
- 2.2.2.2.4 Electrical Distribution within Explosive Areas
- 2.2.2.2.5 Crossing of Roads and Railways
- 2.2.2.3 European Construction Products Regulation (CPR)
- 2.2.2.1 Regulation (EU) 2017/1485 — Guideline on electricity transmission system operation
- 2.2.3 Poland
- 2.2.4 Russia
- 2.2.1 The Exclusive Economic Zone and Continental Shelf Laws of 2004 and 2014
- 2.3 Industry impact forces
- 2.3.1 Growth drivers
- 2.3.1.1 Flourishing telecom and internet industry
- 2.3.1.2 Adoption of smart grid network
- 2.3.1.3 Growing infrastructure investments
- 2.3.2 Industry pitfalls & challenges
- 2.3.2.1 High import dependency
- 2.3.1 Growth drivers
- 2.4 COVID- 19 impact on the industry outlook
- 2.4.1 Overall scenario
- 2.5 Growth potential analysis
- 2.6 Porter's Analysis
- 2.6.1 Bargaining power of buyers
- 2.6.2 Bargaining power of suppliers
- 2.6.3 Threat of new entrants
- 2.6.4 Threat of substitutes
- 2.7 PESTEL Analysis
Chapter 3 Competitive Benchmarking
- 3.1 Innovation & sustainability landscape
- 3.1.1 Prysmian Group
- 3.1.2 Nexans
- 3.1.3 Sumitomo Electric Industries Limited
- 3.1.4 NKT A/S
- 3.1.5 Lapp Group
- 3.1.6 igus
- 3.1.7 HELUKABEL
- 3.1.8 Friedrich Lütze GmbH
- 3.1.9 TFKable
- 3.1.10 Kabelwerk Eupen AG
- 3.2 Competitive landscape, 2022
- 3.2.1 Strategy dashboard
- 3.2.1.1 Prysmian Group
- 3.2.1.1.1 Contract
- 3.2.1.1.2 Product Launch
- 3.2.1.2 Nexans
- 3.2.1.2.1 Contract
- 3.2.1.3 Furukawa Electric Co., Ltd.
- 3.2.1.3.1 Product Launch
- 3.2.1.4 Elsewedy Electric
- 3.2.1.4.1 Acquisition
- 3.2.1.4.2 Project
- 3.2.1.5 igus
- 3.2.1.5.1 Product Launch
- 3.2.1.6 HELUKABEL
- 3.2.1.6.1 Expansion
- 3.2.1.6.2 Product Launch
- 3.2.1.7 Viakon
- 3.2.1.7.1 Product Launch
- 3.2.1.8 Shawcor
- 3.2.1.8.1 Product Launch
- 3.2.1.9 Hellenic Group
- 3.2.1.9.1 Agreement
- 3.2.1.10 Kabelwerk Eupen AG
- 3.2.1.10.1 Expansion
- 3.2.1.1 Prysmian Group
- 3.2.1 Strategy dashboard
Chapter 4 Europe Wire and Cable Market, By Product
- 4.1 Key product trends
- 4.2 Coaxial cables/electronic wires
- 4.2.1 Europe market from coaxial cables/electronic wires, 2019 - 2032
- 4.2.2 Europe market from coaxial cables/electronic wires, by country, 2019 - 2032
- 4.3 Fiber optics cable
- 4.3.1 Europe market from fiber optics cable, 2019 - 2032
- 4.3.2 Europe market from fiber optics cable, by country, 2019 - 2032
- 4.4 Power cables
- 4.4.1 Europe market from power cables, 2019 - 2032
- 4.4.2 Europe market from power cables, by country, 2019 - 2032
- 4.5 Signal & control
- 4.5.1 Europe market from signal & control, 2019 - 2032
- 4.5.2 Europe market from signal & control, by country, 2019 - 2032
- 4.6 Telecom & data
- 4.6.1 Europe market from telecom & data, 2019 - 2032
- 4.6.2 Europe market from telecom & data, by country, 2019 - 2032
Chapter 5 Europe Wire and Cable Market, By Voltage
- 5.1 Key voltage trends
- 5.2 Low
- 5.2.1 Europe market from low, 2019 - 2032
- 5.2.2 Europe market from low, by country, 2019 - 2032
- 5.3 Medium
- 5.3.1 Europe market from medium, 2019 - 2032
- 5.3.2 Europe market from medium, by country, 2019 - 2032
- 5.4 High
- 5.4.1 Europe market from high, 2019 - 2032
- 5.4.2 Europe market from high, by country, 2019 - 2032
Chapter 6 Europe Wire and Cable Market, By Application
- 6.1 Key application trends
- 6.2 Food & beverages
- 6.2.1 Europe market from food & beverages, 2019 - 2032
- 6.2.2 Europe market from food & beverages, by country, 2019 - 2032
- 6.3 Automotive
- 6.3.1 Europe market from automotive, 2019 - 2032
- 6.3.2 Europe market from automotive, by country, 2019 - 2032
- 6.4 Material handling/logistics
- 6.4.1 Europe market from material handling/logistics, 2019 - 2032
- 6.4.2 Europe market from material handling/logistics, by country, 2019 - 2032
- 6.5 Entertainment/leisure
- 6.5.1 Europe market from entertainment/leisure, 2019 - 2032
- 6.5.2 Europe market from entertainment/leisure, by country, 2019 - 2032
- 6.6 Utilities
- 6.6.1 Europe market from utilities, 2019 - 2032
- 6.6.2 Europe market from utilities, by country, 2019 - 2032
- 6.7 Railways
- 6.7.1 Europe market from railways, 2019 - 2032
- 6.7.2 Europe market from railways, by country, 2019 - 2032
- 6.8 Consumer electronics
- 6.8.1 Europe market from consumer electronics, 2019 - 2032
- 6.8.2 Europe market from consumer electronics, by country, 2019 - 2032
- 6.9 Building infrastructure
- 6.9.1 Europe market from building infrastructure, 2019 - 2032
- 6.9.2 Europe market from building infrastructure, by country, 2019 - 2032
- 6.10 Others
- 6.10.1 Europe market from others, 2019 - 2032
- 6.10.2 Europe market from others, by country, 2019 - 2032
Chapter 7 Europe Wire and Cable Market, By Country
- 7.1 Key country trends
- 7.2 UK
- 7.2.1 UK market, 2019 - 2032
- 7.2.2 UK market by product, 2019 - 2032
- 7.2.3 UK market by voltage, 2019 - 2032
- 7.2.4 UK market by application, 2019 - 2032
- 7.3 France
- 7.3.1 France market, 2019 - 2032
- 7.3.2 France market by product, 2019 - 2032
- 7.3.3 France market by voltage, 2019 - 2032
- 7.3.4 France market by application, 2019 - 2032
- 7.4 Netherlands
- 7.4.1 Netherlands market, 2019 - 2032
- 7.4.2 Netherlands market by product, 2019 - 2032
- 7.4.3 Netherlands market by voltage, 2019 - 2032
- 7.4.4 Netherlands market by application, 2019 - 2032
- 7.5 Italy
- 7.5.1 Italy market, 2019 - 2032
- 7.5.2 Italy market by product, 2019 - 2032
- 7.5.3 Italy market by voltage, 2019 - 2032
- 7.5.4 Italy market by application, 2019 - 2032
- 7.6 Spain
- 7.6.1 Spain market, 2019 - 2032
- 7.6.2 Spain market by product, 2019 - 2032
- 7.6.3 Spain market by voltage, 2019 - 2032
- 7.6.4 Spain market by application, 2019 - 2032
- 7.7 Sweden
- 7.7.1 Sweden market, 2019 - 2032
- 7.7.2 Sweden market by product, 2019 - 2032
- 7.7.3 Sweden market by voltage, 2019 - 2032
- 7.7.4 Sweden market by application, 2019 - 2032
- 7.8 Denmark
- 7.8.1 Denmark market, 2019 - 2032
- 7.8.2 Denmark market by product, 2019 - 2032
- 7.8.3 Denmark market by voltage, 2019 - 2032
- 7.8.4 Denmark market by application, 2019 - 2032
- 7.9 Belgium
- 7.9.1 Belgium market, 2019 - 2032
- 7.9.2 Belgium market by product, 2019 - 2032
- 7.9.3 Belgium market by voltage, 2019 - 2032
- 7.9.4 Belgium market by application, 2019 - 2032
- 7.10 Germany
- 7.10.1 Germany market, 2019 - 2032
- 7.10.2 Germany market by product, 2019 - 2032
- 7.10.3 Germany market by voltage, 2019 - 2032
- 7.10.4 Germany market by application, 2019 - 2032
- 7.11 Poland
- 7.11.1 Poland market, 2019 - 2032
- 7.11.2 Poland market by product, 2019 - 2032
- 7.11.3 Poland market by voltage, 2019 - 2032
- 7.11.4 Poland market by application, 2019 - 2032
- 7.12 Russia
- 7.12.1 Russia market, 2019 - 2032
- 7.12.2 Russia market by product, 2019 - 2032
- 7.12.3 Russia market by voltage, 2019 - 2032
- 7.12.4 Russia market by application, 2019 - 2032
- 7.13 Greece
- 7.13.1 Greece market, 2019 - 2032
- 7.13.2 Greece market by product, 2019 - 2032
- 7.13.3 Greece market by voltage, 2019 - 2032
- 7.13.4 Greece market by application, 2019 - 2032
- 7.14 Czech Republic
- 7.14.1 Czech Republic market, 2019 - 2032
- 7.14.2 Czech Republic market by product, 2019 - 2032
- 7.14.3 Czech Republic market by voltage, 2019 - 2032
- 7.14.4 Czech Republic market by application, 2019 - 2032
- 7.15 Romania
- 7.15.1 Romania market, 2019 - 2032
- 7.15.2 Romania market by product, 2019 - 2032
- 7.15.3 Romania market by voltage, 2019 - 2032
- 7.15.4 Romania market by application, 2019 - 2032
- 7.16 Hungary
- 7.16.1 Hungary market, 2019 - 2032
- 7.16.2 Hungary market by product, 2019 - 2032
- 7.16.3 Hungary market by voltage, 2019 - 2032
- 7.16.4 Hungary market by application, 2019 - 2032
- 7.17 Bosnia
- 7.17.1 Bosnia market, 2019 - 2032
- 7.17.2 Bosnia market by product, 2019 - 2032
- 7.17.3 Bosnia market by voltage, 2019 - 2032
- 7.17.4 Bosnia market by application, 2019 - 2032
- 7.18 Croatia
- 7.18.1 Croatia market, 2019 - 2032
- 7.18.2 Croatia market by product, 2019 - 2032
- 7.18.3 Croatia market by voltage, 2019 - 2032
- 7.18.4 Croatia market by application, 2019 - 2032
- 7.19 Macedonia
- 7.19.1 Macedonia market, 2019 - 2032
- 7.19.2 Macedonia market by product, 2019 - 2032
- 7.19.3 Macedonia market by voltage, 2019 - 2032
- 7.19.4 Macedonia market by application, 2019 - 2032
- 7.20 Montenegro
- 7.20.1 Montenegro market, 2019 - 2032
- 7.20.2 Montenegro market by product, 2019 - 2032
- 7.20.3 Montenegro market by voltage, 2019 - 2032
- 7.20.4 Montenegro market by application, 2019 - 2032
- 7.21 Serbia
- 7.21.1 Serbia market, 2019 - 2032
- 7.21.2 Serbia market by product, 2019 - 2032
- 7.21.3 Serbia market by voltage, 2019 - 2032
- 7.21.4 Serbia market by application, 2019 - 2032
- 7.22 Slovenia
- 7.22.1 Slovenia market, 2019 - 2032
- 7.22.2 Slovenia market by product, 2019 - 2032
- 7.22.3 Slovenia market by voltage, 2019 - 2032
- 7.22.4 Slovenia market by application, 2019 - 2032
Chapter 8 Company Profiles
- 8.1 Prysmian Group
- 8.1.1 Business Overview
- 8.1.2 Financial Data
- 8.1.3 Product Landscape
- 8.1.4 Strategic Outlook
- 8.1.5 SWOT Analysis
- 8.2 Nexans
- 8.2.1 Business Overview
- 8.2.1 Financial Data
- 8.2.2 Product Landscape
- 8.2.3 Strategic Outlook
- 8.2.4 SWOT Analysis
- 8.3 Sumitomo Electric Industries Limited
- 8.3.1 Business Overview
- 8.3.2 Financial Data
- 8.3.3 Product Landscape
- 8.3.4 Strategic Outlook
- 8.3.5 SWOT Analysis
- 8.4 NKT A/S
- 8.4.1 Business Overview
- 8.4.2 Financial Data
- 8.4.3 Product Landscape
- 8.4.4 Strategic Outlook
- 8.4.5 SWOT Analysis
- 8.5 Belden Inc.
- 8.5.1 Business Overview
- 8.5.2 Financial Data
- 8.5.3 Product Landscape
- 8.5.4 Strategic Outlook
- 8.5.5 SWOT Analysis
- 8.6 LS Cable & System Ltd.
- 8.6.1 Business Overview
- 8.6.2 Financial data
- 8.6.3 Product Landscape
- 8.6.4 SWOT Analysis
- 8.7 Furukawa Electric Co., Ltd.
- 8.7.1 Business Overview
- 8.7.2 Financial Data
- 8.7.3 Product Landscape
- 8.7.4 Strategic Outlook
- 8.7.5 SWOT Analysis
- 8.8 CommScope
- 8.8.1 Business Overview
- 8.8.2 Financial Data
- 8.8.3 Product Landscape
- 8.8.4 Strategic Outlook
- 8.8.5 SWOT Analysis
- 8.9 Lapp Group
- 8.9.1 Business Overview
- 8.9.2 Financial Data
- 8.9.3 Product Landscape
- 8.9.4 Strategic Outlook
- 8.9.5 SWOT Analysis
- 8.10 Elsewedy Electric
- 8.10.1 Business Overview
- 8.10.2 Financial Data
- 8.10.3 Product Landscape
- 8.10.4 Strategic Outlook
- 8.10.5 SWOT Analysis
- 8.11 igus
- 8.11.1 Business Overview
- 8.11.2 Financial Data
- 8.11.3 Product Landscape
- 8.11.4 Strategic Outlook
- 8.11.5 SWOT Analysis
- 8.12 HELUKABEL GmbH
- 8.12.1 Business Overview
- 8.12.2 Financial Data
- 8.12.3 Product Landscape
- 8.12.4 Strategic Outlook
- 8.12.5 SWOT Analysis
- 8.13 Friedrich Lütze GmbH
- 8.13.1 Business Overview
- 8.13.2 Financial Data
- 8.13.3 Product Landscape
- 8.13.4 Strategic Outlook
- 8.13.5 SWOT Analysis
- 8.14 Viakon
- 8.14.1 Business Overview
- 8.14.2 Financial Data
- 8.14.3 Product Landscape
- 8.14.4 Strategic Outlook
- 8.14.5 SWOT Analysis
- 8.15 Shawcor
- 8.15.1 Business Overview
- 8.15.2 Financial Data
- 8.15.3 Product Landscape
- 8.15.4 Strategic Outlook
- 8.15.5 SWOT Analysis
- 8.16 SAB Bröckskes GmbH & Co. KG
- 8.16.1 Business Overview
- 8.16.2 Financial Data
- 8.16.3 Product Landscape
- 8.16.4 SWOT Analysis
- 8.17 Waskönig & Walter (DE)
- 8.17.1 Business Overview
- 8.17.2 Financial Data
- 8.17.3 Product Landscape
- 8.17.4 SWOT Analysis
- 8.18 Klaus Faber AG
- 8.18.1 Business Overview
- 8.18.2 Financial Data
- 8.18.3 Product Landscape
- 8.18.4 SWOT Analysis
- 8.19 Dätwyler IT Infra GmbH
- 8.19.1 Business Overview
- 8.19.2 Financial Data
- 8.19.3 Product Landscape
- 8.19.4 SWOT Analysis
- 8.20 Studer Cables AG
- 8.20.1 Business Overview
- 8.20.2 Financial Data
- 8.20.3 Product Landscape
- 8.20.4 SWOT Analysis
- 8.21 Hellenic Group
- 8.21.1 Business Overview
- 8.21.2 Financial Data
- 8.21.3 Product Landscape
- 8.21.4 Strategic Outlook
- 8.21.5 SWOT Analysis
- 8.22 TFKable
- 8.22.1 Business Overview
- 8.22.2 Financial Data
- 8.22.3 Product Landscape
- 8.22.4 Strategic Outlook
- 8.22.5 SWOT Analysis
- 8.23 TKH GROUP
- 8.23.1 Business Overview
- 8.23.2 Financial Data
- 8.23.3 Product Landscape
- 8.23.4 SWOT Analysis
- 8.24 Tecnikabel SpA
- 8.24.1 Business Overview
- 8.24.2 Financial Data
- 8.24.3 Product Landscape
- 8.24.4 SWOT Analysis
- 8.25 Kabelwerk Eupen AG
- 8.25.1 Business Overview
- 8.25.2 Financial Data
- 8.25.3 Product Landscape
- 8.25.4 Strategic Outlook
- 8.25.5 SWOT Analysis