
産業用イーサネット市場の機会、成長要因、業界動向分析、および2026年から2035年までの予測
Industrial Ethernet Market Opportunity, Growth Drivers, Industry Trend Analysis, and Forecast 2026 - 2035- 発行日
- ページ情報
- 英文 170 Pages
- 納期
- 2~3営業日
- 商品コード
- 1959599
- カスタマイズ可能 お客様のご希望に応じて、既存データの加工や未掲載情報(例:国別セグメント)の追加などの対応が可能です。詳細はお問い合わせください。
- 翻訳ツール提供対象 PDF対応AI翻訳ツールの無料貸し出しサービスのご利用が可能です
世界の産業用イーサネット市場は、2025年に98億米ドルと評価され、2035年までにCAGR 7.9%で成長し、208億米ドルに達すると予測されています。
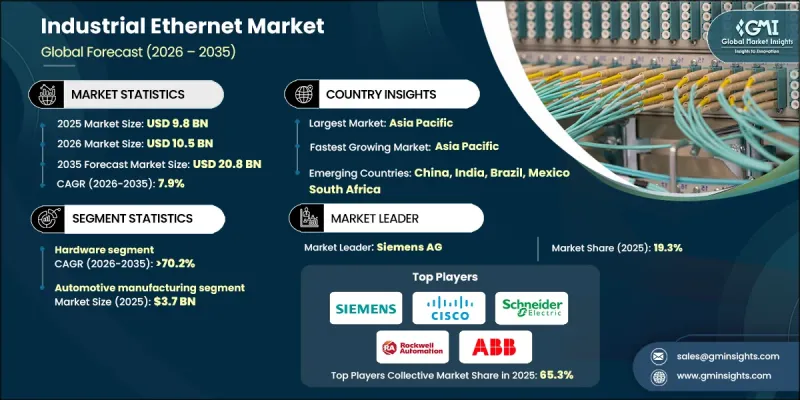
産業用イーサネットは、標準イーサネット技術を基盤としつつ、産業環境の厳しい要求に適応させることで、機械、制御装置、センサー間の高速で安全かつ信頼性の高い通信を実現します。製造業者が生産効率の最適化や設備性能の監視のためにシームレスなリアルタイムデータ交換を求める中、スマート製造と産業オートメーションの拡大が需要を牽引しています。産業用モノのインターネット(IIoT)の普及も導入をさらに促進しています。センサー、デバイス、機械は、予知保全、自動化プロセス、プロセス監視を支えるために、低遅延・高スループットのネットワークを必要とするためです。産業用イーサネットは、複数のデバイス間で途切れない通信を可能にし、運用継続性の確保、ダウンタイムの削減、データ完全性の向上を実現します。これは、自動車、航空宇宙、製薬、エネルギー、プロセス製造業など、現代の産業オペレーションにおいて極めて重要です。デジタルトランスフォーメーションの取り組みの増加、スマート工場への投資、スケーラブルで安全なネットワークインフラの必要性、これらすべてが持続的な市場成長に寄与しています。
| 市場範囲 | |
|---|---|
| 開始年 | 2025年 |
| 予測年度 | 2026-2035 |
| 開始時価値 | 98億米ドル |
| 予測金額 | 208億米ドル |
| CAGR | 7.9% |
ハードウェアセグメントは2025年に70.2%のシェアを占めました。このセグメントは、産業用スイッチ、ルーター、ネットワークインターフェースカード(NIC)などの産業用イーサネットデバイスに対する需要の高まりから恩恵を受けています。これらのデバイスは、複雑な産業ネットワーク全体で安全かつ高速な通信を確保し、製造、エネルギー、輸送、プロセスオートメーションアプリケーションにおけるリアルタイムデータ転送を可能にします。メーカー各社は、高信頼性、シームレスな統合性、堅牢なセキュリティ機能を兼ね備えたハードウェアの提供に注力し、重要業務を支えています。スループットの向上、遅延の低減、耐久性の強化を実現した次世代スイッチ、ルーター、NICの開発により、企業は市場シェアを拡大しつつ、効率的で信頼性の高いネットワークインフラを求める産業クライアントの増大する運用ニーズに対応することが可能となります。
製薬・バイオテクノロジー分野は、2035年までにCAGR10.3%で成長し、19億米ドル規模に達すると予測されています。同分野では、自動化、スマート製造、厳格な規制順守を支援するため、産業用イーサネットの導入が急速に進んでいます。産業用イーサネットは、生産ライフサイクル全体における精密なプロセス制御、データ完全性、監視のための安全かつリアルタイムな通信を実現します。実験室システムと生産業務を接続することで、企業は業務効率の向上、規制順守の維持、効率的な品質管理の促進が可能となります。生産全段階での重要データの即時伝送能力と、実験室システムと製造システムのシームレスな統合の確保が導入を推進しており、製造業者は高度に管理された産業環境において、業務の信頼性、製品の一貫性、規制順守を優先しています。
米国産業用イーサネット市場は、産業用ネットワークインフラへの投資増加、先進的イーサネットソリューションの急速な普及、スマート製造およびデジタルトランスフォーメーションへの需要拡大を背景に、2025年には24億米ドル規模に達すると予測されております。継続的な技術革新と市場統合により、競争力が強化され、産業用イーサネットソリューションの導入が加速しています。製造業者とエンドユーザーは、現代の産業運営に不可欠な大容量・低遅延通信と予測分析をサポートするため、ネットワークインフラのアップグレードに注力しています。北米の成熟した製造基盤と、IIoT(産業用モノのインターネット)および自動化技術の業界における強力な採用が相まって、同地域は産業用イーサネット拡大の主要な推進力となっています。
よくあるご質問
目次
第1章 調査手法と範囲
第2章 エグゼクティブサマリー
第3章 業界考察
- エコシステム分析
- サプライヤーの情勢
- 利益率
- コスト構造
- 各段階における付加価値
- バリューチェーンに影響を与える要因
- ディスラプション
- 業界への影響要因
- 促進要因
- 産業オートメーションとスマート製造の導入拡大
- 産業用モノのインターネット導入の成長
- リアルタイムかつ確定的な通信に対する需要の増加
- 世界のインダストリー4.0イニシアチブの拡大
- 高速かつ信頼性の高い産業用ネットワークへの需要の高まり
- 業界の潜在的リスク&課題
- 初期投資および設置コストの高さ
- ネットワーク設計と統合の複雑性
- 市場機会
- タイムセンシティブネットワーキング技術の採用拡大
- スマートファクトリーとデジタルツインの拡大
- 促進要因
- 成長可能性分析
- 規制情勢
- 北米
- 欧州
- アジア太平洋地域
- ラテンアメリカ
- 中東・アフリカ
- ポーターの分析
- PESTEL分析
- 技術とイノベーションの動向
- 現在の技術動向
- 新興技術
- 価格動向
- 過去の価格分析(2022-2024)
- 価格動向の要因
- 地域別価格差異
- 価格予測(2026-2035)
- 価格戦略
- 新興ビジネスモデル
- コンプライアンス要件
- 特許分析
第4章 競合情勢
- イントロダクション
- 企業の市場シェア分析
- 地域別
- 北米
- 欧州
- アジア太平洋地域
- ラテンアメリカ
- 中東・アフリカ
- 市場集中度分析
- 地域別
- 主要企業の競合ベンチマーキング
- 財務実績比較
- 収益
- 利益率
- 研究開発
- 製品ポートフォリオ比較
- 製品ラインの広さ
- 技術
- イノベーション
- 地理的プレゼンス比較
- 世界展開分析
- サービスネットワークのカバー率
- 地域別市場浸透率
- 競合ポジショニングマトリックス
- リーダー企業
- 課題者
- フォロワー
- ニッチプレイヤー
- 戦略的展望マトリックス
- 財務実績比較
- 主な発展, 2022-2025
- 合併・買収
- 提携および協力関係
- 技術的進歩
- 拡大と投資戦略
- サステナビリティへの取り組み
- デジタルトランスフォーメーションの取り組み
- 新興/スタートアップ競合の動向
第5章 産業用イーサネット市場推計・予測提供形態別、2022-2035
- ,
- ハードウェア
- ネットワークインフラストラクチャ
- コントローラーおよびエッジデバイス
- プログラマブル・ロジック・コントローラ(PLC)
- プログラマブル・オートメーション・コントローラ(PAC)
- 産業用IoTゲートウェイ
- 接続コンポーネント
- ケーブル
- コネクタ
- その他
- ソフトウェア
- 制御・監視ソフトウェア
- SCADAシステム
- ヒューマンマシンインターフェース(HMI)
- 分散制御システム(DCS)
- PLCプログラミングソフトウェア
- 統合およびミドルウェア
- OPC UAサーバー/クライアント
- プロトコルゲートウェイソフトウェア
- 設定ツール
- ネットワーク管理ソフトウェア
- 産業用ネットワーク管理システム
- SNMPマネージャー
- 診断およびトラブルシューティングツール
- 制御・監視ソフトウェア
- サービス
第6章 市場推計・予測:最終用途産業別、2022-2035
- 自動車製造
- 半導体・電子機器
- 製薬・バイオテクノロジー
- 食品・飲料
- 石油・ガス
- パルプ・製紙
- 鉱業・金属
- その他
第7章 産業用イーサネット市場推計・予測:地域別、2022-2035
- :地域別
- 北米
- 米国
- カナダ
- 欧州
- 英国
- ドイツ
- フランス
- イタリア
- スペイン
- オランダ
- その他欧州地域
- アジア太平洋地域
- 中国
- インド
- 日本
- 韓国
- オーストラリア
- その他アジア太平洋地域
- ラテンアメリカ
- ブラジル
- メキシコ
- アルゼンチン
- その他ラテンアメリカ地域
- 中東・アフリカ地域
- サウジアラビア
- 南アフリカ
- アラブ首長国連邦
- その他中東・アフリカ地域
第8章 企業プロファイル
- ABB Ltd.
- Advantech Co., Ltd.
- Antaira Technologies
- B&R Industrial Automation
- Belden Inc.
- Bosch Rexroth AG
- Cisco Systems, Inc.
- Hirschmann Automation and Control
- HMS Networks AB
- Kyland Technology Co., Ltd.
- Moxa Technologies
- OMRON Corporation
- Perle Systems, Inc.
- Phoenix Contact GmbH &Co. KG
- Red Lion Controls, Inc.
- Rockwell Automation, Inc.
- Schneider Electric SE
- Siemens AG
- Weidmuller Interface GmbH &Co. KG
- Westermo Network Technologies
- 発行日
- 発行
- Global Market Insights Inc.
- ページ情報
- 英文 170 Pages
- 納期
- 2~3営業日