
|
市場調査レポート
商品コード
1755347
SCRパワーコントローラ市場:市場機会、成長促進要因、産業動向分析、将来予測(2025~2034年)SCR Power Controller Market Opportunity, Growth Drivers, Industry Trend Analysis, and Forecast 2025 - 2034 |
||||||
カスタマイズ可能
|
|||||||
| SCRパワーコントローラ市場:市場機会、成長促進要因、産業動向分析、将来予測(2025~2034年) |
|
出版日: 2025年05月27日
発行: Global Market Insights Inc.
ページ情報: 英文 115 Pages
納期: 2~3営業日
|

全表示
- 概要
- 目次
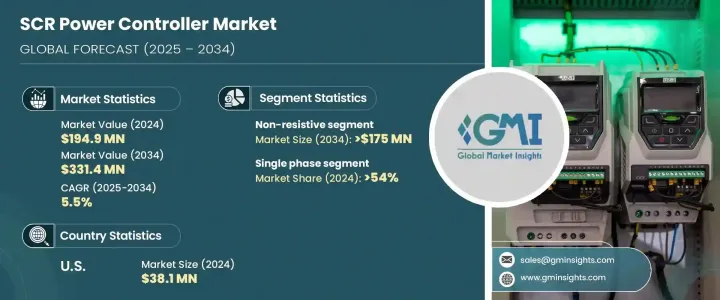
世界のSCRパワーコントローラ市場は、2024年には1億9,490万米ドルとなり、CAGR 5.5%で成長し、2034年には3億3,140万米ドルに達すると予測されています。
この増加傾向は、エネルギー効率重視の高まりと、産業オペレーション全体におけるオートメーション技術の統合拡大によるところが大きいです。企業は、生産性を高め、ワークフローを合理化し、プロセス制御の精度を高めるために、オートメーションへの依存度を高めています。こうしたシフトは、SCRコントローラのような電力調整システムの将来を形作る上で重要な役割を果たしています。
規制機関もまた、産業性能を向上させるためにより厳しい指令を導入しており、メーカーに最新のソリューションへの投資を促しています。精密な熱管理で知られるこれらのコントローラは、厳しいエネルギー使用政策に合致しているため、人気を集めています。さらに、半導体材料の革新と効率的な生産方法が、コントローラの機能性を高めながら製造コストの低減に役立っています。SCRコントローラとオートメーションシステムとの統合が進んだことで、運転効率と電力制御が最適化され、市場の拡大をさらに後押ししています。
| 市場範囲 | |
|---|---|
| 開始年 | 2024年 |
| 予測期間 | 2025~2034年 |
| 当初の市場規模 | 1億9,490万米ドル |
| 市場規模予測 | 3億3,140万米ドル |
| CAGR | 5.5% |
進化する需要ダイナミクスは、システム性能だけにとどまりません。産業部門がスマート技術を採用するにつれて、応答性と適応性に優れた電力制御装置の必要性が高まっています。企業は、電力負荷のより良い管理を可能にし、熱非効率のない連続運転を保証するソリューションを採用することで、この環境に適応しています。また、インテリジェントでエネルギー最適化された制御システムを組み込むことで、インフラの将来性を確保しようとするメーカーからの関心も高まっています。
負荷の種類別では、市場は抵抗性セグメントと非抵抗性セグメントに分類されます。このうち、非抵抗性セグメントは大きな牽引力となっており、2034年には売上高が1億7,500万米ドルを超えると予想されています。この成長は、産業運営の継続的な拡大と自動化インフラへの投資の高まりに影響されています。速度、精度、省エネが最重要視される環境において、非抵抗性SCRコントローラは多様な産業用アプリケーションに不可欠なコンポーネントとなりつつあります。
位相別では、市場は単相式と三相式に分けられます。単相式セグメントは現在業界をリードしており、2024年には54%を超える圧倒的な市場シェアを占めています。このセグメントは、コンパクトな産業用セットアップや低~中電力アプリケーションで広く使用されているため、予測期間を通じて安定した成長が見込まれています。特に新興経済諸国における小規模製造装置の開発は、単相式コントローラに新たな成長の道をもたらしています。
新興国と先進国の両方で産業成長が加速するにつれて、低電流定格のコンポーネントに対する需要が高まり、市場導入がさらに促進されると予想されます。同時に、可処分所得の増加や包装・加工品需要の増加に後押しされた消費者の嗜好の変化により、製造部門全体で自動化ソリューションの必要性が高まっています。こうした動向は、信頼性が高く安定した熱制御を実現することで知られるSCRパワーコントローラの導入拡大に道を開いています。
地域別では、米国のSCRパワーコントローラ市場が一貫した成長を示しています。2022年の市場規模は3,530万米ドル、2023年には3,670万米ドルに拡大し、2024年には3,810万米ドルに達しました。産業投資の拡大とプロセスの最適化が重視されているため、市場の見通しは引き続き明るいです。化学、半導体、製薬、食品製造などさまざまな分野で、製品の品質と業務効率という2つの目標を達成するために、最新の制御システムへの依存が高まっています。精密な加熱ソリューションへの移行は、SCRコントローラの採用を強化しています。
エネルギー効率のベンチマークを満たし、二酸化炭素排出量を削減しなければならないというプレッシャーが、メーカーに従来の加熱システムをより高度なSCRベースの代替品に置き換えるよう促しています。このシフトは特に北米で顕著であり、そこでは産業用ユーザーが持続可能性の目標に合わせて業務を近代化しています。この地域の市場は、世界の変革動向に対応して企業が自動化とデジタル化を優先しているため、急速に進化しています。
大手メーカーは、SCRパワーコントローラ市場での競争力を維持するためにイノベーション戦略を積極的に推進しています。こうした戦略には、技術的なアップグレード、自動化の統合、顧客中心の製品開発などが含まれます。デジタルトランスフォーメーションが加速する中、電力制御システムの自動化において人工知能と機械学習が大きな役割を果たし始めています。これらの技術は、企業が複雑なデータを分析し、リアルタイムで性能パラメーターを最適化するのに役立っています。半導体加工、工業用加熱、化学製造などの業界は、こうした進歩の恩恵を受ける態勢を整えており、市場の長期的な成長見通しをさらに強固なものにしています。
目次
第1章 分析手法と範囲
第2章 エグゼクティブサマリー
第3章 業界考察
- エコシステム分析
- 規制情勢
- 業界への影響要因
- 促進要因
- 業界の潜在的リスクと課題
- 成長可能性分析
- ポーター分析
- PESTEL分析
第4章 競合情勢
- イントロダクション
- 企業の市場シェア分析
- 戦略的取り組み
- 競合ベンチマーキング
- 戦略的ダッシュボード
- イノベーションと持続可能性の情勢
第5章 市場の推計・予測:負荷別(2021~2034年)
- 主要動向
- 抵抗型
- 非抵抗性
第6章 市場の推計・予測:位相別(2021~2034年)
- 主要動向
- 単相式
- 三相式
第7章 市場の推計・予測:制御方法別(2021~2034年)
- 主要動向
- 統合サイクルスイッチング
- 位相角制御
第8章 市場の推計・予測:電流定格別(2021~2034年)
- 主要動向
- 50A未満
- 50A~500A
- 500A~1,000A
- 1,000A以上
第9章 市場の推計・予測:最終用途別(2021~2034年)
- 主要動向
- 半導体
- 食品・飲料
- 金属
- プラスチック
- ガラス
- 石油・ガス
- その他
第10章 市場の推計・予測:地域別(2021~2034年)
- 主要動向
- 北米
- 米国
- カナダ
- メキシコ
- 欧州
- ドイツ
- フランス
- 英国
- イタリア
- スペイン
- トルコ
- アジア太平洋
- 中国
- インド
- 日本
- オーストラリア
- 韓国
- 中東・アフリカ
- アラブ首長国連邦
- サウジアラビア
- エジプト
- ナイジェリア
- 南アフリカ
- ラテンアメリカ
- ブラジル
- アルゼンチン
- チリ
第11章 企業プロファイル
- ABB
- Advanced Energy
- Ametek
- Avatar Instruments
- Cd Automation
- Chromalox
- Control Concepts
- Eurotherm
- Gefran
- Gino
- Jumo Process Control
- Lumel
- Omron
- Reo
- RKC Instrument
- Sichuan Yingjie Electric
- Siemens
- Spang Power Electronics
- Vishay Intertechnology
- Watlow Electric Manufacturing
The Global SCR Power Controller Market was valued at USD 194.9 million in 2024 and is estimated to grow at a CAGR of 5.5% to reach USD 331.4 million by 2034. This upward trend is largely driven by the growing emphasis on energy efficiency and the expanding integration of automation technologies across industrial operations. Companies are increasingly relying on automation to boost productivity, streamline workflows, and achieve greater precision in process control. These shifts are playing a critical role in shaping the future of power regulation systems like SCR controllers.
Regulatory bodies are also introducing stricter mandates to improve industrial performance, which is prompting manufacturers to invest in modern solutions. These controllers, known for their precise thermal management, are gaining popularity as they align with stringent energy usage policies. Additionally, innovations in semiconductor materials and efficient production practices are helping lower manufacturing costs while enhancing controller functionality. The improved integration of SCR controllers with automation systems is optimizing operational efficiency and power control, which further supports market expansion.
| Market Scope | |
|---|---|
| Start Year | 2024 |
| Forecast Year | 2025-2034 |
| Start Value | $194.9 Million |
| Forecast Value | $331.4 Million |
| CAGR | 5.5% |
The evolving demand dynamics are not just limited to system performance. With industrial sectors embracing smart technologies, the need for responsive and adaptable power controllers is intensifying. Companies are adapting to this environment by adopting solutions that allow better management of power loads and ensure continuous operation without thermal inefficiencies. The market is also witnessing increased interest from manufacturers who aim to future-proof their infrastructure by incorporating intelligent, energy-optimized control systems.
Based on load type, the market is categorized into resistive and non-resistive segments. Among these, the non-resistive segment is gaining significant traction and is expected to exceed USD 175 million in revenue by 2034. This growth is influenced by the continual expansion of industrial operations and heightened investment in automation infrastructure. In an environment where speed, precision, and energy savings are paramount, non-resistive SCR controllers are becoming an integral component in diverse industrial applications.
From a phase-based perspective, the market is divided into single-phase and three-phase systems. The single-phase segment currently leads the industry, holding a dominant market share of over 54% in 2024. This segment is anticipated to grow steadily throughout the forecast period due to its widespread usage in compact industrial setups and low-to-medium power applications. The development of small-scale manufacturing units, especially in developing economies, is providing new growth avenues for single-phase controllers.
As industrial growth accelerates in both emerging and established economies, the rising demand for components with low current ratings is expected to further bolster market adoption. At the same time, shifting consumer preferences, fueled by higher disposable incomes and increased demand for packaged and processed goods, are amplifying the need for automated solutions across manufacturing sectors. These trends are paving the way for higher deployment of SCR power controllers, which are known for delivering reliable and consistent thermal regulation.
In terms of regional performance, the SCR power controller market in the United States is showing consistent growth. It was valued at USD 35.3 million in 2022, rose to USD 36.7 million in 2023, and reached USD 38.1 million in 2024. The market outlook remains positive due to growing industrial investments and a strong emphasis on process optimization. Various sectors-including chemicals, semiconductors, pharmaceuticals, and food production-are increasingly relying on modern control systems to meet the dual objectives of product quality and operational efficiency. The move toward precise heating solutions is reinforcing the adoption of SCR controllers.
The pressure to meet energy efficiency benchmarks and reduce carbon emissions is pushing manufacturers to replace traditional heating systems with more advanced SCR-based alternatives. This shift is particularly evident in North America, where industrial users are modernizing their operations to align with sustainability goals. The regional market is evolving quickly as businesses prioritize automation and digitization in response to global transformation trends.
Leading manufacturers are actively pursuing innovation strategies to maintain their competitive edge in the SCR power controller market. These strategies include technological upgrades, automation integration, and customer-centric product development. As digital transformation accelerates, artificial intelligence and machine learning are beginning to play a larger role in the automation of power control systems. These technologies are helping companies analyze complex data and optimize performance parameters in real time. Industries such as semiconductor processing, industrial heating, and chemical manufacturing are poised to benefit from these advancements, further solidifying the market's long-term growth prospects.
Table of Contents
Chapter 1 Methodology & Scope
- 1.1 Market definitions
- 1.2 Base estimates & calculations
- 1.3 Forecast calculation
- 1.4 Data sources
- 1.4.1 Primary
- 1.4.2 Secondary
- 1.4.2.1 Paid
- 1.4.2.2 Public
Chapter 2 Executive Summary
- 2.1 Industry synopsis, 2021 - 2034
Chapter 3 Industry Insights
- 3.1 Industry ecosystem analysis
- 3.2 Regulatory landscape
- 3.3 Industry impact forces
- 3.3.1 Growth drivers
- 3.3.2 Industry pitfalls & challenges
- 3.4 Growth potential analysis
- 3.5 Porter's analysis
- 3.5.1 Bargaining power of suppliers
- 3.5.2 Bargaining power of buyers
- 3.5.3 Threat of new entrants
- 3.5.4 Threat of substitutes
- 3.6 PESTEL analysis
Chapter 4 Competitive Landscape, 2025
- 4.1 Introduction
- 4.2 Company market share analysis, 2024
- 4.3 Strategic initiative
- 4.4 Competitive benchmarking
- 4.5 Strategic dashboard
- 4.6 Innovation & sustainability landscape
Chapter 5 Market Size and Forecast, By Load, 2021 - 2034, (USD Million)
- 5.1 Key trends
- 5.2 Resistive
- 5.3 Non-resistive
Chapter 6 Market Size and Forecast, By Phase, 2021 - 2034, (USD Million)
- 6.1 Key trends
- 6.2 Single phase
- 6.3 Three phase
Chapter 7 Market Size and Forecast, By Control method, 2021 - 2034, (USD Million)
- 7.1 Key trends
- 7.2 Integrated cycle switching
- 7.3 Phase angle control
Chapter 8 Market Size and Forecast, By Current rating, 2021 - 2034, (USD Million)
- 8.1 Key trends
- 8.2 ≤ 50 A
- 8.3 > 50 A to 500 A
- 8.4 > 500 A to 1,000 A
- 8.5 ≥ 1,000 A
Chapter 9 Market Size and Forecast, By End Use, 2021 - 2034, (USD Million)
- 9.1 Key trends
- 9.2 Semiconductor
- 9.3 Food & beverages
- 9.4 Metals
- 9.5 Plastics
- 9.6 Glass
- 9.7 Oil & gas
- 9.8 Others
Chapter 10 Market Size and Forecast, By Region, 2021 - 2034, (USD Million)
- 10.1 Key trends
- 10.2 North America
- 10.2.1 U.S.
- 10.2.2 Canada
- 10.2.3 Mexico
- 10.3 Europe
- 10.3.1 Germany
- 10.3.2 France
- 10.3.3 UK
- 10.3.4 Italy
- 10.3.5 Spain
- 10.3.6 Turkey
- 10.4 Asia Pacific
- 10.4.1 China
- 10.4.2 India
- 10.4.3 Japan
- 10.4.4 Australia
- 10.4.5 South Korea
- 10.5 Middle East & Africa
- 10.5.1 UAE
- 10.5.2 Saudi Arabia
- 10.5.3 Egypt
- 10.5.4 Nigeria
- 10.5.5 South Africa
- 10.6 Latin America
- 10.6.1 Brazil
- 10.6.2 Argentina
- 10.6.3 Chile
Chapter 11 Company Profiles
- 11.1 ABB
- 11.2 Advanced Energy
- 11.3 Ametek
- 11.4 Avatar Instruments
- 11.5 Cd Automation
- 11.6 Chromalox
- 11.7 Control Concepts
- 11.8 Eurotherm
- 11.9 Gefran
- 11.10 Gino
- 11.11 Jumo Process Control
- 11.12 Lumel
- 11.13 Omron
- 11.14 Reo
- 11.15 RKC Instrument
- 11.16 Sichuan Yingjie Electric
- 11.17 Siemens
- 11.18 Spang Power Electronics
- 11.19 Vishay Intertechnology
- 11.20 Watlow Electric Manufacturing

