
|
市場調査レポート
商品コード
1698569
電気自動車充電ステーション市場の機会、成長促進要因、産業動向分析、2025年~2034年の予測Electric Vehicle Charging Station Market Opportunity, Growth Drivers, Industry Trend Analysis, and Forecast 2025-2034 |
||||||
カスタマイズ可能
|
|||||||
| 電気自動車充電ステーション市場の機会、成長促進要因、産業動向分析、2025年~2034年の予測 |
|
出版日: 2025年02月11日
発行: Global Market Insights Inc.
ページ情報: 英文 120 Pages
納期: 2~3営業日
|

全表示
- 概要
- 目次
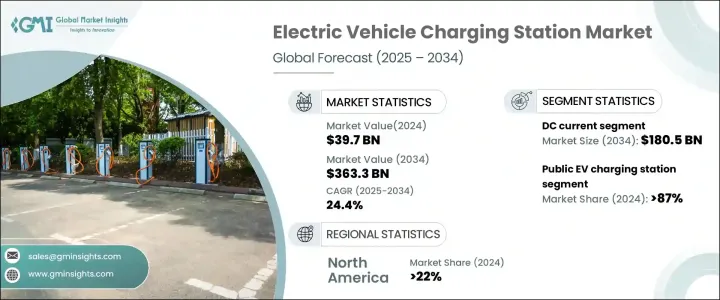
電気自動車充電ステーションの世界市場は、2024年に397億米ドルに達し、2025年から2034年にかけてCAGR 24.4%で成長すると予測されています。
電気自動車の急速な普及、政府の支援政策、充電技術の進歩がこの成長の主な促進要因です。急速充電インフラに対する需要の高まりは、自動車メーカーとエネルギー・プロバイダーの大規模充電ネットワークへの協力を促しています。
世界各国の政府は、普及を加速させるためにインセンティブや補助金を拡大しています。規制当局のイニシアチブは、充電インフラの普及を義務付けることで業界を形成しています。IoTと人工知能の統合は、負荷管理を最適化し、グリッド統合を強化します。しかし、地域によって充電規格やプロトコルが異なるため、相互運用性は依然として大きな課題となっています。また、業界は再生可能エネルギー統合へとシフトしており、多くの充電ステーションが持続可能性を向上させるために太陽光発電と蓄電池を組み込んでいます。
| 市場範囲 | |
|---|---|
| 開始年 | 2024 |
| 予測年 | 2025-2034 |
| 開始金額 | 397億米ドル |
| 予測金額 | 3,633億米ドル |
| CAGR | 24.4% |
電気自動車充電ステーション市場は、2022年に257億米ドル、2023年に307億米ドルとなり、2024年には397億米ドルに達します。このセグメントにはAC充電とDC充電があり、DC充電が市場を独占し、2034年には1,805億米ドルを超えると予想されています。DC急速充電への移行は、特に商業用や高速道路用途で加速しています。これらの充電器は充電時間を大幅に短縮するため、長距離移動や商用車に最適です。しかし、高価な機器、高度なグリッド統合、インフラ要件のため、DC急速充電器の導入にかかる高コストは依然として障壁となっています。DC急速充電ステーション1基の推定投資額は62,160~24万8,640米ドルです。
AC充電は、速度は遅いが、手頃な価格で広く利用できるため、住宅や職場での使用には依然として重要です。電気自動車の充電の約80%は家庭で行われるため、AC充電器は毎日の通勤に不可欠です。レベル1とレベル2のAC充電器は、家庭、オフィス、公共エリアで広く使用されています。公共のAC充電ステーションは、7.4kWの最低出力要件を満たさなければならないです。
公共充電ステーションは2024年の市場シェアの87%以上を占め、2034年まで毎年26%以上の成長が見込まれています。増加するEV車両をサポートするため、特に都市部、高速道路、商業施設に拡大努力が注がれています。充電ポイントの設置は近年急増しており、航続距離への不安を和らげ、長距離移動を容易にしています。公共充電インフラに対する資金調達の状況は進化しており、政府と民間団体の両方から多額の投資が行われています。米国政府は、2026年までEV充電インフラを拡大するために50億米ドルを拠出しています。
このような進展にもかかわらず、高い設置費用、土地取得費用、送電網容量の制限などの課題も残っています。急速充電ステーションの設置費用は、20,836~10万4,180米ドルと幅があります。住宅や職場での充電は、費用対効果から依然として好ましい選択であり、家庭での充電は公共ステーションよりも最大50%安いです。自動課金、スマートグリッド統合、相互運用性要件など、現在進行中の技術的進歩は、EV充電ネットワークの効率を高めると思われます。2025年までに、すべての公共充電ステーションは相互運用性規制に準拠することが義務付けられ、EVユーザーのシームレスなアクセスが確保されます。
北米は2024年に市場収益の22%以上を占め、そのシェアは2034年までにさらに拡大すると予想されます。米国のEV充電ステーション市場は、2022年の4億米ドルから2023年には5億米ドル、2024年には7億米ドルに成長しました。この成長を後押ししているのが、連邦および州レベルの資金援助イニシアティブです。全米電気自動車インフラ・フォーミュラ・プログラム(National Electric Vehicle Infrastructure Formula Program)は、全州にまたがる相互接続充電ネットワークの開発に50億米ドルを割り当てています。米国政府は、50万基の充電器からなる全国的なEV充電インフラの構築に75億米ドルを拠出し、電気自動車ユーザーにとって強固で利用しやすいネットワークを確保しています。
目次
第1章 調査手法と調査範囲
- 市場範囲と定義
- 市場推計・予測パラメータ
- 予測計算
- データソース
第2章 エグゼクティブサマリー
第3章 業界洞察
- エコシステム分析
- 規制状況
- 業界への影響要因
- 促進要因
- 業界の潜在的リスク&課題
- 成長ポテンシャル分析
- ポーター分析
- PESTEL分析
第4章 競合情勢
- イントロダクション
- 戦略的展望
- イノベーションと持続可能性の展望
第5章 市場規模・予測:電流別、2021年~2034年
- 主要動向
- AC
- レベル1
- レベル2
- DC
- DCファースト
- その他
第6章 市場規模・予測:充電サイト別、2021年~2034年
- 主要動向
- 公共
- 民間
第7章 市場規模・予測:地域別、2021年~2034年
- 主要動向
- 北米
- 米国
- カナダ
- メキシコ
- 欧州
- ノルウェー
- ドイツ
- フランス
- オランダ
- 英国
- スウェーデン
- アジア太平洋
- 中国
- 日本
- インド
- 韓国
- シンガポール
- 中東・アフリカ
- サウジアラビア
- アラブ首長国連邦
- 南アフリカ
- ラテンアメリカ
- ブラジル
- アルゼンチン
第8章 企業プロファイル
- ABB
- Blink Charging
- CHAEVI
- ChargePoint
- Delta Electronics
- Eaton
- Elli
- EVBox
- GreenWay Infrastructure
- Hyundai Motor
- Leviton Manufacturing
- NIO
- Nissan Motor
- Schneider Electric
- Siemens
- SK Signet
- Tesla
- VinFast
- Volta
- Zunder
The Global Electric Vehicle Charging Station Market reached USD 39.7 billion in 2024 and is projected to grow at a CAGR of 24.4% from 2025 to 2034. The rapid adoption of electric vehicles, supportive government policies, and advancements in charging technologies are key drivers of this growth. Increasing demand for fast-charging infrastructure is prompting automakers and energy providers to collaborate on large-scale charging networks.
Governments worldwide are expanding incentives and subsidies to accelerate deployment. Regulatory initiatives are shaping the industry by mandating widespread charging infrastructure. The integration of IoT and artificial intelligence optimizes load management and enhances grid integration. However, interoperability remains a significant challenge due to diverse charging standards and protocols across different regions. The industry is also shifting toward renewable energy integration, with many charging stations incorporating solar power and battery storage to improve sustainability.
| Market Scope | |
|---|---|
| Start Year | 2024 |
| Forecast Year | 2025-2034 |
| Start Value | $39.7 Billion |
| Forecast Value | $363.3 Billion |
| CAGR | 24.4% |
The market for electric vehicle charging stations stood at USD 25.7 billion in 2022 and USD 30.7 billion in 2023 before reaching USD 39.7 billion in 2024. The segment includes AC and DC charging, with DC charging dominating the market and expected to surpass USD 180.5 billion by 2034. The transition toward DC fast charging is accelerating, particularly in commercial and highway applications. These chargers significantly reduce charging time, making them ideal for long-distance travel and commercial fleets. However, the high cost of deploying DC fast chargers remains a barrier due to expensive equipment, advanced grid integration, and infrastructure requirements. The estimated investment for a single DC fast charging station ranges between USD 62,160 and USD 248,640.
AC charging, while slower, remains crucial for residential and workplace use due to affordability and widespread availability. Approximately 80% of electric vehicle charging occurs at home, making AC chargers essential for daily commuting. Level 1 and Level 2 AC chargers are widely used in households, offices, and public areas. Public AC charging stations must meet a minimum output power requirement of 7.4 kW.
Public charging stations accounted for over 87% of the market share in 2024 and are expected to grow at more than 26% annually until 2034. Expansion efforts are particularly focused on urban areas, highways, and commercial centers to support the increasing EV fleet. Charging point installations have surged in recent years, alleviating range anxiety and facilitating long-distance travel. The funding landscape for public charging infrastructure is evolving, with significant investments from both governments and private entities. The U.S. government has committed USD 5 billion to expand EV charging infrastructure through 2026.
Despite these advancements, challenges persist, including high installation costs, land acquisition expenses, and grid capacity limitations. Installation costs for fast-charging stations vary between USD 20,836 and USD 104,180. Residential and workplace charging remains the preferred choice due to cost-effectiveness, with home charging being up to 50% cheaper than public stations. Ongoing technological advancements, including automated billing, smart grid integration, and interoperability requirements, will enhance the efficiency of EV charging networks. By 2025, all public charging stations will be required to comply with interoperability regulations, ensuring seamless access for EV users.
North America held over 22% of the market revenue in 2024, with its share expected to increase further by 2034. The U.S. EV charging station market grew from USD 400 million in 2022 to USD 500 million in 2023 and USD 700 million in 2024. Federal and state-level funding initiatives are fueling this growth. The National Electric Vehicle Infrastructure Formula Program allocates USD 5 billion to develop an interconnected charging network across all states. The U.S. government has committed USD 7.5 billion to building a nationwide EV charging infrastructure of 500,000 chargers, ensuring a robust and accessible network for electric vehicle users.
Table of Contents
Chapter 1 Methodology & Scope
- 1.1 Market scope & definitions
- 1.2 Market estimates & forecast parameters
- 1.3 Forecast calculation
- 1.4 Data sources
- 1.4.1 Primary
- 1.4.2 Secondary
- 1.4.2.1 Paid
- 1.4.2.2 Public
Chapter 2 Executive Summary
- 2.1 Industry synopsis, 2021 - 2034
Chapter 3 Industry Insights
- 3.1 Industry ecosystem analysis
- 3.2 Regulatory landscape
- 3.3 Industry impact forces
- 3.3.1 Growth drivers
- 3.3.2 Industry pitfalls & challenges
- 3.4 Growth potential analysis
- 3.5 Porter's analysis
- 3.5.1 Bargaining power of suppliers
- 3.5.2 Bargaining power of buyers
- 3.5.3 Threat of new entrants
- 3.5.4 Threat of substitutes
- 3.6 PESTEL analysis
Chapter 4 Competitive Landscape, 2024
- 4.1 Introduction
- 4.2 Strategic outlook
- 4.3 Innovation & sustainability landscape
Chapter 5 Market Size and Forecast, By Current, 2021 – 2034 (Units, USD Billion)
- 5.1 Key trends
- 5.2 AC
- 5.2.1 Level 1
- 5.2.2 Level 2
- 5.3 DC
- 5.3.1 DC Fast
- 5.3.2 Others
Chapter 6 Market Size and Forecast, By Charging Site, 2021 – 2034 (Units, USD Billion)
- 6.1 Key trends
- 6.2 Public
- 6.3 Private
Chapter 7 Market Size and Forecast, By Region, 2021 – 2034 (Units, USD Billion)
- 7.1 Key trends
- 7.2 North America
- 7.2.1 U.S.
- 7.2.2 Canada
- 7.2.3 Mexico
- 7.3 Europe
- 7.3.1 Norway
- 7.3.2 Germany
- 7.3.3 France
- 7.3.4 Netherlands
- 7.3.5 UK
- 7.3.6 Sweden
- 7.4 Asia Pacific
- 7.4.1 China
- 7.4.2 Japan
- 7.4.3 India
- 7.4.4 South Korea
- 7.4.5 Singapore
- 7.5 Middle East & Africa
- 7.5.1 Saudi Arabia
- 7.5.2 UAE
- 7.5.3 South Africa
- 7.6 Latin America
- 7.6.1 Brazil
- 7.6.2 Argentina
Chapter 8 Company Profiles
- 8.1 ABB
- 8.2 Blink Charging
- 8.3 CHAEVI
- 8.4 ChargePoint
- 8.5 Delta Electronics
- 8.6 Eaton
- 8.7 Elli
- 8.8 EVBox
- 8.9 GreenWay Infrastructure
- 8.10 Hyundai Motor
- 8.11 Leviton Manufacturing
- 8.12 NIO
- 8.13 Nissan Motor
- 8.14 Schneider Electric
- 8.15 Siemens
- 8.16 SK Signet
- 8.17 Tesla
- 8.18 VinFast
- 8.19 Volta
- 8.20 Zunder

