
|
市場調査レポート
商品コード
1797868
容積式ブロワ市場の機会、成長促進要因、産業動向分析、2025年~2034年の予測Positive Displacement Blowers Market Opportunity, Growth Drivers, Industry Trend Analysis, and Forecast 2025 - 2034 |
||||||
カスタマイズ可能
|
|||||||
| 容積式ブロワ市場の機会、成長促進要因、産業動向分析、2025年~2034年の予測 |
|
出版日: 2025年07月25日
発行: Global Market Insights Inc.
ページ情報: 英文 160 Pages
納期: 2~3営業日
|

全表示
- 概要
- 目次
容積式ブロワの世界市場規模は、2024年に30億米ドルとなり、CAGR 4.8%で成長し、2034年には47億米ドルに達すると予測されています。
市場成長の原動力は、製造業、石油・ガス、発電、化学などの主要産業が、マテリアルハンドリング、エンジン用燃焼空気、空気輸送などの重要なプロセスでブロワに大きく依存していることです。容積式ブロワは、安定したエアフローを確保するために不可欠であり、これらのセクターにおける空気の質、信頼性、および全体的な作業効率を維持する上で極めて重要な役割を果たしています。さらに、清潔な水に対する世界の需要の高まりと環境規制の強化により、水インフラへの投資が増加しており、廃水処理プラントにおける効率的なブロワの必要性が高まっています。ブロワは、曝気槽に必要な空気を供給して微生物の生命を維持することで、生物学的処理プロセスをサポートします。電気自動車(EV)への関心が高まる中、ブロワはEVバッテリーの熱システムの管理でも重要な役割を果たしています。都市化が進み、工業プロセスが高度化するにつれて、信頼性が高くエネルギー効率の高い容積式ブロワに対する需要は引き続き堅調に推移すると予想されます。
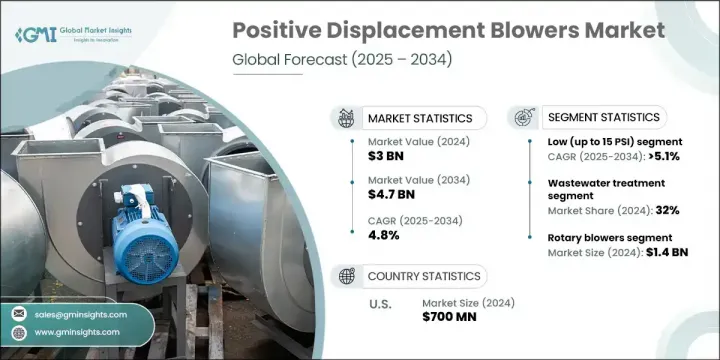
回転式ブロワセグメントは、2024年に14億米ドルを生み出しました。予測期間中、CAGR 5.1%で成長を続けると予測されています。ロータリーブロワーは、その耐久性、最小限のメンテナンスの必要性、費用対効果が高く評価されています。シンプルな機械設計で、大きな摩耗や故障を起こすことなく長期間運転できることが、大規模な産業施設だけでなく小規模な産業施設でも人気を集めています。信頼性と修理の容易さにより、ダウンタイムの大幅な短縮と全体的な運用コストの削減を実現し、さまざまな産業で好まれています。
| 市場範囲 | |
|---|---|
| 開始年 | 2024 |
| 予測年 | 2025-2034 |
| 開始金額 | 30億米ドル |
| 予測金額 | 47億米ドル |
| CAGR | 4.8% |
廃水処理分野は2024年に32%のシェアを占め、2025年から2034年にかけてCAGR 5.3%で成長すると予測されます。容積式ブロワ、特にロータリーローブブロワは、生物処理システムに不可欠であり、曝気槽に継続的かつ安定した空気量を供給して微生物の活動を維持します。このプロセスは、廃水処理施設における有機廃棄物の分解に不可欠です。容積式ブロワが圧力の変動に関係なく一定の空気流を供給できることは、廃水管理システムの効率と効果を維持する上で大きな利点となります。
米国の容積式ブロワ市場は、2024年に78%のシェアを占め、7億米ドルを生み出しました。市場は、廃水処理インフラへの投資の増加、環境基準の厳格化、産業アプリケーションの近代化によって成長しています。安定したエネルギー効率の高い曝気システムに対する需要の高まりは、環境当局が設定した厳しい排出基準や、全国の老朽化した水処理プラントのアップグレードによってもたらされています。
世界の容積式ブロワ市場で事業を展開する主要企業には、Aerzen、Airtech Blower、AMCL Machinery、Blowvacc Transmission、Busch SE、Eurus Blowers、Greatech Machinery、日立、Howden Group、Ingersoll Rand、Kaeser Kompressoren、KPT Blowers、Mapro International、Roots、Unozawa-gumi Iron Worksなどがあります。市場ポジションを強化するため、容積式ブロワセクターの企業はいくつかの戦略的イニシアティブに注力しています。具体的には、エネルギー効率が高く、メンテナンスが簡単で、環境に優しいブロワの開発などです。また、新興市場への参入や、特に水処理および発電分野における大規模なインフラ・プロジェクトとの戦略的パートナーシップの構築により、地理的プレゼンスを拡大しています。
目次
第1章 調査手法と範囲
第2章 エグゼクティブサマリー
第3章 業界考察
- エコシステム分析
- サプライヤーの情勢
- 利益率
- 各段階での付加価値
- バリューチェーンに影響を与える要因
- 業界への影響要因
- 促進要因
- 業界の潜在的リスク&課題
- 機会
- 成長可能性分析
- 将来の市場動向
- テクノロジーとイノベーションの情勢
- 現在の技術動向
- 新興技術
- 価格動向
- 地域別
- 製品タイプ別
- 規制情勢
- 標準とコンプライアンス要件
- 地域規制枠組み
- 認証基準
- ポーター分析
- PESTEL分析
第4章 競合情勢
- イントロダクション
- 企業の市場シェア分析
- 地域別
- 企業マトリックス分析
- 主要市場企業の競合分析
- 競合ポジショニングマトリックス
- 主な発展
- 合併と買収
- パートナーシップとコラボレーション
- 新製品の発売
- 拡張計画
第5章 市場推計・予測:製品タイプ別、2021年~2034年
- 主要動向
- ロータリーブロワー
- ローブブロワー
- スクリューブロワー
第6章 市場推計・予測:圧力出力別、2021年~2034年
- 主要動向
- 低(15 PSI未満)
- 中(15 PSI-30 PSI)
- 高(30 PSI以上)
第7章 市場推計・予測:用途別、2021年~2034年
- 主要動向
- 廃水処理
- 空気輸送システム
- セメント生産
- 化学処理
- 発電
- その他(冶金、真空処理、食品・飲料など)
第8章 市場推計・予測:流通チャネル別、2021年~2034年
- 主要動向
- 直接
- 間接
第9章 市場推計・予測:地域別、2021年~2034年
- 主要動向
- 北米
- 米国
- カナダ
- 欧州
- ドイツ
- 英国
- フランス
- スペイン
- イタリア
- オランダ
- アジア太平洋地域
- 中国
- 日本
- インド
- オーストラリア
- 韓国
- ラテンアメリカ
- ブラジル
- メキシコ
- アルゼンチン
- 中東・アフリカ
- 南アフリカ
- サウジアラビア
- アラブ首長国連邦
第10章 企業プロファイル
- Aerzen
- Airtech Blower
- AMCL Machinery
- Blowvacc Transmission
- Busch SE
- Eurus Blowers
- Mapro International
- Greatech Machinery
- Hitachi
- Howden Group
- Ingersoll Rand
- Kaeser Kompressoren
- KPT Blowers
- Roots
- Unozawa-gumi Iron Works
The Global Positive Displacement Blowers Market was valued at USD 3 billion in 2024 and is estimated to grow at a CAGR of 4.8% to reach USD 4.7 billion by 2034. The market growth is driven by several industrial factors, with key industries such as manufacturing, oil & gas, power generation, and chemicals heavily relying on blowers for vital processes like material handling, combustion air for engines, and pneumatic conveying. Positive displacement blowers are essential for ensuring consistent airflow and play a pivotal role in maintaining air quality, reliability, and the overall efficiency of operations across these sectors. Additionally, rising global demand for clean water and stricter environmental regulations are prompting increased investments in water infrastructure, driving the need for efficient blowers in wastewater treatment plants. Blowers support the biological treatment process by providing the necessary air for aeration tanks to sustain microbial life. With increasing interest in electric vehicles (EVs), blowers are also playing a crucial role in managing the thermal systems of EV batteries. As urbanization grows and industrial processes become more advanced, the demand for reliable and energy-efficient positive displacement blowers is expected to remain strong.
The rotary blowers segment generated USD 1.4 billion in 2024. They are projected to continue their growth at a CAGR of 5.1% during the forecast period. Rotary blowers are highly valued for their durability, minimal maintenance needs, and cost-effectiveness. Their simple mechanical design and ability to operate for long periods without significant wear or breakdown contribute to their popularity in both large and smaller industrial facilities. They offer a substantial reduction in downtime and lower overall operational costs due to their reliability and ease of repair, making them a preferred choice in various industries.
| Market Scope | |
|---|---|
| Start Year | 2024 |
| Forecast Year | 2025-2034 |
| Start Value | $3 Billion |
| Forecast Value | $4.7 Billion |
| CAGR | 4.8% |
The wastewater treatment segment held a 32% share in 2024 and is expected to grow at a CAGR of 5.3% from 2025 to 2034. Positive displacement blowers, particularly rotary lobe blowers, are integral to biological treatment systems, ensuring that aeration tanks receive a continuous and stable volume of air to maintain microbial activity. This process is essential for breaking down organic waste in wastewater treatment facilities. The ability of positive displacement blowers to provide constant airflow, regardless of pressure fluctuations, is a significant advantage in maintaining the efficiency and effectiveness of wastewater management systems.
United States Positive Displacement Blowers Market held a 78% share in 2024, generating USD 700 million. The market is growing due to increasing investments in wastewater treatment infrastructure, stricter environmental standards, and the modernization of industrial applications. Heightened demand for stable and energy-efficient aeration systems is driven by stringent discharge standards set by environmental agencies and the upgrading of aging water treatment plants across the country.
Key companies operating in the Global Positive Displacement Blowers Market include Aerzen, Airtech Blower, AMCL Machinery, Blowvacc Transmission, Busch SE, Eurus Blowers, Greatech Machinery, Hitachi, Howden Group, Ingersoll Rand, Kaeser Kompressoren, KPT Blowers, Mapro International, Roots, and Unozawa-gumi Iron Works. To strengthen their market position, companies in the positive displacement blowers sector are focusing on several strategic initiatives. These include investing heavily in product innovation, specifically in the development of energy-efficient, low-maintenance, and environmentally friendly blowers. Companies are also expanding their geographic presence by entering emerging markets and forming strategic partnerships with large infrastructure projects, particularly in the water treatment and power generation sectors.
Table of Contents
Chapter 1 Methodology and scope
- 1.1 Market scope and definition
- 1.2 Research design
- 1.2.1 Research approach
- 1.2.2 Data collection methods
- 1.3 Data mining sources
- 1.3.1 Global
- 1.3.2 Regional/country
- 1.4 Base estimates and calculations
- 1.4.1 Base year calculation
- 1.4.2 Key trends for market estimation
- 1.5 Primary research and validation
- 1.5.1 Primary sources
- 1.6 Forecast model
- 1.7 Research assumptions and limitations
Chapter 2 Executive summary
- 2.1 Industry 360° synopsis
- 2.2 Key market trends
- 2.2.1 Regional
- 2.2.2 By product type
- 2.2.3 By pressure output
- 2.2.4 By application
- 2.2.5 By distribution channel
- 2.3 CXO perspectives: strategic imperatives
- 2.3.1 Key decision points for industry executives
- 2.3.2 Critical success factors for market players
- 2.4 Future outlook and strategic recommendations
Chapter 3 Industry insights
- 3.1 Industry ecosystem analysis
- 3.1.1 Supplier landscape
- 3.1.2 Profit margin
- 3.1.3 Value addition at each stage
- 3.1.4 Factor affecting the value chain
- 3.2 Industry impact forces
- 3.2.1 Growth drivers
- 3.2.2 Industry pitfalls & challenges
- 3.2.3 Opportunities
- 3.3 Growth potential analysis
- 3.4 Future market trends
- 3.5 Technology and innovation landscape
- 3.5.1 Current technological trends
- 3.5.2 Emerging technologies
- 3.6 Price trends
- 3.6.1 By region
- 3.6.2 By product type
- 3.7 Regulatory landscape
- 3.7.1 Standards and compliance requirements
- 3.7.2 Regional regulatory frameworks
- 3.7.3 Certification standards
- 3.8 Porter's analysis
- 3.9 PESTEL analysis
Chapter 4 Competitive landscape, 2024
- 4.1 Introduction
- 4.2 Company market share analysis
- 4.2.1 By region
- 4.2.1.1 North America
- 4.2.1.2 Europe
- 4.2.1.3 Asia Pacific
- 4.2.1.4 Latin America
- 4.2.1.5 MEA
- 4.2.1 By region
- 4.3 Company matrix analysis
- 4.4 Competitive analysis of major market players
- 4.5 Competitive positioning matrix
- 4.6 Key developments
- 4.6.1 Mergers & acquisitions
- 4.6.2 Partnerships & collaborations
- 4.6.3 New product launches
- 4.6.4 Expansion plans
Chapter 5 Market Estimates & Forecast, By Product Type, 2021 - 2034 ($Billion, Million Units)
- 5.1 Key trends
- 5.2 Rotary blowers
- 5.3 Lobe blowers
- 5.4 Screw blowers
Chapter 6 Market Estimates & Forecast, By Pressure Output, 2021 - 2034 ($Billion, Million Units)
- 6.1 Key trends
- 6.2 Low (up to 15 PSI)
- 6.3 Medium (15 PSI - 30 PSI)
- 6.4 High (above 30 PSI)
Chapter 7 Market Estimates & Forecast, By Application, 2021 - 2034 ($Billion, Million Units)
- 7.1 Key trends
- 7.2 Wastewater treatment
- 7.3 Pneumatic conveying systems
- 7.4 Cement production
- 7.5 Chemical processing
- 7.6 Power generation
- 7.7 Others (metallurgy, vacuum processing, food & beverage, etc.)
Chapter 8 Market Estimates & Forecast, By Distribution Channel, 2021 - 2034 ($Billion, Million Units)
- 8.1 Key trends
- 8.2 Direct
- 8.3 Indirect
Chapter 9 Market Estimates & Forecast, By Region, 2021 - 2034 ($Billion, Million Units)
- 9.1 Key trends
- 9.2 North America
- 9.2.1 U.S.
- 9.2.2 Canada
- 9.3 Europe
- 9.3.1 Germany
- 9.3.2 UK
- 9.3.3 France
- 9.3.4 Spain
- 9.3.5 Italy
- 9.3.6 Netherlands
- 9.4 Asia Pacific
- 9.4.1 China
- 9.4.2 Japan
- 9.4.3 India
- 9.4.4 Australia
- 9.4.5 South Korea
- 9.5 Latin America
- 9.5.1 Brazil
- 9.5.2 Mexico
- 9.5.3 Argentina
- 9.6 MEA
- 9.6.1 South Africa
- 9.6.2 Saudi Arabia
- 9.6.3 UAE
Chapter 10 Company Profiles
- 10.1 Aerzen
- 10.2 Airtech Blower
- 10.3 AMCL Machinery
- 10.4 Blowvacc Transmission
- 10.5 Busch SE
- 10.6 Eurus Blowers
- 10.7 Mapro International
- 10.8 Greatech Machinery
- 10.9 Hitachi
- 10.10 Howden Group
- 10.11 Ingersoll Rand
- 10.12 Kaeser Kompressoren
- 10.13 KPT Blowers
- 10.14 Roots
- 10.15 Unozawa-gumi Iron Works

