
|
市場調査レポート
商品コード
1928969
油圧モーター市場の機会、成長要因、業界動向分析、および2026年から2035年までの予測Hydraulic Motors Market Opportunity, Growth Drivers, Industry Trend Analysis, and Forecast 2026 - 2035 |
||||||
カスタマイズ可能
|
|||||||
| 油圧モーター市場の機会、成長要因、業界動向分析、および2026年から2035年までの予測 |
|
出版日: 2026年01月14日
発行: Global Market Insights Inc.
ページ情報: 英文 250 Pages
納期: 2~3営業日
|

概要
世界の油圧モーター市場は、2025年に133億米ドルと評価され、2035年までにCAGR6.9%で成長し、254億米ドルに達すると予測されております。
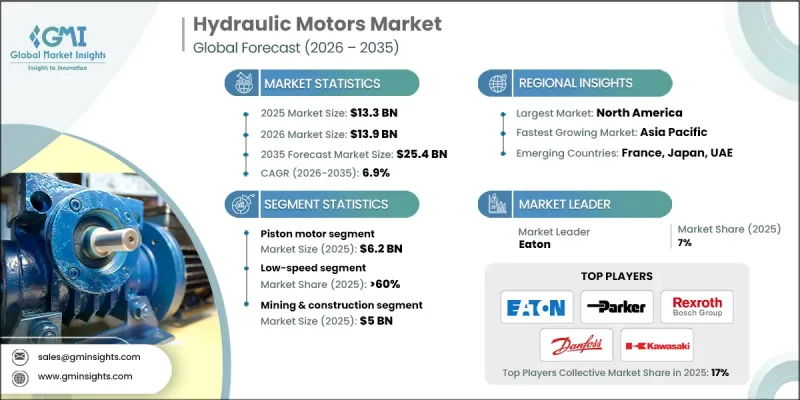
この需要増加は、建設、農業、鉱業セクターの世界の成長に支えられています。政府による交通インフラ、住宅、産業プロジェクトへの投資が、ローダー、クレーン、掘削機などの重機の需要を牽引しており、これらの機械は過酷な条件下での高トルクと信頼性の高い性能を実現するために油圧モーターに依存しています。鉱業では、掘削、鉱物輸送、破砕、マテリアルハンドリングに油圧駆動機器が引き続き活用されており、市場の需要をさらに押し上げています。農業分野では、機械化と高効率機器への移行が導入を加速させており、企業は人件費削減、信頼性向上、生産性向上を実現しています。これらの産業における大型機械化の動向は、油圧モーターにとって強力な成長機会を生み出しています。油圧モーターは、複数の分野にわたる長期運用において、精密な制御、高い出力密度、耐久性を提供するためです。
| 市場範囲 | |
|---|---|
| 開始年 | 2025年 |
| 予測年度 | 2026-2035 |
| 開始時価値 | 133億米ドル |
| 予測金額 | 254億米ドル |
| CAGR | 6.9% |
2025年、ピストンモーターセグメントは62億米ドルの売上高を生み出しました。ピストンモーターは、他の油圧モーターと比較して、より高い出力密度、優れた制御性、およびより大きな最大圧力容量を提供します。放射状または軸方向に配置された往復運動するピストンを通じて油圧エネルギーを回転機械エネルギーに変換することで、低回転数において非常に高いトルクを発生させます。
低速油圧モーターセグメントは、2025年に60%のシェアを占めました。これらのモーターは500 RPM未満で動作し、低エネルギー消費とシステムへの最小限の負荷で大きなトルクを供給します。主に精密な動作と正確な位置決めを必要とする重作業用途に使用され、多くの産業用油圧システムに不可欠です。
米国油圧モーター市場は2025年に79.4%のシェアを占め、36億米ドルの規模となりました。建設、鉱業、農業、製造業、マテリアルハンドリングなどの産業における需要増加が牽引しています。高速道路の維持管理、橋梁建設、再生可能エネルギープロジェクト、産業施設の更新を含む連邦および州のインフラ整備計画が、油圧モーターの導入を促進しています。米国製造業では、ロボット工学、自動化、精密機械への高容量油圧モーターの採用が拡大しており、市場のさらなる成長を支えています。
よくあるご質問
目次
第1章 調査手法と範囲
第2章 エグゼクティブサマリー
第3章 業界考察
- エコシステム分析
- サプライヤーの情勢
- 利益率
- 各段階における付加価値
- バリューチェーンに影響を与える要因
- 業界への影響要因
- 促進要因
- 建設、農業、鉱業セクターの拡大
- 産業オートメーションとインダストリー4.0
- 技術的進歩
- 業界の潜在的リスク&課題
- 初期投資および維持管理コストの高さ
- 電気モーターとの競合
- 機会
- スマート/デジタル化された油圧システム
- 環境に優しい油圧作動油及び低漏れシステムの開発
- 促進要因
- 成長可能性分析
- 将来の市場動向
- 技術とイノベーションの動向
- 現在の技術動向
- 新興技術
- 価格動向
- 地域別
- 製品タイプ別
- 規制情勢
- 規格およびコンプライアンス要件
- 地域別規制枠組み
- 認証基準
- ポーターの分析
- PESTEL分析
第4章 競合情勢
- イントロダクション
- 企業の市場シェア分析
- 地域別
- 企業マトリクス分析
- 主要市場企業の競合分析
- 競合ポジショニングマトリックス
- 主な発展
- 合併・買収
- 提携・協業
- 新製品の発売
- 拡大計画
第5章 市場推計・予測:製品タイプ別、2022-2035
- ギアモーター
- ベーンモーター
- ピストンモーター
第6章 市場推計・予測:速度別、2022-2035
- 低速(500 Rpm未満)
- 高速(500 Rpm超)
第7章 市場推計・予測:用途別、2022-2035
- 鉱業・建設
- 石油・ガス
- 農業・林業
- 自動車
- 包装
- 工作機械
- マテリアルハンドリング
- 航空宇宙・防衛
第8章 市場推計・予測:地域別、2022-2035
- 北米
- 米国
- カナダ
- 欧州
- ドイツ
- 英国
- フランス
- イタリア
- スペイン
- アジア太平洋地域
- 中国
- 日本
- インド
- オーストラリア
- 韓国
- ラテンアメリカ
- ブラジル
- メキシコ
- アルゼンチン
- 中東・アフリカ
- 南アフリカ
- サウジアラビア
- アラブ首長国連邦
第9章 企業プロファイル
- Bosch Rexroth AG
- Bucker Hydraulics GmbH
- Casappa
- Concentric AB
- Daikin
- Danfoss Group
- Eaton
- Fluitronics GmbH
- SAI Group
- KYB
- Kawasaki Heavy Industries
- Linde Hydraulics
- Moog
- Nachi-Fujikoshi
- Parker Hannifin

