|
|
市場調査レポート
商品コード
1454212
世界のアクリロニトリル産業の見通し(~2028年)- 生産能力と設備投資の予測、稼働中・計画済みの全プラントの詳細Global Acrylonitrile Industry Outlook to 2028 - Capacity and Capital Expenditure Forecasts with Details of All Active and Planned Plants |
||||||
|
|
|||||||
|
● お客様のご希望に応じて、既存データの加工や未掲載情報(例:国別セグメント)の追加などの対応が可能です。 詳細はお問い合わせください。 |
|||||||


| 世界のアクリロニトリル産業の見通し(~2028年)- 生産能力と設備投資の予測、稼働中・計画済みの全プラントの詳細 |
|
出版日: 2024年03月04日
発行: GlobalData
ページ情報: 英文 85 Pages
納期: 即納可能
|
- 全表示
- 概要
- 図表
- 目次
世界のアクリロニトリル生産能力は、今後5年間でかなりの伸びを示し、2023年の955万トン/年から2028年に1,225万トン/年に増加する可能性があり、合計28%の成長を記録する見込みです。
今後数年間に、アジア、中東、旧ソ連で約13件のアクリロニトリルプロジェクトが計画・発表されています。国別では、中国が2027年までにアクリロニトリルの生産能力増強をリードし、サウジアラビアがこれに続くと予測されます。INEOS Ltd、Zhejiang Rongsheng Holding Group Co Ltd、Sasa Polyester Sanayi ASの3社が、今後数年間の世界で計画・発表済みの生産能力増強の上位3社です。
当レポートでは、世界のアクリロニトリル産業について調査分析し、各地域の生産能力と設備投資の予測や、計画・発表済みプラントの詳細情報などを提供しています。
目次
第1章 イントロダクション
第2章 世界のアクリロニトリル生産能力と設備投資のレビュー
- 世界のアクリロニトリル産業の概要
- 世界のアクリロニトリル産業、生産能力:主要国別(2018年~2028年)
- 世界のアクリロニトリル産業、生産能力シェアと成長:主要国別(2018年~2023年)
- 世界のアクリロニトリル産業、計画・発表済みプロジェクト上位10件
- 世界のアクリロニトリル産業、生産能力の寄与率:地域別
- 主要企業:アクリロニトリル生産能力の寄与率別(2022年)
- 主要国:アクリロニトリル産業に対する稼働中の世界の生産能力の寄与率別
- 世界のアクリロニトリル産業、プラント設備容量:生産プロセス別(2023年)
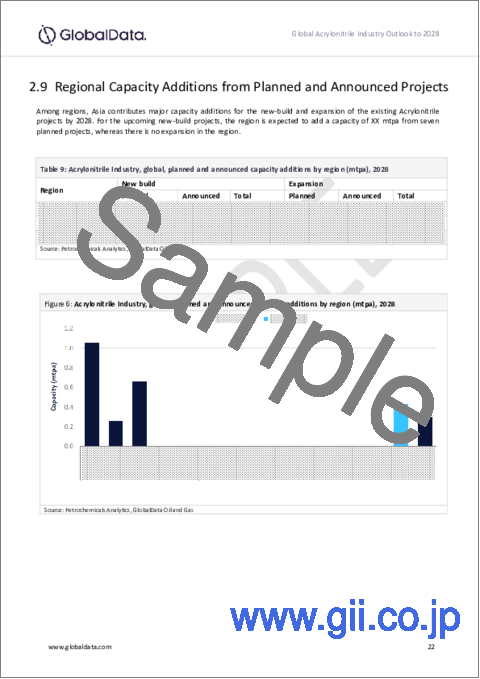
- 地域の生産能力増強:計画・発表済みプロジェクト別
- 世界の生産能力増強:計画・発表済みプロジェクト別、上位10ヶ国別
- 計画・発表済みプロジェクトによる世界の生産能力増強:上位10社別
- 計画・発表済みプロジェクトに対する地域の設備投資支出
- 計画・発表済みプロジェクトに対する世界の設備投資支出:国別
第3章 世界の計画・発表済みアクリロニトリルプロジェクト
第4章 アジアのアクリロニトリル産業
- アジアのアクリロニトリル産業の概要
- アジアのアクリロニトリル産業、生産能力:主要国別(2018年~2028年)
- アジアのアクリロニトリル産業、生産能力シェアと成長:主要国別(2018年~2023年)
- アジアのアクリロニトリル産業、プラント設備容量:生産プロセス別(2023年)
- アジアのアクリロニトリル産業、計画・発表済みプロジェクトの新規建設と拡張設備投資の見通し
- アジアのアクリロニトリル産業、計画・発表済みプロジェクトの新規建設と拡張設備投資の見通し:国別
- 中国のアクリロニトリル産業
- アクリロニトリル産業、韓国
- アクリロニトリル産業、日本
- アクリロニトリル産業、台湾
- アクリロニトリル産業、タイ
第5章 欧州のアクリロニトリル産業
- 欧州のアクリロニトリル産業の概要
- 欧州のアクリロニトリル産業、生産能力:主要国別(2018年~2028年)
- 欧州のアクリロニトリル産業、生産能力シェアと成長:主要国別(2018年~2023年)
- 欧州のアクリロニトリル産業、プラント設備容量:生産プロセス別(2022年)
- アクリロニトリル産業、ドイツ
- アクリロニトリル産業、オランダ
- アクリロニトリル産業、ルーマニア
- アクリロニトリル産業、英国
第6章 旧ソ連のアクリロニトリル産業
- 旧ソ連のアクリロニトリル産業の概要
- 旧ソ連のアクリロニトリル産業、生産能力:主要国別(2018年~2028年)
- 旧ソ連のアクリロニトリル産業、生産能力シェアと成長:主要国別(2018年~2023年)
- 旧ソ連のアクリロニトリル産業、プラント設備容量:生産プロセス別(2023年)
- 旧ソ連のアクリロニトリル産業、計画・発表済みプロジェクトの新規建設と拡張設備投資の見通し
- 旧ソ連のアクリロニトリル産業、計画・発表済みプロジェクトの新規建設と拡張設備投資の見通し:国別
- アクリロニトリル産業、ロシア
- アクリロニトリル産業、ベラルーシ
第7章 中東のアクリロニトリル産業
- 中東のアクリロニトリル産業の概要
- 中東のアクリロニトリル産業、生産能力:主要国別(2017年~2027年)
- 中東のアクリロニトリル産業、生産能力シェアと成長:主要国別(2018年~2023年)
- 中東のアクリロニトリル産業、プラント設備容量:生産プロセス別(2022年)
- 中東のアクリロニトリル産業、計画・発表済みプロジェクトの新規建設と拡張設備投資の見通し
- 中東のアクリロニトリル産業、計画・発表済みプロジェクトの新規建設と拡張設備投資の見通し:国別
- アクリロニトリル産業、トルコ
- アクリロニトリル産業、サウジアラビア
第8章 北米のアクリロニトリル産業
- 北米のアクリロニトリル産業の概要
- 北米のアクリロニトリル産業、生産能力:主要国別(2018年~2028年)
- 北米のアクリロニトリル産業、生産能力シェアと成長:主要国別(2018年~2023年)
- 北米のアクリロニトリル産業、プラント設備容量:生産プロセス別(2023年)
- アクリロニトリル産業、米国
第9章 南米のアクリロニトリル産業
- 南米のアクリロニトリル産業の概要
- 南米のアクリロニトリル産業、生産能力:主要国別(2018年~2028年)
- 南米のアクリロニトリル産業、生産能力シェアと成長:主要国別(2018年~2023年)
- 南米のアクリロニトリル産業、プラント設備容量:生産プロセス別(2023年)
- アクリロニトリル産業、ブラジル
第10章 付録
List of Tables
- Table 1: Acrylonitrile Industry, Global, key statistics, 2023
- Table 2: Acrylonitrile Industry, Global, Capacity by Key Countries (mtpa), 2018-2028
- Table 3: Acrylonitrile Industry, Global, Top 10 Planned and Announced Projects Details, 2024-2028
- Table 4: Acrylonitrile Industry, Global, capacity by region (mtpa), 2023-2028
- Table 5: Acrylonitrile Industry, global, capacity share of top 10 Companies (%), 2023
- Table 6: Acrylonitrile Industry, global, active Capacity of Top 10 Countries (mtpa), 2023
- Table 7: Global, Acrylonitrile Industry, Installed Plant Capacity by Production Process (%) 2023
- Table 8: Global Acrylonitrile Industry, Installed Plant Capacity by Propylene Ammoxidation process, 2023
- Table 9: Acrylonitrile Industry, global, planned and announced capacity additions by region (mtpa), 2028
- Table 10: Acrylonitrile Industry, global, planned and announced capacity additions by top 10 countries (mtpa), 2028
- Table 11: Acrylonitrile Industry, global, planned and announced capacity additions by Top 10 Companies (mtpa), 2028
- Table 12: Acrylonitrile Industry, Global, Total Capex Spending on Planned and Announced Projects by Region ($ mil), 2024-2028
- Table 13: Acrylonitrile Industry, Global, Total Capex Spending on Planned and Announced Projects by Countries ($ mil), 2024-2028
- Table 14: Global, planned and announced Acrylonitrile projects details
- Table 15: Acrylonitrile Industry, Asia, key statistics, 2023
- Table 16: Acrylonitrile Industry, Asia, Capacity by Key Countries (mtpa), 2018-2028
- Table 17: Asia, Acrylonitrile Industry, Installed Plant Capacity by Production Process (%) 2023
- Table 18: Asia, Acrylonitrile Industry, Installed Plant Capacity by Propylene Ammoxidation process, 2023
- Table 19: Acrylonitrile Industry, Asia, New Build and Expansion Capital Expenditure Outlook for Planned and Announced Projects ($B), 2024-2028
- Table 20: Acrylonitrile Industry, Asia, New Build and Expansion Capital Expenditure Outlook for Planned and Announced Projects by Countries ($B), 2024-2028
- Table 21: Acrylonitrile Industry, China, Capacity by Major Plants (mtpa) 2018-2028
- Table 22: Acrylonitrile Industry, South Korea, Capacity by Major Plants (mtpa) 2018-2028
- Table 23: Acrylonitrile Industry, Japan, Capacity by Major Plants (mtpa) 2018-2028
- Table 24: Acrylonitrile Industry, Taiwan, Capacity by Major Plants (mtpa) 2018-2028
- Table 25: Acrylonitrile Industry, Thailand, Capacity by Major Plants (mtpa) 2018-2028
- Table 26: Acrylonitrile Industry, Europe, key statistics, 2023
- Table 27: Acrylonitrile Industry, Europe, Capacity by Key Countries (mtpa), 2018-2028
- Table 28: Europe, Acrylonitrile Industry, Installed Plant Capacity by Production Process (%) 2023
- Table 29: Europe, Acrylonitrile Industry, Installed Plant Capacity by Propylene Ammoxidation process, 2023
- Table 30: Acrylonitrile Industry, Germany, Capacity by Major Plants (mtpa) 2018-2028
- Table 31: Acrylonitrile Industry, Netherlands, Capacity by Major Plants (mtpa) 2018-2028
- Table 32: Acrylonitrile Industry, Romania, Capacity by Major Plants (mtpa) 2018-2028
- Table 33: Acrylonitrile Industry, UK, Capacity by Major Plants (mtpa) 2018-2028
- Table 34: Acrylonitrile Industry, FSU, key statistics, 2023
- Table 35: Acrylonitrile Industry, FSU, Capacity by Key Countries (mtpa), 2018-2028
- Table 36: Acrylonitrile Industry, FSU, New Build and Expansion Capital Expenditure Outlook for Planned and Announced Projects ($M), 2024-2028
- Table 37: Acrylonitrile Industry, FSU, New Build and Expansion Capital Expenditure Outlook for Planned and Announced Projects by Countries ($M), 2024-2028
- Table 38: Acrylonitrile Industry, Russia, Capacity by Major Plants (mtpa) 2018-2028
- Table 39: Acrylonitrile Industry, Belarus, Capacity by Major Plants (mtpa) 2018-2028
- Table 40: Acrylonitrile Industry, Middle East, key statistics, 2023
- Table 41: Acrylonitrile Industry, Middle East, Capacity by Key Countries (mtpa), 2018-2028
- Table 42: Acrylonitrile Industry, Middle East, New Build and Expansion Capital Expenditure Outlook for Planned and Announced Projects ($M), 2024-2028
- Table 43: Acrylonitrile Industry, Middle East, New Build and Expansion Capital Expenditure Outlook for Planned and Announced Projects by Countries ($M), 2024-2028
- Table 44: Acrylonitrile Industry, Turkey, Capacity by Major Plants (mtpa) 2018-2028
- Table 45: Acrylonitrile Industry, Saudi Arabia, Capacity by Major Plants (mtpa) 2018-2028
- Table 46: Acrylonitrile Industry, North America, key statistics, 2023
- Table 47: Acrylonitrile Industry, North America, Capacity by Key Countries (mtpa), 2018-2028
- Table 48: Acrylonitrile Industry, US, Capacity by Major Plants (mtpa) 2018-2028
- Table 49: Acrylonitrile Industry, South America, key statistics, 2023
- Table 50: Acrylonitrile Industry, South America, Capacity by Key Countries (mtpa), 2018-2028
- Table 51: Acrylonitrile Industry, Brazil, Capacity by Major Plants (mtpa) 2018-2028
List of Figures
- Figure 1: Global Acrylonitrile Industry, Capacity Share vis-a-vis Growth by Key Countries, 2018-2023
- Figure 2: Acrylonitrile Industry, global, capacity by region (mtpa), 2023-2028
- Figure 3: Acrylonitrile Industry, global, capacity share of top 10 companies (%), 2023
- Figure 4: Acrylonitrile Industry, global, active capacity of top 10 countries (mtpa), 2023
- Figure 5: Global, Acrylonitrile Industry, Installed Plant Capacity by Production Process (%) 2023
- Figure 6: Acrylonitrile Industry, global, planned and announced capacity additions by region (mtpa), 2028
- Figure 7: Acrylonitrile Industry, global, planned and announced Capacity Additions by Top 10 countries (mtpa), 2028
- Figure 8: Acrylonitrile Industry, global, planned and announced Capacity Additions by Top 10 companies (mtpa), 2028
- Figure 9: Acrylonitrile Industry, Total Capex Spending on Planned and Announced Projects by Region ($ mil), 2024-2028
- Figure 10: Acrylonitrile Industry, Total Capex Spending on Planned and Announced Projects by Countries ($ mil), 2024-2028
- Figure 11: Acrylonitrile Industry, Asia, Capacity Share vis-a-vis Growth by Key Countries, 2018-2023
- Figure 12: Asia, Acrylonitrile Industry, Installed Plant Capacity by Production Process (%) 2023
- Figure 13: Acrylonitrile Industry, Asia, New Build and Expansion Capital Expenditure Outlook for Planned and Announced Projects ($B), 2024-2028
- Figure 14: Acrylonitrile Industry, Asia, New Build and Expansion Capital Expenditure Outlook for Planned and Announced Projects by Countries ($B), 2024-2028
- Figure 15: Acrylonitrile Industry, Europe, Capacity Share vis-a-vis Growth by Key Countries, 2018-2023
- Figure 16: Europe, Acrylonitrile Industry, Installed Plant Capacity by Production Process (%) 2023
- Figure 17: Acrylonitrile Industry, FSU, Capacity Share vis-a-vis Growth by Key Countries, 2018-2023
- Figure 18: Acrylonitrile Industry, FSU, New Build and Expansion Capital Expenditure Outlook for Planned and Announced Projects ($M), 2024-2028
- Figure 19: Acrylonitrile Industry, FSU, New Build and Expansion Capital Expenditure Outlook for Planned and Announced Projects by Countries ($M), 2024-2028
- Figure 20: Acrylonitrile Industry, Middle East, Capacity Share vis-a-vis Growth by Key Countries, 2018-2023
- Figure 21: Acrylonitrile Industry, Middle East, New Build and Expansion Capital Expenditure Outlook for Planned and Announced Projects ($M), 2024-2028
- Figure 22: Acrylonitrile Industry, Middle East, New Build and Expansion Capital Expenditure Outlook for Planned and Announced Projects by Countries ($M), 2024-2028
- Figure 23: Acrylonitrile Industry, North America, Capacity Share vis-a-vis Growth by Key Countries, 2018-2023
- Figure 24: Acrylonitrile Industry, South America, Capacity Share vis-a-vis Growth by Key Countries, 2018-2023
Global Acrylonitrile capacity is poised to see considerable growth over the next five years, potentially increasing from 9.55 mtpa in 2023 to 12.25 mtpa in 2028, registering total growth of 28%.
Around 13 planned and announced Acrylonitrile projects are expected to come online in Asia, Middle East and FSU over the upcoming years. Among countries, China is expected to lead Acrylonitrile capacity additions by 2027, followed by Saudi Arabia. INEOS Ltd, Zhejiang Rongsheng Holding Group Co Ltd and Sasa Polyester Sanayi AS are the top three companies by planned and announced capacity additions globally over the upcoming years.
Scope
Global Acrylonitrile capacity outlook by region
Global Acrylonitrile outlook by country
Acrylonitrile planned and announced projects details
Capacity share of the major Acrylonitrile producers globally
Global Acrylonitrile capital expenditure outlook by region
Global Acrylonitrile capital expenditure outlook by country
Reasons to Buy
Obtain the most up to date information available on all active, planned, and announced Acrylonitrile plants globally
Identify opportunities in the global Acrylonitrile industry with the help of upcoming projects and capital expenditure outlook
Facilitate decision making on the basis of strong historical and forecast of Acrylonitrile capacity data
Table of Contents
Table of Contents
1. Introduction
- What is This Report About?
- Market Definition
2. Global Acrylonitrile Capacity and Capital Expenditure Review
- 2.1 Global Acrylonitrile Industry, An Overview
- 2.2 Global Acrylonitrile Industry, Capacity by key countries, 2018-2028
- 2.3 Global Acrylonitrile Industry, Capacity Share vis-a-vis Growth by Key Countries, 2018-2023
- 2.4 Global Acrylonitrile Industry, Top 10 Planned and Announced Projects
- 2.5 Global Acrylonitrile Industry, Capacity contribution by region
- 2.6 Key Companies by Acrylonitrile Capacity Contribution (% Share), 2022
- 2.7 Key Countries by Active Global Capacity Contribution to Acrylonitrile Industry
- 2.8 Global Acrylonitrile Industry, Installed Plant Capacity by Production Process, 2023
- 2.9 Regional Capacity Additions from Planned and Announced Projects
- 2.10 Global Capacity Additions from Planned and Announced Projects by Top 10 Countries
- 2.11 Global Capacity Additions from Planned and Announced Projects by Top 10 Companies
- 2.12 Regional Capex Spending on Planned and Announced Projects
- 2.13 Global Capex Spending on Planned and Announced Projects by countries
3. Global Planned and Announced Acrylonitrile Projects
4. Asia Acrylonitrile Industry
- 4.1 Asia Acrylonitrile Industry, An Overview
- 4.2 Asia Acrylonitrile Industry, Capacity by Key Countries, 2018-2028
- 4.3 Asia Acrylonitrile Industry, Capacity Share vis-a-vis Growth by Key Countries, 2018-2023
- 4.4 Asia Acrylonitrile Industry, Installed Plant Capacity by Production Process, 2023
- 4.5 Asia Acrylonitrile Industry, New Build and Expansion Capital Expenditure Outlook for Planned and Announced Projects
- 4.6 Asia Acrylonitrile Industry, New Build and Expansion Capital Expenditure Outlook for Planned and Announced Projects by countries
- 4.7 Acrylonitrile Industry in China
- 4.8 Acrylonitrile Industry, South Korea
- 4.9 Acrylonitrile Industry, Japan
- 4.10 Acrylonitrile Industry, Taiwan
- 4.11 Acrylonitrile Industry, Thailand
5. Europe Acrylonitrile Industry
- 5.1 Europe Acrylonitrile Industry, An Overview
- 5.2 Europe Acrylonitrile Industry, Capacity by Key Countries, 2018-2028
- 5.3 Europe Acrylonitrile Industry, Capacity Share vis-a-vis Growth by Key Countries, 2018-2023
- 5.4 Europe Acrylonitrile Industry, Installed Plant Capacity by Production Process, 2022
- 5.5 Acrylonitrile Industry, Germany
- 5.6 Acrylonitrile Industry, Netherlands
- 5.7 Acrylonitrile Industry, Romania
- 5.8 Acrylonitrile Industry, United Kingdom
6. Former Soviet Union (FSU) Acrylonitrile Industry
- 6.1 FSU Acrylonitrile Industry, An Overview
- 6.2 FSU Acrylonitrile Industry, Capacity by Key Countries, 2018-2028
- 6.3 FSU Acrylonitrile Industry, Capacity Share vis-a-vis Growth by Key Countries, 2018-2023
- 6.4 FSU Acrylonitrile Industry, Installed Plant Capacity by Production Process, 2023
- 6.5 FSU Acrylonitrile Industry, New Build and Expansion Capital Expenditure Outlook for Planned and Announced Projects
- 6.6 FSU Acrylonitrile Industry, New Build and Expansion Capital Expenditure Outlook for Planned and Announced Projects by countries
- 6.7 Acrylonitrile Industry, Russia
- 6.8 Acrylonitrile Industry, Belarus
7. Middle East Acrylonitrile Industry
- 7.1 Middle East Acrylonitrile Industry, An Overview
- 7.2 Middle East Acrylonitrile Industry, Capacity by Key Countries, 2017-2027
- 7.3 Middle East Acrylonitrile Industry, Capacity Share vis-a-vis Growth by Key Countries, 2018-2023
- 7.4 Middle East Acrylonitrile Industry, Installed Plant Capacity by Production Process, 2022
- 7.5 Middle East Acrylonitrile Industry, New Build and Expansion Capital Expenditure Outlook for Planned and Announced Projects
- 7.6 Middle East Acrylonitrile Industry, New Build and Expansion Capital Expenditure Outlook for Planned and Announced Projects by countries
- 7.7 Acrylonitrile Industry, Turkey
- 7.8 Acrylonitrile Industry, Saudi Arabia
8. North America Acrylonitrile Industry
- 8.1 North America Acrylonitrile Industry, An Overview
- 8.2 North America Acrylonitrile Industry, Capacity by Key Countries, 2018-2028
- 8.3 North America Acrylonitrile Industry, Capacity Share vis-a-vis Growth by Key Countries, 2018-2023
- 8.4 North America Acrylonitrile Industry, Installed Plant Capacity by Production Process, 2023
- 8.5 Acrylonitrile Industry, United States
9. South America Acrylonitrile Industry
- 9.1 South America Acrylonitrile Industry, An Overview
- 9.2 South America Acrylonitrile Industry, Capacity by Key Countries, 2018-2028
- 9.3 South America Acrylonitrile Industry, Capacity Share vis-a-vis Growth by Key Countries, 2018-2023
- 9.4 South America Acrylonitrile Industry, Installed Plant Capacity by Production Process, 2023
- 9.5 Acrylonitrile Industry, Brazil
10. Appendix
- 10.1 Definitions
- 10.2 Abbreviations
- 10.3 Status Definition
- 10.4 Methodology
- Contact Us