|
|
市場調査レポート
商品コード
1388252
ベビーフードの日本市場の規模とシェア:カテゴリ別、流通、予測(~2028年)Japan Baby Food Market Size and Share by Categories, Distribution and Forecast to 2028 |
||||||
|
|
|||||||
カスタマイズ可能
適宜更新あり
|
|||||||


| ベビーフードの日本市場の規模とシェア:カテゴリ別、流通、予測(~2028年) |
|
出版日: 2023年10月24日
発行: GlobalData
ページ情報: 英文 131 Pages
納期: 即納可能
|

- 全表示
- 概要
- 図表
- 目次
日本の出生数は2016年~2022年に21.1%減少し、2022年に77万700人に達しました。これにより2022年のベビー人口は240万人となっています。2022年の日本のGDPは、経済活動の回復により1%成長しましたが、消費者物価インフレは2.5%でした。金額ベースの売上は近年減少しており、2016年~2022年のCAGRは-1.3%でした。数量ベースでは、2016年~2022年のCAGRは2%で、2022年の売上は減少しました。ベビーミルクは依然として金額ベースでベビーフード部門の55%以上を占める最大のカテゴリであり、ベビーウェットミール・その他がこれに続きます。Asahi Group HoldingsとMeiji Holdings Companyが2022年の上位2社でした。ハイパーマーケットとスーパーマーケットが引き続き主な流通チャネルで、2022年の売上金額全体の45%以上を占めています。GlobalDataは、日本の出生数は予測期間に減少すると推定しています。同国のベビーフード市場は2022年~2028年に金額ベースで増加し、CAGRで0.9%の成長が予測されます。
調査範囲
- ベビーミルクの売上金額は2016年の663億円(6億920万米ドル)から2022年に556億円(4億2,410万米ドル)に減少し、この間のCAGRは-2.9%を示しました。
- ベビーシリアル・ドライミールの数量は、2016年の36万kgから2022年に50万kgに増加し、CAGRは5.6%でした。
- ベビーウェットミール・その他のカテゴリの売上金額は、2016年の211億円(1億9,380万米ドル)から2022年に239億円(1億8,230万米ドル)に増加し、CAGRは2.1%でした。
- 2016年~2022年に、ベビーフィンガーフードのPCCは2.5%成長しました。
- 2016年~2022年に、ベビードリンクのPCCは3.8%成長しました。
当レポートでは、日本のベビーフード市場について調査分析し、現在と将来の市場動向、市場規模、企業プロファイル、主要小売業者と流通チャネルなどの情報を提供しています。
目次
- エグゼクティブサマリー
第1章 市場環境
- 金額と数量の成長分析:地域別
- その他のアジア太平洋の主要国と比較した日本の成長分析
- 世界/アジア太平洋市場と比較した日本のPCCとPCE
第2章 背景
- 出生数
- 消費者
- 社会人口学的動向
- 働く女性
- 母乳育児の動向
- 規制
第3章 概要
- 日本のベビーフード産業のスナップショット
- 市場規模分析
- メーカーシェア
第4章 カテゴリ分析
- ベビーミルク
- ベビーシリアル・ドライミール
- ベビーウェットミール・その他
- ベビーフィンガーフード
- ベビードリンク
第5章 生産と貿易
- 輸入
- 輸出
第6章 流通
- チャネルシェア分析
- ベビーフード小売
第7章 経済的背景
- GDP成長とインフレ
第8章 見通しと予測
- 将来の動向
第9章 定義
第10章 付録
List of Tables
List of Tables
- Birth & population trends, 2009-28
- Reasons couples do not have their ideal number of children, 2015
- Live births and crude birth rate by region, 2014, 2017-19
- Live births by region, 2015-22
- Expenditure on food by income group, 2019
- Use of commercial baby food, 1985, 1995, and 2005
- Attitudes to commercial baby food, 2005
- Concern about food allergies, 2009
- Proportion of babies with allergies, 1999, 2004, 2009, and 2014
- Consumption of sugary drinks and/or sweet snacks, 2015
- Age of introduction of baby food, 2005 and 2015
- Births by age of mothers, 1990, 2000, 2013, and 2015-19
- Number of women of childbearing age by age group, 2009-21
- Working women, 2013-22
- Working women of childbearing age by age group, 2020
- Mothers' working patterns, 2010
- Trends in mothers' employment practices at marriage and first pregnancy, 1985-89 and 2000-14
- Breastfeeding trends by age of baby, 2005, 2010, and 2015
- Age when stopping use of follow-on/growing up milk, 2005 and 2015
- Age when stopping use of infant formula, 2005 and 2015
- Breastfeeding at three months, by mothers' employment status, 2005 and 2015
- Leading categories (value), 2022
- Leading categories (volume), 2022
- Baby food: manufacturer shares, value & volume %, 2016-22
- Baby food: manufacturer shares by category, %, 2022
- Baby milks: SKUs by pack type, 2022
- Baby milks: SKUs by pack size, 2022
- Baby milks: brand price positioning analysis, 2022
- Baby milks: manufacturer & brand shares, value and volume%, 2016-22
- Baby milks: manufacturer & brand shares, value %, 2016-22
- Baby milks: manufacturer & brand shares, volume %, 2016-22
- Baby cereals & dry meals: SKUs by pack type, 2022
- Baby cereals & dry meals: SKUs by pack size, 2022
- Baby cereals & dry meals: brand price positioning analysis, 2022
- Baby cereals & dry meals: manufacturer & brand shares, value and volume%, 2016-22
- Baby cereals & dry meals: manufacturer & brand shares, value %, 2016-22
- Baby cereals & dry meals: manufacturer & brand shares, volume %, 2016-22
- Baby wet meals & other: SKUs by pack type, 2022
- Baby wet meals & other: SKUs by pack size, 2022
- Baby wet meals & other: brand price positioning analysis, 2022
- Baby wet meals & other: manufacturer & brand shares, value and volume%, 2016-22
- Baby wet meals & other: manufacturer & brand shares, value %, 2016-22
- Baby wet meals & other: manufacturer & brand shares, volume %, 2016-22
- Baby finger food: SKUs by pack type, 2022
- Baby finger food: SKUs by pack size, 2022
- Baby finger food: brand price positioning analysis, 2022
- Baby finger food: manufacturer & brand shares, value and volume%, 2016-22
- Baby finger food: manufacturer & brand shares, value %, 2016-22
- Baby finger food: manufacturer & brand shares, volume %, 2016-22
- Baby drinks: SKUs by pack type, 2022
- Baby drinks: SKUs by pack size, 2022
- Baby drinks: brand price positioning analysis, 2022
- Baby drinks: manufacturer & brand shares, value and volume%, 2016-22
- Baby drinks: manufacturer & brand shares, value %, 2016-22
- Baby drinks: manufacturer & brand shares, volume %, 2016-22
- Baby milks & cereals: trends in imports, 2015-22
- Imports of baby milks & cereals by country of origin, 2020-22
- Other baby food: trends in imports, 2015-22
- Imports of other baby food by country of origin, 2020-22
- Baby milks & cereals: trends in exports, 2015-22
- Exports of baby milks & cereals by country of destination, 2020-22
- Other baby food: trends in exports, 2015-22
- Exports of other baby food by country of destination, 2020-22
- Change in distribution share, 2016-22
- Baby food: sales by outlet type, % value, 2016-22
- Baby food: sales by type of food & outlet type, % value, 2022
- Category definitions
- Terminology definitions
- Baby population, number of babies ('000), 2009-28
- Baby food: market value, current prices ($ million), 2016-22
- Baby food: market value, constant prices, 2016-22
- Baby food: market volume, million kg, 2016-22
- Baby food: PCE, current prices ($), 2016-22
- Baby food: PCE, constant prices, 2016-22
- Baby food: PCC, kg, 2016-22
- Baby milks: category segmentation, value & volume, 2016-22
- Baby food: market value forecasts, current prices ($ million), 2022-28
- Baby food: market value forecasts, constant prices, 2022-28
- Baby food: market volume forecasts, million kg, 2022-28
- Baby food: PCE forecasts, current prices ($), 2022-28
- Baby food: PCE forecasts, constant prices, 2022-28
- Baby food: PCC forecasts, kg, 2022-28
- Exchange rates: LCU per $, 2016-22
- Exchange rates: LCU per $, 2023-28
- SKUs allocation by product type
List of Figures
List of Figures
- Japan's value and volume shares in the global and Asia-Pacific baby food sectors, 2022-27
- Japan compared with the other leading countries in terms of market share, growth, and competitive landscape
- PCC comparison - Japan, Asia Pacific, and global, 2017-27
- PCE comparison - Japan, Asia Pacific, and global, 2017-27
- Japan: In light of the rising cost of living, how have your shopping habits changed for baby care and child care products?
- Japan: How would you describe your spend on the following products in the last three months? For "baby food", for "baby milk"
- Japan: Which of the following features do you actively look for when making a purchase?
- Baby food: sector size (value), 2016-22
- Baby food: sector size (volume), 2016-22
- Market size and growth analysis by value and volume, baby food sector, 2016-28
- Baby food: manufacturer shares, value %, 2022
- Baby food: manufacturer shares, volume %, 2022
- Baby food: manufacturer shares by category, % value, 2022
- Market size and growth analysis by value and volume, baby milks category, 2016-28
- Baby milks: PCE & PCC, 2016-22
- Baby milks: PCE & PCC by age group, 2016-22
- Baby milks: segmentation, value, and volume, 2016-22
- Market size and growth analysis by value and volume, baby cereals & dry meals category, 2016-28
- Baby cereals & dry meals: PCE & PCC, 2016-22
- Market size and growth analysis by value and volume, baby wet meals & other category, 2016-28
- Baby wet meals & other: PCE & PCC, 2016-22
- Market size and growth analysis by value and volume, baby finger food category, 2016-28
- Baby cereals & dry meals: PCE & PCC, 2016-22
- Market size and growth analysis by value and volume, baby drinks category, 2016-28
- Baby wet meals & other: PCE & PCC, 2016-22
- Share of key distribution channels (in value terms) baby food, 2022
- Key distribution channel share by category (in value terms), 2022
- GDP at current prices (JPY trillion)
- Real GDP growth rate (%)
- Consumer price inflation (%)
- Unemployment rate (%)
Abstract
"Japan Baby Food Market Size and Share by Categories, Distribution and Forecast to 2028" is an analytical report by GlobalData which provides extensive and highly detailed current and future market trends in the Japanese market.
The number of live births in Japan declined by 21.1% during 2016-22, reaching 770,700 in 2022. This resulted in a baby population of 2.4 million in 2022. The GDP of Japan grew by 1% in 2022, owing to the recovering economic activity, while consumer price inflation stood at 2.5%. Overall sales in value terms have decreased in recent years with the sector registering a negative CAGR of 1.3% during 2016-22. In volume terms, sales contracted in 2022 declining at a CAGR of 2% during 2016-22. Baby milks remained the largest category in value terms with over 55% of the baby food sector, followed by baby wet meals & other. Asahi Group Holdings and Meiji Holdings Company were the top two companies in 2022. Hypermarkets & supermarkets remained the leading distribution channel, accounting for over 45% of overall value sales in 2022. GlobalData estimates that the number of live births will decrease over the forecast period in Japan. The market for baby food in the country is expected to increase in value terms during 2022-28, registering a CAGR of 0.9%.
What else does this report offer?
- Consumption data based upon a unique combination of industry research, fieldwork, market sizing work and our in-house expertise to offer extensive data about the trends and dynamics affecting the industry.
- Detailed profile of the companies operating and new companies considering entry in the industry along with their key focus product sectors.
- Market profile of the various product sectors with the key features & developments, segmentation, per capita trends and the various manufacturers & brands.
- Overview of baby food retailing with a mention of the major retailers in the country along with the distribution channel.
- Future projections considering various trends which are likely to affect the industry.
Scope
- Value sales of baby milks decreased from JPY66.3 billion ($609.2 million) in 2016 to JPY55.6 billion ($424.1 million) in 2022, registering a negative CAGR of 2.9% during this period.
- Baby cereals & dry meals volumes increased from 0.36 million kg in 2016 to 0.5 million kg in 2022, at a CAGR of 5.6%.
- Value sales of the baby wet meals & other category rose from JPY21.1 billion ($193.8 million) in 2016 to JPY23.9 billion ($182.3 million) in 2022, at a CAGR of 2.1%.
- During 2016-22, PCC of baby finger food grew by 2.5%.
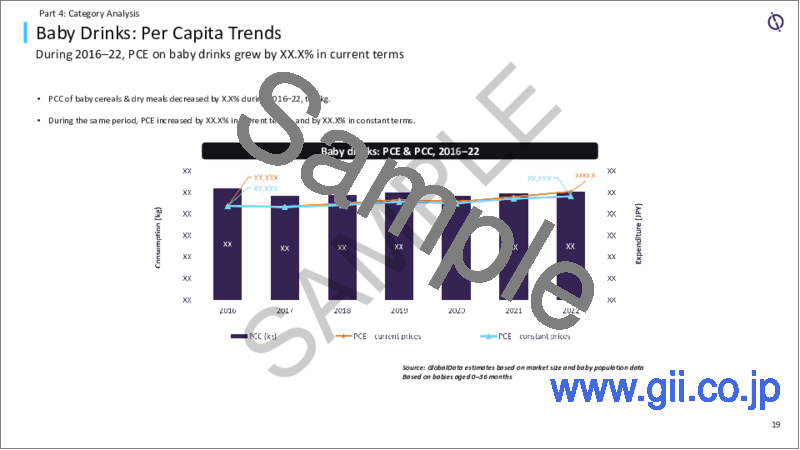
- During 2016-22, PCC of baby drinks grew by 3.8%.
Reasons to Buy
- Evaluate important changes in consumer behavior and identify profitable markets and areas for product innovation.
- Analyse current and forecast behavior trends in each category to identify the best opportunities to exploit.
- Detailed understanding of consumption by individual product categories in order to align your sales and marketing efforts with the latest trends in the market.
- Investigates which categories are performing the best and how this is changing market dynamics.
Table of Contents
Table of Contents
- Executive Summary
Part 1: Market Environment
- Value and Volume Growth Analysis by Region
- Growth Analysis of Japan Compared with Other Leading Countries in Asia-Pacific
- PCC and PCE of Japan Compared with Global and Asia-Pacific Markets
Part 2: Background
- Births
- The Consumer
- Sociodemographic Trends
- Working Women
- Breastfeeding Trends
- Regulations
Part 3: Overview
- Japan Baby Food Sector Snapshot
- Market Size Analysis
- Manufacturer Shares
Part 4: Category Analysis
- Baby Milks
- Baby Cereals & Dry Meals
- Baby Wet Meals & Other
- Baby Finger Food
- Baby Drinks
Part 5: Production and Trade
- Imports
- Exports
Part 6: Distribution
- Channel Share Analysis
- Baby Food Retailing
Part 7: Economic Background
- GDP Growth and Inflation
Part 8: Prospects and Forecasts
- Future Trends
Part 9: Definitions
Part 10: Appendix
- Methodology
- About GlobalData
