|
|
市場調査レポート
商品コード
1384421
フェノール産業の生産能力と設備投資の予測、稼動中・計画済みプラントの詳細(~2027年)Phenol Industry Capacity and Capital Expenditure Forecasts with Details of Active and Planned Plants to 2027 |
||||||
|
|
|||||||
カスタマイズ可能
適宜更新あり
|
|||||||


| フェノール産業の生産能力と設備投資の予測、稼動中・計画済みプラントの詳細(~2027年) |
|
出版日: 2023年10月31日
発行: GlobalData
ページ情報: 英文 108 Pages
納期: 即納可能
|

- 全表示
- 概要
- 図表
- 目次
世界のフェノール生産能力は、今後5年間にかなりの成長を示す見込みであり、2022年の年間1,565万トンから2027年に年間1,862万トンに達し、合計19%の成長を記録する可能性があります。
今後数年間において、アジアと北米で約10のフェノールプロジェクトが計画・発表されています。国別では、インドが2027年までフェノールの生産能力増強をリードし、中国と韓国がこれに続くと予測されます。Zhejiang Rongsheng Holding Group Co Ltd、INEOS Ltd、Shandong Yulong Petrochemical Ltdが、今後数年間における世界の計画・発表済み生産能力増強の上位3社です。
当レポートでは、世界のフェノール産業について調査分析し、各地域の生産能力と設備投資の予測や、計画・発表済みプラントの詳細情報などを提供しています。
目次
第1章 イントロダクション
第2章 世界のフェノール生産能力と設備投資のレビュー
- 世界のフェノール産業、概要
- 世界のフェノール産業、生産能力:主要国別
- 世界のフェノール産業、成長に対する生産能力シェア:主要国別(2017年~2022年)
- 世界のフェノール産業、上位10件の計画・発表済みプロジェクト
- 世界のフェノール産業、生産能力寄与率:地域別
- 主要企業:フェノール生産能力寄与率別(2022年)
- 主要国:世界のフェノール産業への生産能力寄与率別
- 世界のフェノール産業、プラントの設備容量:生産プロセス別(2022年)
- 世界のフェノール産業、プラントの設備容量:技術別(2022年)
- 地域の計画・発表済みプロジェクトによる生産能力増強
- 世界の計画・発表済みプロジェクトによる生産能力増強:上位10ヶ国別
- 世界の計画・発表済みプロジェクトによる生産能力増強:上位10社別
- 地域の計画・発表済みプロジェクトに対する設備投資支出
- 世界の計画・発表済みプロジェクトに対する設備投資支出:国別
第3章 世界の計画・発表済みフェノールプロジェクト
第4章 アジアのフェノール産業
- アジアのフェノール産業、概要
- アジアのフェノール産業、生産能力:主要国別(2017年~2027年)
- アジアのフェノール産業、成長に対する生産能力シェア:主要国別(2017年~2022年)
- アジアのフェノール産業、プラントの設備容量:生産プロセス別(2022年)
- アジアのフェノール産業、プラントの設備容量:技術別(2022年)
- アジアのフェノール産業、計画・発表済みプロジェクトの新設と拡張設備投資の見通し
- アジアのフェノール産業、計画・発表済みプロジェクトの新設と拡張設備投資の見通し:国別
- フェノール産業、中国
- フェノール産業、韓国
- フェノール産業、台湾
- フェノール産業、日本
- フェノール産業、タイ
- フェノール産業、シンガポール
- フェノール産業、インド
第5章 北米のフェノール産業
- 北米のフェノール産業、概要
- 北米のフェノール産業、生産能力:主要国別(2017年~2027年)
- 北米のフェノール産業、成長に対する生産能力シェア:主要国別(2017年~2022年)
- 北米のフェノール産業、プラントの設備容量:生産プロセス別(2022年)
- 北米のフェノール産業、プラントの設備容量、技術別(2022年)
- 北米のフェノール産業、計画・発表済みプロジェクトの新設と拡張設備投資の見通し
- 北米のフェノール産業、計画・発表済みプロジェクトの新設と拡張設備投資の見通し:国別
- フェノール産業、米国
第6章 欧州のフェノール産業
- 欧州のフェノール産業、概要
- 欧州のフェノール産業、生産能力:主要国別(2017年~2027年)
- 欧州のフェノール産業、成長に対する生産能力シェア:主要国別(2017年~2022年)
- 欧州のフェノール産業、プラントの設備容量:生産プロセス別(2022年)
- フェノール産業、ドイツ
- フェノール産業、ベルギー
- フェノール産業、スペイン
- フェノール産業、イタリア
- フェノール産業、フィンランド
- フェノール産業、フランス
- フェノール産業、ポーランド
第7章 南米のフェノール産業
- 南米のフェノール産業、概要
- 南米のフェノール産業、生産能力:主要国別(2017年~2027年)
- 南米のフェノール産業、成長に対する生産能力シェア:主要国別(2017年~2022年)
- 南米のフェノール産業、プラントの設備容量:生産プロセス別(2022年)
- 南米のフェノール産業、プラントの設備容量:技術別(2022年)
- フェノール産業、ブラジル
第8章 旧ソ連(FSU)のフェノール産業
- FSUのフェノール産業の概要
- FSUのフェノール産業、生産能力:主要国別(2017年~2027年)
- FSUのフェノール産業、成長に対する生産能力シェア:主要国別(2017年~2022年)
- FSUのフェノール産業、プラントの設備容量:生産プロセス別(2022年)
- フェノール産業、ロシア
第9章 中東のフェノール産業
- 中東のフェノール産業、概要
- 中東のフェノール産業、生産能力:主要国別(2017年~2027年)
- 中東のフェノール産業、成長に対する生産能力シェア:主要国別(2017年~2022年)
- 中東のフェノール産業、プラントの設備容量:生産プロセス別(2022年)
- 中東のフェノール産業、プラントの設備容量:技術別(2022年)
- フェノール産業、サウジアラビア
第10章 アフリカのフェノール産業
- アフリカのフェノール産業、概要
- アフリカのフェノール産業、生産能力:主要国別(2017年~2027年)
- アフリカのフェノール産業、成長に対する生産能力シェア:主要国別(2017年~2022年)
- アフリカのフェノール産業、プラントの設備容量:生産プロセス別(2022年)
- アフリカのフェノール産業、プラントの設備容量:技術別(2022年)
- フェノール産業、南アフリカ
第11章 付録
List of Tables
List of Tables
- Table 1: Phenol Industry, Global, key statistics, 2022
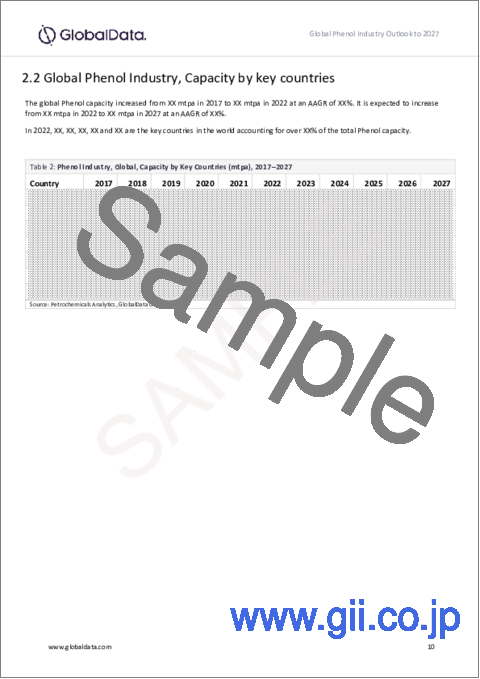
- Table 2: Phenol Industry, Global, Capacity by Key Countries (mtpa), 2017-2027
- Table 3: Phenol Industry, Global, Top 10 Planned and Announced Projects Details, 2023-2027
- Table 4: Phenol Industry, Global, capacity by region (mtpa), 2022-2027
- Table 5: Phenol Industry, global, capacity share of top 10 Companies (%), 2022
- Table 6: Phenol Industry, global, active Capacity of Top 10 Countries (mtpa), 2022
- Table 7: Global, Phenol Industry, Installed Plant Capacity by Production Process (%) 2022
- Table 8: Global Phenol Industry, Installed Plant Capacity by Cumene Peroxidation process, 2022
- Table 9: Global Phenol Industry, Installed Plant Capacity by Phenosolvan process, 2022
- Table 10: Global, Phenol Industry, Installed Plant Capacity by Technology (%) 2022
- Table 11: Global, Phenol Industry, Installed Plant Capacity by KBR Phenol Technology, 2022
- Table 12: Global, Phenol Industry, Installed Plant Capacity by Honeywell UOP Phenol Technology, 2022
- Table 13: Global, Phenol Industry, Installed Plant Capacity by IILA Phenol Technology, 2022
- Table 14: Global Phenol Industry, Installed Plant Capacity by INEOS Phenol Technology, 2022
- Table 15: Global Phenol Industry, Installed Plant Capacity by Mitsui Phenol Technology, 2022
- Table 16: Propylene Industry, global, planned and announced capacity additions by region (mtpa), 2027
- Table 17: Phenol Industry, global, planned and announced capacity additions by top 10 countries (mtpa), 2027
- Table 18: Phenol Industry, global, planned and announced capacity additions by Top 10 Companies (mtpa), 2027
- Table 19: Phenol Industry, Global, Total Capex Spending on Planned and Announced Projects by Region ($ bil), 2023-2027
- Table 20: Phenol Industry, Global, Total Capex Spending on Planned and Announced Projects by Countries ($ bil), 2023-2027
- Table 21: Global, planned and announced Phenol projects details
- Table 22: Phenol Industry, Asia, key statistics, 2022
- Table 23: Phenol Industry, Asia, Capacity by Key Countries (mtpa), 2017-2027
- Table 24: Asia, Phenol Industry, Installed Plant Capacity by Production Process (%) 2022
- Table 25: Asia Phenol Industry, Installed Plant Capacity by Cumene Peroxidation process, 2022
- Table 26: Asia, Phenol Industry, Installed Plant Capacity by Technology (%) 2022
- Table 27: Asia, Phenol Industry, Installed Plant Capacity by Honeywell UOP Phenol Technology, 2022
- Table 28: Asia, Phenol Industry, Installed Plant Capacity by KBR Phenol Technology, 2022
- Table 29: Asia, Phenol Industry, Installed Plant Capacity by Mitsui Phenol Technology, 2022
- Table 30: Asia, Phenol Industry, Installed Plant Capacity by IILA/Lummus Phenol Technology, 2022
- Table 31: North America, Phenol Industry, Installed Plant Capacity by Versalis/Lummus Phenol Technology, 2022
- Table 32: Phenol Industry, Asia, New Build and Expansion Capital Expenditure Outlook for Planned and Announced Projects ($B), 2023-2027
- Table 33: Phenol Industry, Asia, New Build and Expansion Capital Expenditure Outlook for Planned and Announced Projects by Countries ($B), 2023-2027
- Table 34: Phenol Industry, China, Capacity by Major Plants (mtpa) 2017-2027
- Table 35: Phenol Industry, South Korea, Capacity by Major Plants (mtpa) 2017-2027
- Table 36: Phenol Industry, Taiwan, Capacity by Major Plants (mtpa) 2017-2027
- Table 37: Phenol Industry, Japan, Capacity by Major Plants (mtpa) 2017-2027
- Table 38: Phenol Industry, Thailand, Capacity by Major Plants (mtpa) 2017-2027
- Table 39: Phenol Industry, Singapore, Capacity by Major Plants (mtpa) 2017-2027
- Table 40: Phenol Industry, India, Capacity by Major Plants (mtpa) 2017-2027
- Table 41: Phenol Industry, North America, key statistics, 2022
- Table 42: Phenol Industry, North America, Capacity by Key Countries (mtpa), 2017-2027
- Table 43: North America, Phenol Industry, Installed Plant Capacity by Production Process (%) 2022
- Table 44: North America Phenol Industry, Installed Plant Capacity by Cumene Peroxidation process, 2022
- Table 45: North America Phenol Industry, Installed Plant Capacity by Phenosolvan process, 2022
- Table 46: North America, Phenol Industry, Installed Plant Capacity by Technology(%) 2022
- Table 47: North America, Phenol Industry, Installed Plant Capacity by IILA Phenol Technology, 2022
- Table 48: North America, Phenol Industry, Installed Plant Capacity by KBR Phenol Technology, 2022
- Table 49: North America, Phenol Industry, Installed Plant Capacity by Honeywell UOP Phenol Technology, 2022
- Table 50: North America, Phenol Industry, Installed Plant Capacity by Lurgi Phenol Technology, 2022
- Table 51: Phenol Industry, North America, New Build and Expansion Capital Expenditure Outlook for Planned and Announced Projects ($B), 2023-2027
- Table 52: Phenol Industry, North America, New Build and Expansion Capital Expenditure Outlook for Planned and Announced Projects by Countries ($B), 2023-2027
- Table 53: Phenol Industry, the US, Capacity by Major Plants (mtpa) 2017-2027
- Table 54: Phenol Industry, Europe, key statistics, 2022
- Table 55: Phenol Industry, Europe, Capacity by Key Countries (mtpa), 2017-2027
- Table 56: Phenol Industry, Germany, Capacity by Major Plants (mtpa) 2017-2027
- Table 57: Phenol Industry, Belgium, Capacity by Major Plants (mtpa) 2017-2027
- Table 58: Phenol Industry, Spain, Capacity by Major Plants (mtpa) 2017-2027
- Table 59: Phenol Industry, Italy, Capacity by Major Plants (mtpa) 2017-2027
- Table 60: Phenol Industry, Finland, Capacity by Major Plants (mtpa) 2017-2027
- Table 61: Phenol Industry, France, Capacity by Major Plants (mtpa) 2017-2027
- Table 62: Phenol Industry, Poland, Capacity by Major Plants (mtpa) 2017-2027
- Table 63: Phenol Industry, South America, key statistics, 2022
- Table 64: Phenol Industry, South America, Capacity by Key Countries (mtpa), 2017-2027
- Table 65: South America, Phenol Industry, Installed Plant Capacity by Technology (%) 2022
- Table 66: South America, Phenol Industry, Installed Plant Capacity by KBR Phenol Technology, 2022
- Table 67: Phenol Industry, Brazil, Capacity by Major Plants (mtpa) 2017-2027
- Table 68: Phenol Industry, FSU, key statistics, 2022
- Table 69: Phenol Industry, FSU, Capacity by Key Countries (mtpa), 2017-2027
- Table 70: Phenol Industry, Russia, Capacity by Major Plants (mtpa) 2017-2027
- Table 71: Phenol Industry, Middle East, key statistics, 2022
- Table 72: Phenol Industry, Middle East, Capacity by Key Countries (mtpa), 2017-2027
- Table 73: Phenol Industry, Saudi Arabia, Capacity by Major Plants (mtpa) 2017-2027
- Table 74: Phenol Industry, Africa, key statistics, 2022
- Table 75: Phenol industry, Africa, Capacity by Key Countries (mtpa), 2017-2027
- Table 76: Phenol Industry, South Africa, Capacity by Major Plants (mtpa) 2017-2027
List of Figures
List of Figures
- Figure 1: Global Phenol Industry, Capacity Share vis-a-vis Growth by Key Countries, 2017-2022
- Figure 2: Phenol Industry, global, capacity by region (mtpa), 2022-2027
- Figure 3: Phenol Industry, global, capacity share of top 10 companies (%), 2022
- Figure 4: Phenol Industry, global, active capacity of top 10 countries (mtpa), 2022
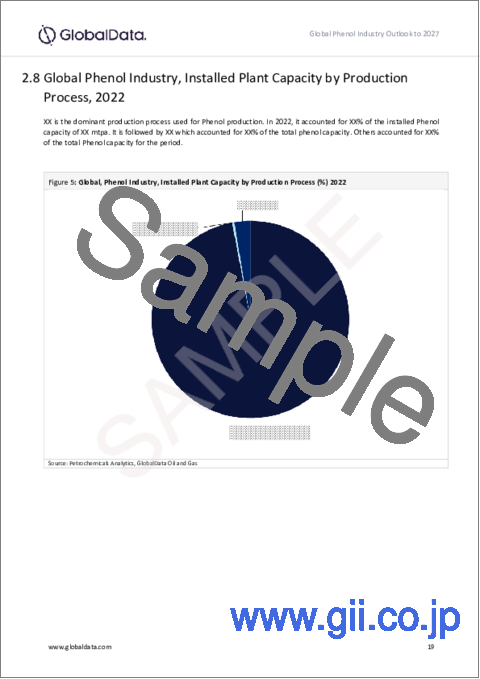
- Figure 5: Global, Phenol Industry, Installed Plant Capacity by Production Process (%) 2022
- Figure 6: Global, Phenol Industry, Installed Plant Capacity by Technology (%) 2022
- Figure 7: Phenol Industry, global, planned and announced capacity additions by region (mtpa), 2027
- Figure 8: Phenol Industry, global, planned and announced Capacity Additions by Top 10 countries (mtpa), 2027
- Figure 9: Phenol Industry, global, planned and announced Capacity Additions by Top 10 companies (mtpa), 2027
- Figure 10: Phenol Industry, Total Capex Spending on Planned and Announced Projects by Region ($ bil), 2023-2027
- Figure 11: Phenol Industry, Total Capex Spending on Planned and Announced Projects by Countries ($ bil), 2023-2027
- Figure 12: Phenol Industry, Asia, Capacity Share vis-a-vis Growth by Key Countries, 2017-2022
- Figure 13: Asia, Phenol Industry, Installed Plant Capacity by Production Process (%) 2022
- Figure 14: Asia, Phenol Industry, Installed Plant Capacity by Technology (%) 2022
- Figure 15: Phenol Industry, Asia, New Build and Expansion Capital Expenditure Outlook for Planned and Announced Projects ($B), 2023-2027
- Figure 16: Phenol Industry, Asia, New Build and Expansion Capital Expenditure Outlook for Planned and Announced Projects by Countries ($B), 2023-2027
- Figure 17: Phenol Industry, North America, Capacity Share vis-a-vis Growth by Key Countries, 2017-2022
- Figure 18: North America, Phenol Industry, Installed Plant Capacity by Production Process (%) 2022
- Figure 19: North America, Phenol Industry, Installed Plant Capacity by Technology (%) 2022
- Figure 20: Phenol Industry, North America, New Build and Expansion Capital Expenditure Outlook for Planned and Announced Projects ($B), 2023-2027
- Figure 21: Phenol Industry, North America Industry, New Build and Expansion Capital Expenditure Outlook for Planned and Announced Projects by Countries ($B), 2023-2027
- Figure 22: Phenol Industry, Europe, Capacity Share vis-a-vis Growth by Key Countries, 2017-2022
- Figure 23: Phenol Industry, South America, Capacity Share vis-a-vis Growth by Key Countries, 2017-2022
- Figure 24: South America, Phenol Industry, Installed Plant Capacity by Technology (%) 2022
- Figure 25: Phenol Industry, FSU, Capacity Share vis-a-vis Growth by Key Countries, 2017-2022
- Figure 26: Phenol Industry, Middle East, Capacity Share vis-a-vis Growth by Key Countries, 2017-2022
- Figure 27: Phenol Industry, Africa, Capacity Share vis-a-vis Growth by Key Countries, 2017-2022
Abstract
Global Phenol capacity is poised to see considerable growth over the next five years, potentially increasing from 15.65 mtpa in 2022 to 18.62 mtpa in 2027, registering total growth of 19%.
Around ten planned and announced Phenol projects are expected to come online, in Asia and North America over the upcoming years. Among countries, India is expected to lead Phenol capacity additions by 2027, followed by China and South Korea. Zhejiang Rongsheng Holding Group Co Ltd, INEOS Ltd and Shandong Yulong Petrochemical Ltd are the top three companies by planned and announced capacity additions globally over the upcoming years.
Scope
- Global Phenol capacity outlook by region
- Global Phenol outlook by country
- Phenol planned and announced projects details
- Capacity share of the major Phenol producers globally
- Global Phenol capital expenditure outlook by region
- Global Phenol capital expenditure outlook by country
Reasons to Buy
- Obtain the most up to date information available on all active, planned, and announced Phenol plants globally
- Identify opportunities in the global Phenol industry with the help of upcoming projects and capital expenditure outlook
- Facilitate decision making on the basis of strong historical and forecast of Phenol capacity data
Table of Contents
Table of Contents
1. Introduction
- What is This Report About?
- Market Definition
2. Global Phenol Capacity and Capital Expenditure Review
- 2.1 Global Phenol Industry, An Overview
- 2.2 Global Phenol Industry, Capacity by key countries
- 2.3 Global Phenol Industry, Capacity Share vis-a-vis Growth by Key Countries, 2017-2022
- 2.4 Global Phenol Industry, Top 10 Planned and Announced Projects
- 2.5 Global Phenol Industry, Capacity contribution by region
- 2.6 Key Companies by Phenol Capacity Contribution (% Share), 2022
- 2.7 Key Countries by Active Global Capacity Contribution to Phenol Industry
- 2.8 Global Phenol Industry, Installed Plant Capacity by Production Process, 2022
- 2.9 Global Phenol Industry, Installed Plant Capacity by Technology, 2022
- 2.10 Regional Capacity Additions from Planned and Announced Projects
- 2.11 Global Capacity Additions from Planned and Announced Projects by Top 10 Countries
- 2.12 Global Capacity Additions from Planned and Announced Projects by Top 10 Companies
- 2.13 Regional Capex Spending on Planned and Announced Projects
- 2.14 Global Capex Spending on Planned and Announced Projects by countries
3. Global Planned and Announced Phenol Projects
4. Asia Phenol Industry
- 4.1 Asia Phenol Industry, An Overview
- 4.2 Asia Phenol Industry, Capacity by Key Countries, 2017-2027
- 4.3 Asia Phenol Industry, Capacity Share vis-a-vis Growth by Key Countries, 2017-2022
- 4.4 Asia Phenol Industry, Installed Plant Capacity by Production Process, 2022
- 4.5 Asia Phenol Industry, Installed Plant Capacity by Technology, 2022
- 4.6 Asia Phenol Industry, New Build and Expansion Capital Expenditure Outlook for Planned and Announced Projects
- 4.7 Asia Phenol Industry, New Build and Expansion Capital Expenditure Outlook for Planned and Announced Projects by countries
- 4.8 Phenol Industry in China
- 4.9 Phenol Industry, South Korea
- 4.10 Phenol Industry, Taiwan
- 4.11 Phenol Industry, Japan
- 4.12 Phenol Industry, Thailand
- 4.13 Phenol Industry, Singapore
- 4.14 Phenol Industry, India
5. North America Phenol Industry
- 5.1 North America Phenol Industry, An Overview
- 5.2 North America Phenol Industry, Capacity by Key Countries, 2017-2027
- 5.3 North America Phenol Industry, Capacity Share vis-a-vis Growth by Key Countries, 2017-2022
- 5.4 North America Phenol Industry, Installed Plant Capacity by Production Process, 2022
- 5.5 North America Phenol Industry, Installed Plant Capacity by Technology, 2022
- 5.6 North America Phenol Industry, New Build and Expansion Capital Expenditure Outlook for Planned and Announced Projects
- 5.7 North America Phenol Industry, New Build and Expansion Capital Expenditure Outlook for Planned and Announced Projects by countries
- 5.8 Phenol Industry, United States
6. Europe Phenol Industry
- 6.1 Europe Phenol Industry, An Overview
- 6.2 Europe Phenol Industry, Capacity by Key Countries, 2017-2027
- 6.3 Europe Phenol Industry, Capacity Share vis-a-vis Growth by Key Countries, 2017-2022
- 6.4 Europe Phenol Industry, Installed Plant Capacity by Production Process, 2022
- 6.5 Phenol Industry, Germany
- 6.6 Phenol Industry, Belgium
- 6.7 Phenol Industry, Spain
- 6.8 Phenol Industry, Italy
- 6.9 Phenol Industry, Finland
- 6.10 Phenol Industry, France
- 6.11 Phenol Industry, Poland
7. South America Phenol Industry
- 7.1 South America Phenol Industry, An Overview
- 7.2 South America Phenol Industry, Capacity by Key Countries, 2017-2027
- 7.3 South America Phenol Industry, Capacity Share vis-a-vis Growth by Key Countries, 2017-2022
- 7.4 South America Phenol Industry, Installed Plant Capacity by Production Process, 2022
- 7.5 South America Phenol Industry, Installed Plant Capacity by Technology, 2022
- 7.6 Phenol Industry, Brazil
8. Former Soviet Union (FSU) Phenol Industry
- 8.1 FSU Phenol Industry, An Overview
- 8.2 FSU Phenol Industry, Capacity by Key Countries, 2017-2027
- 8.3 FSU Phenol Industry, Capacity Share vis-a-vis Growth by Key Countries, 2017-2022
- 8.4 FSU Phenol Industry, Installed Plant Capacity by Production Process, 2022
- 8.5 Phenol Industry, Russia
9. Middle East Phenol Industry
- 9.1 Middle East Phenol Industry, An Overview
- 9.2 Middle East Phenol Industry, Capacity by Key Countries, 2017-2027
- 9.3 Middle East Phenol Industry, Capacity Share vis-a-vis Growth by Key Countries, 2017-2022
- 9.4 Middle East Phenol Industry, Installed Plant Capacity by Production Process, 2022
- 9.5 Middle East Phenol Industry, Installed Plant Capacity by Technology, 2022
- 9.6 Phenol Industry, Saudi Arabia
10. Africa Phenol Industry
- 10.1 Africa Phenol Industry, An Overview
- 10.2 Africa Phenol Industry, Capacity by Key Countries, 2017-2027
- 10.3 Africa Phenol Industry, Capacity Share vis-a-vis Growth by Key Countries, 2017-2022
- 10.4 Africa Phenol Industry, Installed Plant Capacity by Production Process, 2022
- 10.5 Africa Phenol Industry, Installed Plant Capacity by Technology, 2022
- 10.6 Phenol Industry, South Africa
11. Appendix
- 11.1 Definitions
- 11.2 Abbreviations
- 11.3 Status Definition
- 11.4 Methodology
- Contact Us
