|
|
市場調査レポート
商品コード
1359995
オセアニアの石油・ガス上流開発動向と予測:国別、地勢別、施設タイプ別、企業別予測(2023年~2027年)Oceania Oil and Gas Upstream Development Trends and Forecast by Countries, Terrain, Facility Type and Companies, 2023-2027 |
||||||
|
|
|||||||
カスタマイズ可能
適宜更新あり
|
|||||||


| オセアニアの石油・ガス上流開発動向と予測:国別、地勢別、施設タイプ別、企業別予測(2023年~2027年) |
|
出版日: 2023年09月26日
発行: GlobalData
ページ情報: 英文 32 Pages
納期: 即納可能
|

- 全表示
- 概要
- 図表
- 目次
オセアニア地域は、オーストラリア、パプアニューギニア、ニュージーランドの3カ国で構成されています。操業中および計画中の油田からの原油・コンデンセート・天然ガス生産量は、2023年の3,070mboedから2027年には2,693mboedへと、1日当たり37万7,000バレル減少すると予想されます。これは、化石燃料から再生可能エネルギーへのシフトと相まって、生産鉱区の自然減少に起因するとみられています。しかし、2027年には、発表済みおよび計画中の油田から545mboedの生産増加が見込まれます。
当レポートでは、オセアニアの石油・ガス上流開発動向について調査し、2023年~2027年のオセアニアの石油・ガス生産動向、新規プロジェクト資本支出見通し、今後のプロジェクト見通しなどを提供しています。
目次
目次
第1章 概要
第2章 オセアニア開発動向
- 生産見通し
- 設備投資の見通し
- 開発の見通し
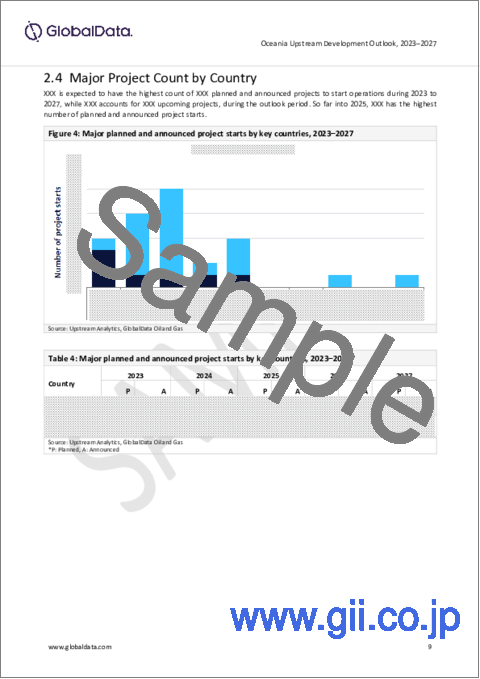
- 主要プロジェクト数、国別
- 主要プロジェクト数、地勢別
- 主なプロジェクト数、施設タイプ別
- プロジェクトの最新情報、2023年
第3章 石油開発の焦点
- 原油およびコンデンセート生産見通し、国別
- 原油・コンデンセート生産見通し、企業別
- 今後の石油プロジェクト
第4章 ガス開発の焦点
- 天然ガス生産見通し、国別
- 天然ガス生産見通し、企業別
- 今後のガスプロジェクト
第5章 支出の見通し
- 新規プロジェクト支出見通し、国別
- 新規プロジェクト支出見通し、企業別
- 新規プロジェクト支出見通し、地勢別
- 新規事業支出見通し、施設タイプ別
第6章 付録
List of Tables
List of Tables
- Table 1: Production outlook from producing, planned, and announced projects (mboed), 2023-2027*
- Table 2: Capex outlook from producing, planned and announced projects ($M), 2023-2027
- Table 3: Recoverable reserves (mmboe) from planned and announced projects by key country, field terrain, and project count, 2023-2027
- Table 4: Major planned and announced project starts by key countries, 2023-2027*
- Table 5: Planned and announced projects of country by terrain, 2023-2027*
- Table 6: Major planned and announced projects by facility type, 2023-2027*
- Table 7: Latest project updates, 2023
- Table 8: Crude and condensate production outlook by country (bd), 2023-2027
- Table 9: Crude and condensate production outlook from planned and announced projects by country (bd), 2023-2027
- Table 10: Crude and condensate production outlook by key companies (bd), 2023-2027
- Table 11: Crude and condensate production outlook from planned and announced projects by key companies (bd), 2023-2027
- Table 12: Key upcoming oil projects, 2023-2027
- Table 13: Natural gas production outlook by key countries (mmcfd), 2023-2027
- Table 14: Natural gas production outlook from planned and announced projects by country (mmcfd), 2023-2027
- Table 15: Natural gas production outlook by key companies (mmcfd), 2023-2027
- Table 16: Natural gas production outlook from planned and announced projects by key companies (mmcfd), 2023-2027
- Table 17: Key upcoming gas projects, 2023-2027
- Table 18: Capex outlook for major planned and announced projects by key countries ($M), 2023-2027*
- Table 19: Capex outlook for major planned and announced projects by key companies ($M), 2023-2027*
- Table 20: Capex outlook for major planned and announced projects by key companies ($M), 2023-2027*
- Table 21: Capex outlook for major planned and announced projects by key countries ($M), 2023-2027*
List of Figures
List of Figures
- Figure 1: Production outlook from producing, planned, and announced projects (mboed), 2023-2027*
- Figure 2: Capex outlook from producing, planned, and announced projects ($M), 2023-2027
- Figure 3: Recoverable reserves (mmboe) from planned and announced projects by key country, field terrain, and project count, 2023-2027
- Figure 4: Major planned and announced project starts by key countries, 2023-2027
- Figure 5: Planned and announced projects of country by terrain, 2023-2027*
- Figure 6: Planned and announced projects by facility type, 2023-2027*
- Figure 7: Crude and condensate production outlook by country (bd), 2023-2027
- Figure 8: Crude and condensate production outlook from planned and announced projects by country (bd), 2023-2027
- Figure 9: Crude and condensate production outlook from planned and announced projects by country (bd), 2023-2027
- Figure 10: Crude and condensate production outlook by key companies (bd), 2023-2027
- Figure 11: Crude and condensate production outlook from planned and announced projects by key companies (bd), 2023-2027
- Figure 12: Crude and condensate production outlook from planned and announced projects by key companies (bd), 2023-2027
- Figure 13: Natural gas production outlook by key countries (mmcfd), 2023-2027
- Figure 14: Natural gas production outlook from planned and announced projects by key country (mmcfd), 2023-2027
- Figure 15: Natural gas production outlook from planned and announced projects by country (mbd), 2023-2027
- Figure 16: Natural gas production outlook by key companies (mmcfd), 2023-2027
- Figure 17: Natural gas production outlook from planned and announced projects by key companies (mmcfd), 2023-2027
- Figure 18: Natural gas production outlook from planned and announced projects by key companies (mmcfd), 2023-2027
- Figure 19: Capex outlook for major planned and announced projects by key countries ($M), 2023-2027
- Figure 20: Capex outlook for major planned and announced projects by key companies ($M), 2023-2027
- Figure 21: Capex outlook for major planned and announced projects by field terrain ($M), 2023-2027
- Figure 22: Capex outlook for major planned and announced projects by facility type ($M), 2023-2027
Abstract
The Oceania region is made up of three countries Australia, Papua New Guinea, and New Zealand. The crude, condensate, and natural gas production from active and planned fields are expected to see a decline of 377 thousand barrels of oil equivalent per day (mboed), from 3,070 mboed in 2023 to 2,693 mboed in 2027. This is most likely attributed to the natural decline in producing fields, coupled with the shift from fossil fuels to renewable energy. However, in 2027 the region is to see a boost in production of 545 mboed, from the announced and planned fields.
Scope
- Oceania oil and gas production outlook by key countries, and key companies for the period 2023-2027
- Oceania new projects capital expenditure outlook by key countries, key companies, field terrain and facility type for 2023-2027
- Major projects count by key countries, field terrain, and facility type
- Details of key upcoming crude and natural gas projects in the region
Reasons to Buy
- Understand Oceania's oil and gas production outlook during the period 2023-2027
- Keep abreast of key upcoming production projects in Oceania during the outlook period
- Facilitate decision-making on the basis of strong oil and gas production data
- Develop business strategies with the help of specific insights on the Oceania upstream sector
- Assess your competitor's planned oil and gas production projects in the region
Table of Contents
Table of Contents
1. Overview
2. Oceania Development Trends
- 2.1 Production outlook
- 2.2 Capex Outlook
- 2.3 Development Outlook
- 2.4 Major Project Count by Country
- 2.5 Major Project Count by Terrain
- 2.6 Major Project Count by Facility Type
- 2.7 Latest Project Updates, 2023
3. Oil Development Focus
- 3.1 Crude & Condensate Production Outlook by Country
- 3.2 Crude & Condensate Production Outlook by Company
- 3.3 Upcoming Oil Projects
4. Gas Development Focus
- 4.1 Natural Gas Production Outlook by Country
- 4.2 Natural Gas Production Outlook by Company
- 4.3 Upcoming Gas Projects
5. Expenditure Outlook
- 5.1 New Project Expenditure Outlook by Country
- 5.2 New Project Expenditure Outlook by Company
- 5.3 New Project Expenditure Outlook by Field Terrain
- 5.4 New Project Expenditure Outlook by Facility Type
6. Appendix
- 6.1 Abbreviations
- 6.2 Methodology
- About GlobalData
- Contact Us