|
|
市場調査レポート
商品コード
1347848
再生可能エネルギー製油所の生産能力と設備投資(CapEx)の予測:地域別、企業、プロジェクト(2023年~2027年)Renewable Refineries Capacity and Capital Expenditure (CapEx) Forecast by Region, Companies and Projects, 2023-2027 |
||||||
|
|
|||||||
カスタマイズ可能
適宜更新あり
|
|||||||


価格
| 再生可能エネルギー製油所の生産能力と設備投資(CapEx)の予測:地域別、企業、プロジェクト(2023年~2027年) |
|
出版日: 2023年09月01日
発行: GlobalData
ページ情報: 英文
納期: 即納可能
|

- 全表示
- 概要
- 図表
- 目次
概要
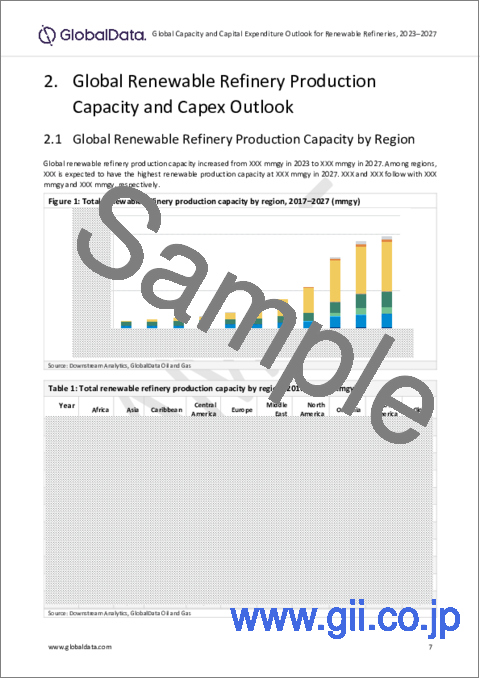
世界の再生可能エネルギー製油所の生産能力は、2023年の年間78億1,200万ガロンから、2027年に年間244億700万ガロンに達し、212%の大幅な成長が見込まれています。北米の再生可能エネルギー製油所の生産能力は、2027年に年間131億4,200万ガロンに達する見込みで、これは世界の全地域で最高です。次いで欧州が年間38億8,200万ガロン、アジアが年間35億2,200万ガロンです。
当レポートでは、世界の再生可能エネルギー製油所について調査分析し、各地域の生産能力と設備投資の見通しや、プロジェクトの詳細情報などを提供しています。
目次
第1章 世界の再生可能エネルギー製油所の生産の見通し(~2027年)
- 主なハイライト
第2章 世界の再生可能エネルギー製油所の生産能力と設備投資の見通し
- 世界の再生可能エネルギー製油所の生産能力:地域別
- 再生可能エネルギー製油所の生産能力の新設と拡張:主要国別
- 世界の今後の再生可能エネルギー製油所の見通し:開発段階別
- 世界の今後の再生可能エネルギー製油所の見通し:タイプ別、地域別
- 世界の今後の再生可能エネルギー製油所の見通し:タイプ別、国別
- 再生可能エネルギー製油所の新設と拡張設備投資:地域別
- 再生可能エネルギー製油所の新設と拡張設備投資:主要国別
- 再生可能エネルギー製油所の新設と拡張設備投資:主要企業別
第3章 地域の設備投資の見通し:国別、企業別
- アフリカ - 再生可能エネルギー製油所の新設と拡張設備投資:国別
- アフリカ - 再生可能エネルギー製油所の新設と拡張設備投資:企業別
- アジア - 再生可能エネルギー製油所の新設と拡張設備投資:主要国別
- アジア - 再生可能エネルギー製油所の新設と拡張設備投資:主要企業別
- カリブ海 - 再生可能エネルギー製油所の新設と拡張設備投資:国別
- カリブ海 - 再生可能エネルギー製油所の新設と拡張設備投資:企業別
- 中米 - 再生可能エネルギー製油所の新設と拡張設備投資:国別
- 中米 - 再生可能エネルギー製油所の新設と拡張設備投資:企業別
- 欧州 - 再生可能エネルギー製油所の新設と拡張設備投資:主要国別
- 欧州 - 再生可能エネルギー製油所の新設と拡張設備投資:主要企業別
- 中東 - 再生可能エネルギー製油所の新設と拡張設備投資:主要国別
- 中東 - 再生可能エネルギー製油所の新設と拡張設備投資:主要企業別
- 北米 - 再生可能エネルギー製油所の新設と拡張設備投資:国別
- 北米 - 再生可能エネルギー製油所の新設と拡張設備投資:主要企業別
- オセアニア - 再生可能エネルギー製油所の新設と拡張設備投資:主要国別
- オセアニア - 再生可能エネルギー製油所の新設と拡張設備投資:主要企業別
- 南米 - 再生可能エネルギー製油所の新設と拡張設備投資:主要国別
- 南米 - 再生可能エネルギー製油所の新設と拡張設備投資:企業別
第4章 世界の計画中・発表済み再生可能エネルギー製油所
第5章 付録
図表
List of Tables
List of Tables
- Table 1: Total renewable refinery production capacity by region, 2017-2027 (mmgy)
- Table 2: New Build and expansion renewable refinery production capacity additions by key countries, 2027 (mmgy)
- Table 3: Global upcoming renewable refineries outlook by development stage, 2023-2027
- Table 4: Global upcoming renewable refineries outlook by type and region, 2023-2027
- Table 5: Global upcoming renewable refineries outlook by type and key countries, 2027
- Table 6: New build and expansion capex of renewable refineries by region, 2023-2027 ($M)*
- Table 7: New build and expansion capex of renewable refineries by region, 2023-2027 ($M)*
- Table 8: New build and expansion capex of renewable refineries by key companies, 2023-2027 ($M)*
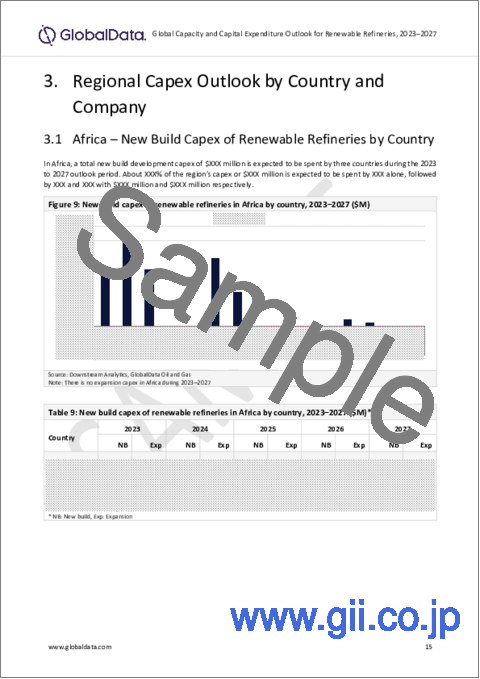
- Table 9: New build capex of renewable refineries in Africa by country, 2023-2027 ($M)*
- Table 10: New build capex of renewable refineries in Africa by key companies, 2023-2027 ($M)*
- Table 11: New build capex of renewable refineries in Asia by key countries, 2023-2027 ($M)*
- Table 12: New Build capex of renewable refineries in Asia by key companies, 2023-2027 ($M)*
- Table 13: New build capex of renewable refineries in the Caribbean by country, 2023-2027 ($M)*
- Table 14: New build capex of renewable refineries in the Caribbean by company, 2023-2027 ($M)*
- Table 15: New build and expansion capex of renewable refineries in Central America by country, 2023-2027 ($M)*
- Table 16: New Build and expansion capex of renewable refineries in Central America by key companies, 2023-2027 ($M)*
- Table 17: New Build and expansion capex of renewable refineries in Europe by key countries, 2023-2027 ($M) *
- Table 18: New Build and expansion capex of renewable refineries in Europe by key companies, 2023-2027 ($M)*
- Table 19: New build capex of renewable refineries in the Middle East by country, 2023-2027 ($M)*
- Table 20: New Build capex of renewable refineries in the Middle East by key companies, 2023-2027 ($M)*
- Table 21: New build and expansion capex of renewable refineries in North America by country, 2023-2027 ($M)
- Table 22: New build and expansion capex of renewable refineries in North America by key companies, 2023-2027 ($M)*
- Table 23: New build capex of renewable refineries in Oceania by key countries, 2023-2027 ($M)*
- Table 24: New Build capex of renewable refineries in Oceania by key companies, 2023-2027 ($M)*
- Table 25: New build capex of renewable refineries in South America by country, 2023-2027 ($M)*
- Table 26: New build capex of renewable refineries in South America by company, 2023-2027 ($M)*
- Table 27: Global planned and announced renewable refineries, 2023-2027
List of Figures
List of Figures
- Figure 1: Total renewable refinery production capacity by region, 2017-2027 (mmgy)
- Figure 2: New Build and expansion renewable refinery production capacity additions by key countries, 2027 (mmgy)
- Figure 3: Global upcoming renewable refineries outlook by development stage, 2023-2027
- Figure 4: Global upcoming renewable refineries outlook by type and region, 2023-2027
- Figure 5: Global upcoming renewable refineries outlook by type and key countries, 2027
- Figure 6: New build and expansion capex of renewable refineries by region, 2023-2027 ($B)
- Figure 7: New build and expansion capex of renewable refineries by key countries, 2023-2027 ($B)
- Figure 8: New build and expansion capex of renewable refineries by key companies, 2023-2027 ($M)
- Figure 9: New build capex of renewable refineries in Africa by country, 2023-2027 ($M)
- Figure 10: New build capex of renewable refineries in Africa by key companies, 2023-2027 ($M)
- Figure 11: New build capex of renewable refineries in Asia by key countries, 2023-2027 ($M)
- Figure 12: New Build capex of renewable refineries in Asia by key companies, 2023-2027 ($M)
- Figure 13: New build capex of renewable refineries in the Caribbean by country, 2023-2027 ($M)
- Figure 14: New build capex of renewable refineries in the Caribbean by company, 2023-2027 ($M)
- Figure 15: New build and expansion capex of renewable refineries in Central America by country, 2023-2027 ($M)
- Figure 16: New build and expansion capex of renewable refineries in Central America by key companies, 2023-2027 ($M)
- Figure 17: New Build and expansion capex of renewable refineries in Europe by key countries, 2023-2027 ($M)
- Figure 18: New build and expansion capex of renewable refineries in Europe by key companies, 2023-2027 ($M)
- Figure 19: New build capex of renewable refineries in the Middle East by country, 2023-2027 ($M)
- Figure 20: New build capex of renewable refineries in the Middle East by key companies, 2023-2027 ($M)
- Figure 21: New build and expansion capex of renewable refineries in North America by country, 2023-2027 ($M)
- Figure 22: New build and expansion capex of renewable refineries in North America by key companies, 2023-2027 ($M)
- Figure 23: New Build capex of renewable refineries in Oceania by key countries, 2023-2027 ($M)
- Figure 24: New build capex of renewable refineries in Oceania by key companies, 2023-2027 ($M)
- Figure 25: New Build capex of renewable refineries in South America by country, 2023-2027 ($M)
- Figure 26: New build capex of renewable refineries in South America by company, 2023-2027 ($M)
目次
Product Code: GDGE0441MAR
Abstract
Global renewable refinery production capacity is expected to increase tremendously from 7,812 million gallons per year (mmgy) in 2023 to 24,407 mmgy in 2027 registering a total growth of 212%. North America's renewable refinery production capacity is expected to reach 13,142 mmgy in 2027, the highest among all regions globally. Europe and Asia follow with 3,882 mmgy and 3,522 mmgy, respectively.
Scope
- Renewable refinery production capacity by region for the period 2017 to 2027
- Renewable refinery new build and expansion production capacity by key countries
- New build and expansion capex of renewable refineries by region, key countries, and companies
- Regional new build and expansion capital expenditure outlook by key countries and companies
- Key details of major new build renewable refineries expected to start operations by 2027
Reasons to Buy
- Obtain the most up-to-date information available on renewable refineries globally
- Facilitate decision-making on the basis of strong historical, and outlook of renewable refinery production capacity data
- Develop business strategies with the help of specific insights about capex spending on renewable refineries globally and by region
- Keep abreast of key new build renewable refinery projects globally
- Assess your competitor's new build renewable refinery projects and capex
Table of Contents
Table of Contents
1. Global Renewable Refinery Production Outlook to 2027
- 1.1 Key Highlights
2. Global Renewable Refinery Production Capacity and Capex Outlook
- 2.1 Global Renewable Refinery Production Capacity by Region
- 2.2 New Build and Expansion Renewable Refinery Production Capacity by Key Countries
- 2.3 Global Upcoming Renewable Refineries Outlook by Development Stage
- 2.4 Global Upcoming Renewable Refineries Outlook by Type and Region
- 2.5 Global Upcoming Renewable Refineries Outlook by Type and Countries
- 2.6 New Build and Expansion Capex of Renewable Refineries by Region
- 2.7 New Build and Expansion Capex of Renewable Refineries by Key Countries
- 2.8 New Build and Expansion Capex of Renewable Refineries by Key Companies
3. Regional Capex Outlook by Country and Company
- 3.1 Africa - New Build Capex of Renewable Refineries by Country
- 3.2 Africa - New Build Capex of Renewable Refineries by Company
- 3.3 Asia - New Build Capex of Renewable Refineries by Key Countries
- 3.4 Asia - New Build Capex of Renewable Refineries by Key Companies
- 3.5 Caribbean - New Build Capex of Renewable Refineries by Country
- 3.6 Caribbean - New Build Capex of Renewable Refineries by Company
- 3.7 Central America - New Build and Expansion Capex of Renewable Refineries by Country
- 3.8 Central America - New Build and Expansion Capex of Renewable Refineries by Company
- 3.9 Europe - New Build and Expansion Capex of Renewable Refineries by Key Countries
- 3.10 Europe - New Build and Expansion Capex of Renewable Refineries by Key Companies
- 3.11 Middle East - New Build Capex of Renewable Refineries by Key Countries
- 3.12 Middle East - New Build Capex of Renewable Refineries by Key Companies
- 3.13 North America - New Build and Expansion Capex of renewable refineries by Country
- 3.14 North America - New Build and Expansion Capex of Renewable Refineries by Key Companies
- 3.15 Oceania - New Build Capex of Renewable Refineries by Key Countries
- 3.16 Oceania - New Build Capex of Renewable Refineries by Key Companies
- 3.17 South America - New Build Capex of Renewable Refineries by Key Countries
- 3.18 South America - New Build Capex of Renewable Refineries by Company
4. Global Planned and Announced Renewable Refineries
5. Appendix
- 5.1 Abbreviations
- 5.2 Important Definitions
- 5.3 Market Definition
- 5.4 Methodology
- Coverage
- Secondary Research
- About GlobalData
- Contact Us

お電話でのお問い合わせ
044-952-0102
( 土日・祝日を除く )