|
|
市場調査レポート
商品コード
1327397
高純度テレフタル酸(PTA)業界:設備容量と設備投資(CapEx)予測、地域別・国別(稼働中プラント、計画・発表済みプロジェクトの詳細)Purified Terephthalic Acid (PTA) Industry Installed Capacity and Capital Expenditure (CapEx) Forecast by Region and Countries including details of All Active Plants, Planned and Announced Projects |
||||||
カスタマイズ可能
適宜更新あり
|
|||||||


| 高純度テレフタル酸(PTA)業界:設備容量と設備投資(CapEx)予測、地域別・国別(稼働中プラント、計画・発表済みプロジェクトの詳細) |
|
出版日: 2023年07月21日
発行: GlobalData
ページ情報: 英文 127 Pages
納期: 即納可能
|

- 全表示
- 概要
- 目次
世界の高純度テレフタル酸(PTA)の生産能力は、今後5年間で大幅な成長を遂げ、2022年の1億1,786万トン/年から2027年には1億7,116万トン/年と、合計45%の成長を遂げるとみられています。
計画・発表済みの約32のPTAプロジェクトが、今後数年間に主にアジア、次いで中東で稼動すると予想されます。国別では、中国が2027年までのPTA生産能力増加をリードし、インドがそれに続くと予想されます。Tongkun Group Co Ltd、Hengli Petrochemical(Dalian)Co Ltd、Xin Feng Ming Group Co Ltdの3社が、今後数年間に世界で計画・発表される生産能力の上位3社です。
当レポートは、世界の高純度テレフタル酸(PTA)業界について調査し、世界の稼働中、計画中、および発表済みのPTAプラントに関する最新情報、今後のプロジェクトや設備投資の見通し、世界のPTA業界における事業機会などをまとめています。
目次
目次
第1章 イントロダクション
第2章 世界の精製テレフタル酸(PTA)の生産能力と資本支出のレビュー
- 世界のPTA業界、概要
- 世界のPTA業界、主要国別の生産能力
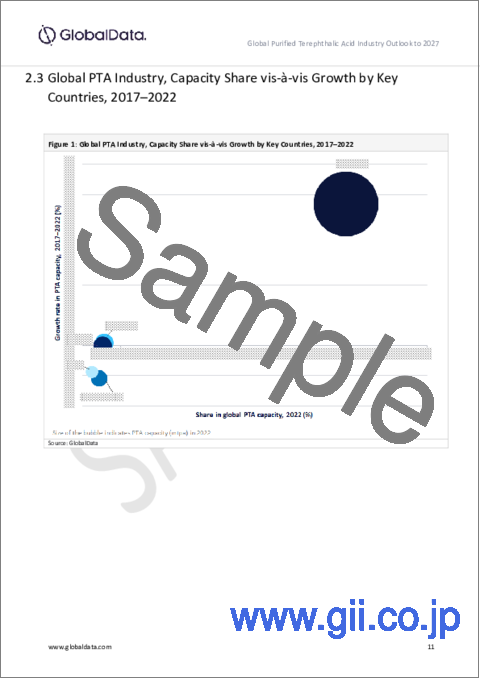
- 世界のPTA業界、主要国別の成長率に対する生産能力シェア、2017~2022年
- 世界のPTA業界、計画・発表済みプロジェクトトップ10
- 世界のPTA業界、地域別の生産能力寄与率
- PTAの能力貢献別主要企業(%シェア)、2022年
- PTA業界への世界の生産能力の貢献別主要国
- 世界のPTA業界、生産プロセス別の工場設備容量、2022年
- 計画・発表済みプロジェクト別地域のs生産能力追加
- 上位10か国別計画・発表済みプロジェクトによる世界の生産能力追加
- 上位10社別計画・発表済みプロジェクトによる世界の生産能力追加
- 計画・発表済みプロジェクトに対する地域別の設備投資支出
- 計画・発表済みプロジェクトに対する世界の設備投資支出(国別)
第3章 世界的に計画・発表済みPTAプロジェクト
第4章 アジアのPTA業界
- アジアのPTA業界、概要
- アジアのPTA業界、主要国別の生産能力、2017年~2027年
- アジアのPTA業界、主要国別の成長率に対する生産能力シェア、2017~2022年
- アジアのPTA業界、生産プロセス別の工場設備容量、2022年
- アジアのPTA業界、計画・発表済みプロジェクトの新設・拡張設備投資見通し
- アジアのPTA業界、各国の計画・発表プロジェクトの新設・拡張設備投資見通し
- 中国のPTA業界
- PTA業界、台湾
- PTA業界、インド
- PTA業界、韓国
- PTA業界、タイ
- PTA業界、インドネシア
- PTA業界、日本
- PTA業界、マレーシア
- PTA業界、パキスタン
- PTA業界、ブルネイ
第5章 北米のPTA業界
- 北米のPTA業界、概要
- 北米PTA業界、主要国別の生産能力、2017年~2027年
- 北米PTA業界、主要国別の成長率に対する生産能力シェア、2017年~2022年
- 北米PTA業界、生産プロセス別の工場設備容量、2022年
- 北米PTA業界、技術別のプラント設備容量、2022年
- 北米PTA業界、計画・発表済みプロジェクトの新設・拡張設備投資見通し
- 北米PTA業界、国別の計画・発表プロジェクトの新設・拡張設備投資見通し
- PTA業界、米国
- PTA業界、メキシコ
- PTA業界、カナダ
第6章 欧州のPTA業界
- 欧州のPTA業界、概要
- 欧州のPTA業界、主要国別の生産能力、2017年~2027年
- 欧州のPTA業界、主要国別の成長率に対する生産能力シェア、2017年~2022年
- 欧州のPTA業界、生産プロセス別のプラント設備容量、2022年
- 欧州のPTA業界、技術別のプラント設備容量、2022年
- PTA業界、ベルギー
- PTA業界、ポルトガル
- PTA業界、オランダ
- PTA業界、ポーランド
- PTA業界、スペイン
- PTA業界、ドイツ
第7章 中東のPTA業界
第8章 南米PTA業界
第9章 旧ソ連(FSU)のPTA業界
第10章 付録
- 定義
- 略語
- ステータスの定義
- 調査手法
- お問い合わせ
Abstract
Global Purified Terephthalic Acid (PTA) capacity is poised to see considerable growth over the next five years, potentially increasing from 117.86 mtpa in 2022 to 171.16 mtpa in 2027, registering total growth of 45%.
Around 32 planned and announced PTA projects are expected to come online, predominantly in Asia, followed by Middle East over the upcoming years. Among countries, China is expected to lead PTA capacity additions by 2027, followed by India. Tongkun Group Co Ltd, Hengli Petrochemical (Dalian) Co Ltd and Xin Feng Ming Group Co Ltd are the top three companies by planned and announced capacity additions globally over the upcoming years.
Scope
- Global PTA capacity outlook by region
- Global PTA outlook by country
- PTA planned and announced projects details
- Capacity share of the major PTA producers globally
- Global PTA capital expenditure outlook by region
- Global PTA capital expenditure outlook by country
Reasons to Buy
- Obtain the most up to date information available on all active, planned, and announced PTA plants globally
- Identify opportunities in the global PTA industry with the help of upcoming projects and capital expenditure outlook
- Facilitate decision making on the basis of strong historical and forecast of PTA capacity data
Table of Contents
Table of Contents
1. Introduction
2. Global Purified Terephthalic Acid (PTA) Capacity and Capital Expenditure Review
- 2.1 Global PTA Industry, An Overview
- 2.2 Global PTA Industry, Capacity by key countries
- 2.3 Global PTA Industry, Capacity Share vis-a-vis Growth by Key Countries, 2017-2022
- 2.4 Global PTA Industry, Top 10 Planned and Announced Projects
- 2.5 Global PTA Industry, Capacity contribution by region
- 2.6 Key Companies by PTA Capacity Contribution (% Share), 2022
- 2.7 Key Countries by Active Global Capacity Contribution to PTA Industry
- 2.8 Global PTA Industry, Installed Plant Capacity by Production Process, 2022
- 2.9 Regional Capacity Additions from Planned and Announced Projects
- 2.10 Global Capacity Additions from Planned and Announced Projects by Top 10 Countries
- 2.11 Global Capacity Additions from Planned and Announced Projects by Top 10 Companies
- 2.12 Regional Capex Spending on Planned and Announced Projects
- 2.13 Global Capex Spending on Planned and Announced Projects by countries
3. Global Planned and Announced PTA Projects
4. Asia PTA Industry
- 4.1 Asia PTA Industry, An Overview
- 4.2 Asia PTA Industry, Capacity by Key Countries, 2017-2027
- 4.3 Asia PTA Industry, Capacity Share vis-a-vis Growth by Key Countries, 2017-2022
- 4.4 Asia PTA Industry, Installed Plant Capacity by Production Process, 2022
- 4.5 Asia PTA Industry, New Build and Expansion Capital Expenditure Outlook for Planned and Announced Projects
- 4.6 Asia PTA Industry, New Build and Expansion Capital Expenditure Outlook for Planned and Announced Projects by countries
- 4.7 PTA Industry in China
- 4.8 PTA Industry, Taiwan
- 4.9 PTA Industry, India
- 4.10 PTA Industry, South Korea
- 4.11 PTA Industry, Thailand
- 4.12 PTA Industry, Indonesia
- 4.13 PTA Industry, Japan
- 4.14 PTA Industry, Malaysia
- 4.15 PTA Industry, Pakistan
- 4.16 PTA Industry, Brunei
5. North America PTA Industry
- 5.1 North America PTA Industry, An Overview
- 5.2 North America PTA Industry, Capacity by Key Countries, 2017-2027
- 5.3 North America PTA Industry, Capacity Share vis-a-vis Growth by Key Countries, 2017-2022
- 5.4 North America PTA Industry, Installed Plant Capacity by Production Process, 2022
- 5.5 North America PTA Industry, Installed Plant Capacity by Technology, 2022
- 5.6 North America PTA Industry, New Build and Expansion Capital Expenditure Outlook for Planned and Announced Projects
- 5.7 North America PTA Industry, New Build and Expansion Capital Expenditure Outlook for Planned and Announced Projects by countries
- 5.8 PTA Industry, United States
- 5.9 PTA Industry, Mexico
- 5.10 PTA Industry, Canada
6. Europe PTA Industry
- 6.1 Europe PTA Industry, An Overview
- 6.2 Europe PTA Industry, Capacity by Key Countries, 2017-2027
- 6.3 Europe PTA Industry, Capacity Share vis-a-vis Growth by Key Countries, 2017-2022
- 6.4 Europe PTA Industry, Installed Plant Capacity by Production Process, 2022
- 6.5 Europe PTA Industry, Installed Plant Capacity by Technology, 2022
- 6.6 PTA Industry, Belgium
- 6.7 PTA Industry, Portugal
- 6.8 PTA Industry, Netherlands
- 6.9 PTA Industry, Poland
- 6.10 PTA Industry, Spain
- 6.11 PTA Industry, Germany
7. Middle East PTA Industry
8. South America PTA Industry
9. Former Soviet Union (FSU) PTA Industry
10. Appendix
- 10.1 Definitions
- 10.2 Abbreviations
- 10.3 Status Definition
- 10.4 Methodology
- Contact Us
