|
|
市場調査レポート
商品コード
1121462
塩化ビニルモノマー(VCM)産業の地域・国別の設備容量および設備投資(CAPEX)予測(全稼働プラント、計画中/発表済みプロジェクトの詳細を含む)、2022年~2026年Vinyl Chloride Monomer (VCM) Industry Installed Capacity and Capital Expenditure (CapEx) Forecast by Region and Countries including details of All Active Plants, Planned and Announced Projects, 2022-2026 |
||||||
|
|
|||||||
|
● お客様のご希望に応じて、既存データの加工や未掲載情報(例:国別セグメント)の追加などの対応が可能です。 詳細はお問い合わせください。 |
|||||||


| 塩化ビニルモノマー(VCM)産業の地域・国別の設備容量および設備投資(CAPEX)予測(全稼働プラント、計画中/発表済みプロジェクトの詳細を含む)、2022年~2026年 |
|
出版日: 2022年07月28日
発行: GlobalData
ページ情報: 英文 118 Pages
納期: 即納可能
|
- 全表示
- 概要
- 図表
- 目次
世界の塩化ビニルモノマー(VCM)容量は今後5年間で大幅に増加し、2021年の50.67mtpaから2026年には53.89mtpaまで増加する可能性があります。2026年までに約16の計画中/発表済みVCMプロジェクトが稼働を開始し、主にアジアで、その後数年間で北米が続くと予想されます。国別では、中国が2026年までにVCMの容量追加を先導し、米国とタイがそれに続くと予想されています。Formosa Plastics Group、Shin-Etsu Chemical Co Ltd、Tianjin Bohai Chemical Industry Co Ltdが、計画中/発表済み容量追加において、今後数年間の世界における上位3社です。
当レポートでは、世界の塩化ビニルモノマー(VCM)市場について調査分析し、稼働中/新設 (計画中/発表済み) の塩化ビニルモノマー(VCM)に関する最新情報、地域/国別のCAPEXの見通しについて、体系的な情報を提供しています。
目次
目次
第1章 イントロダクション
- レポートの内容
- 市場の定義
第2章 世界の塩化ビニルモノマー(VCM):容量と設備投資のレビュー
- 世界の塩化ビニルモノマー(VCM)産業:概要
- 世界のVCM産業:主要国別の容量(2016年~2026年)
- 世界のVCM産業:主要国別の成長に対する容量シェア(2016年~2026年)
- 世界のVCM産業:上位10の計画中/発表済みプロジェクト
- 地域別の世界のVCM容量への貢献
- 2021年のVCM容量への貢献(%シェア)別の主要企業
- VCM産業に対する稼働中の世界の容量の貢献別の主要国
- 世界のVCM産業:生産プロセス別のプラント設備容量(2021年)
- 計画中/発表済みプロジェクトによる地域の容量の追加
- 計画中/発表済みプロジェクトによる世界の容量の追加:上位10か国別
- 計画中/発表済みプロジェクトによる世界の容量の追加:上位10社別
- 計画中/発表済みプロジェクトに対する地域の設備投資支出
- 計画中/発表済みプロジェクトに対する世界の設備投資支出:国別
第3章 世界の計画中/発表済みの塩化ビニルモノマー(VCM)プロジェクト
第4章 アジアの塩化ビニルモノマー(VCM)産業
- アジアのVCM産業:概要
- アジアのVCM産業:主要国別の容量(2016年~2026年)
- アジアのVCM産業:主要国別の成長に対する容量シェア(2016年~2026年)
- アジアのVCM産業:計画中/発表済みプロジェクトの年間の新規建設/拡張資本支出の見通し
- アジアのVCM産業:年間の新規建設/拡張設備投資の見通し、国別の計画中/発表済みプラント
- 中国のVCM産業
- 台湾のVCM産業
- 日本のVCM産業
- インドのVCM産業
- 韓国のVCM産業
- インドネシアのVCM産業
- タイのVCM産業
- パキスタンのVCM産業
- ベトナムのVCM産業
第5章 中東の塩化ビニルモノマー(VCM)産業
- 中東のVCM産業:概要
- 中東のVCM産業:主要国別の容量(2016年~2026年)
- 中東のVCM産業:主要国別の成長に対する容量シェア(2016年~2026年)
- 中東のVCM産業:生産プロセス別のプラント設備容量(2021年)
- 中東のVCM産業:技術別のプラント設備容量(2021年)
- イランのVCM産業
- サウジアラビアのVCM産業
- カタールのVCM産業
- トルコのVCM産業
- イラクのVCM産業
第6章 北米の塩化ビニルモノマー(VCM)産業
- 北米のVCM産業:概要
- 北米のVCM産業:国別の容量(2016年~2026年)
- 北米のVCM産業:国別の成長率に対する容量シェア(2016年~2026年)
- 北米のVCM産業:生産プロセス別のプラント設備容量(2021年)
- 北米のVCM産業:稼働中/計画中/発表済みプロジェクトに対する年間の新規建設/拡張資本支出の見通し
- 北米のVCM産業:国別の稼働中/計画中/発表済みプロジェクトに対する年間の新規建設/拡張資本支出の見通し
- 米国のVCM産業
第7章 欧州の塩化ビニルモノマー(VCM)産業
- 欧州のVCM産業:概要
- 欧州のVCM産業:主要国別の容量(2016年~2026年)
- 欧州のVCM産業:主要国別の成長に対する容量シェア(2016年~2026年)
- 欧州のVCM産業:生産プロセス別のプラント設備容量(2021年)
- 欧州のVCM産業:稼働中/計画中/発表済みプロジェクトに対する年間の新規建設/拡張資本支出の見通し
- 欧州のVCM産業:国別の稼働中/計画中/発表済みプロジェクトに対する年間の新規建設/拡張資本支出の見通し
- ドイツのVCM産業
- フランスのVCM産業
- ベルギーのVCM産業
- オランダのVCM産業
- ノルウェーのVCM産業
- ハンガリーのVCM産業
- ポーランドのVCM産業
- スペインのVCM産業
- スウェーデンのVCM産業
- チェコ共和国のVCM産業
- ポルトガルのVCM産業
- スロバキアのVCM産業
第8章 旧ソ連(FSU)の塩化ビニルモノマー(VCM)産業
- FSUのVCM産業:概要
- FSUのVCM産業:国別の容量(2016年~2026年)
- FSUのVCM産業:国別の成長に対する容量シェア(2016年~2026年)
- FSUのVCM産業:生産プロセス別のプラント設備容量(2021年)
- FSUのVCM産業:技術別のプラント設備容量(2021年)
- ロシアのVCM産業
- ウクライナのVCM産業
第9章 南米の塩化ビニルモノマー(VCM)産業
- 南米のVCM産業:概要
- 南米のVCM産業:主要国別の容量(2016年~2026年)
- 南米のVCM産業:主要国別の成長に対する容量シェア(2016年~2026年)
- 南米のVCM産業:生産プロセス別のプラント設備容量(2021年)
- ブラジルのVCM産業
- アルゼンチンのVCM産業
- ベネズエラのVCM産業
第10章 アフリカの塩化ビニルモノマー(VCM)産業
- アフリカのVCM産業:概要
- アフリカのVCM産業:主要国別の容量(2016年~2026年)
- アフリカのVCM産業:主要国別の成長に対する容量シェア(2016年~2026年)
- アフリカのVCM産業:生産プロセス別のプラント設備容量(2021年)
- エジプトのVCM産業
- 南アフリカのVCM産業
- リビアのVCM産業
第11章 付録
- 定義
- 略語
- ステータス定義
- 調査手法
- 連絡先
List of Tables
List of Tables
- Table 1: Vinyl Chloride Monomer (VCM) industry, global, key statistics, 2021
- Table 2: VCM industry, global, capacity by key countries (mtpa), 2016-2026
- Table 3: VCM industry, global, top 10 planned and announced projects details, 2022-2026
- Table 4: VCM industry, global, capacity by region (mtpa), 2021-2026
- Table 5: VCM industry, global, capacity share of top 10 companies (%), 2021
- Table 6: VCM industry, global, active VCM capacity of top 10 countries (mtpa), 2021
- Table 7: Global VCM industry, installed plant capacity by production process (%) 2021
- Table 8: Global VCM industry, installed plant capacity by EDC cracking, 2021
- Table 9: Global VCM industry, installed plant capacity by Calcium Carbide/Acetylene route, 2021
- Table 10: VCM industry, global, planned and announced capacity additions by region (mtpa), 2026
- Table 11: VCM industry, global, planned and announced capacity additions by top 10 countries (mtpa), 2026
- Table 12: VCM industry, global, planned and announced capacity additions by top 10 companies (mtpa), 2026
- Table 13: VCM industry, global, total capex spending on planned and announced projects by region ($B), 2022-2026
- Table 14: VCM industry, global, total capex spending on planned and announced projects by countries ($B), 2022-2026
- Table 15: Global, planned and announced VCM projects details
- Table 16: VCM industry, Asia, key statistics, 2021
- Table 17: VCM industry, Asia, capacity by key countries (mtpa), 2016-2026
- Table 18: VCM industry, Asia, annual new build and expansion capital expenditure outlook for planned and announced projects ($B), 2022-2026
- Table 19: VCM Industry, Asia, annual new build and expansion capital expenditure outlook for active, planned and announced projects by countries ($B), 2022-2026
- Table 20: VCM industry, China, capacity by major plants (mtpa) 2016-2026
- Table 21: VCM industry, Taiwan, capacity by major plants (mtpa) 2016-2026
- Table 22: VCM industry, Japan, capacity by major plants (mtpa) 2016-2026
- Table 23: VCM industry, India, capacity by major plants (mtpa) 2016-2026
- Table 24: VCM Industry, South Korea, Capacity by Major Plants (mtpa) 2016-2026
- Table 25: VCM industry, Indonesia, capacity by major plants (mtpa) 2016-2026
- Table 26: VCM industry, Thailand, capacity by major plants (mtpa) 2016-2026
- Table 27: VCM industry, Pakistan, capacity by major plants (mtpa) 2016-2026
- Table 28: VCM industry, Vietnam, capacity by major plants (mtpa) 2016-2026
- Table 29: VCM industry, Middle East, key statistics, 2021
- Table 30: VCM industry, Middle East, capacity by key countries (mtpa), 2016-2026
- Table 31: Middle East, VCM industry, installed plant capacity by technology (%) 2021
- Table 32: Middle East, VCM industry, major installed plant capacity by Vinnolit Vinyl Chloride Monomer (VCM) Technology, 2021
- Table 33: Middle East, VCM industry, major installed plant capacity by Tosoh Vinyl Chloride Monomer (VCM) Technology, 2021
- Table 34: Middle East, VCM industry, major installed plant capacity by Solvay Vinyl Chloride Monomer (VCM) Technology, 2021
- Table 35: Middle East, VCM industry, major installed plant capacity by Mitsui Vinyl Chloride Monomer (VCM) Technology, 2021
- Table 36: Middle East, VCM industry, major installed plant capacity by BF Goodrich Vinyl Chloride Monomer (VCM) Technology, 2021
- Table 37: VCM industry, Iran, capacity by major plants (mtpa) 2016-2026
- Table 38: VCM industry, Saudi Arabia, capacity by major plants (mtpa) 2016-2026
- Table 39: VCM industry, Qatar, capacity by major plants (mtpa) 2016-2026
- Table 40: VCM industry, Turkey, capacity by major plants (mtpa) 2016-2026
- Table 41: VCM industry, Iraq, capacity by major plants (mtpa) 2016-2026
- Table 42: VCM industry, North America, key statistics, 2021
- Table 43: VCM industry, North America, capacity by countries (mtpa), 2016-2026
- Table 44: North America, VCM industry, installed plant capacity by production process (%) 2021
- Table 45: North America VCM industry, installed plant capacity by EDC Cracking, 2021
- Table 46: VCM industry, North America, annual new build and expansion capital expenditure outlook for active, planned and announced projects ($B), 2022-2026
- Table 47: VCM industry, North America, annual new build and expansion capital expenditure outlook for active, planned and announced projects by countries ($B), 2022-2026
- Table 48: VCM industry, the US, capacity by major plants (mtpa) 2016-2026
- Table 49: VCM industry, Europe, key statistics, 2021
- Table 50: VCM industry, Europe, capacity by key countries (mtpa), 2016-2026
- Table 51: Europe VCM industry, installed plant capacity by production process (%) 2021
- Table 52: Europe VCM industry, installed plant capacity by EDC cracking, 2021
- Table 53: VCM industry, Europe, annual new build and expansion capital expenditure outlook for active, planned and announced projects ($B), 2022-2026
- Table 54: VCM industry, Europe, annual new build and expansion capital expenditure outlook for active, planned and announced projects by countries ($B), 2022-2026
- Table 55: VCM industry, Germany, capacity by major plants (mtpa) 2016-2026
- Table 56: VCM industry, France, capacity by major plants (mtpa) 2016-2026
- Table 57: VCM industry, Belgium, capacity by major plants (mtpa) 2016-2026
- Table 58: VCM industry, Netherlands, capacity by major plants (mtpa) 2016-2026
- Table 59: VCM industry, Norway, capacity by major plants (mtpa) 2016-2026
- Table 60: VCM industry, Hungary, capacity by major plants (mtpa) 2016-2026
- Table 61: VCM industry, Poland, capacity by major plants (mtpa) 2016-2026
- Table 62: VCM industry, Spain capacity by major plants (mtpa) 2016-2026
- Table 63: VCM industry, Sweden capacity by major plants (mtpa) 2016-2026
- Table 64: VCM industry, Czech Republic capacity by major plants (mtpa) 2016-2026
- Table 65: VCM industry, Portugal capacity by major plants (mtpa) 2016-2026
- Table 66: VCM industry, Slovakia capacity by major plants (mtpa) 2016-2026
- Table 67: VCM industry, FSU, key statistics, 2021
- Table 68: VCM industry, FSU, capacity by country (mtpa), 2016-2026
- Table 69: FSU, VCM industry, installed plant capacity by production process (%) 2021
- Table 70: FSU VCM industry, installed plant capacity by EDC Cracking, 2021
- Table 71: FSU VCM industry, installed plant capacity by Calcium Carbide/Acetylene route, 2021
- Table 72: FSU VCM industry, installed plant capacity by production technology (%) 2021
- Table 73: FSU VCM industry, installed plant capacity by Uhde Vinyl Chloride Monomer (VCM) technology, 2021
- Table 74: VCM industry, Russia, capacity by major plants (mtpa) 2016-2026
- Table 75: VCM Industry, Ukraine, capacity by major plants (mtpa) 2016 - 2026
- Table 76: VCM industry, South America key statistics, 2021
- Table 77: VCM industry, South America capacity by key countries (mtpa), 2016-2026
- Table 78: South America VCM industry, installed plant capacity by production process (%) 2021
- Table 79: South America VCM industry, installed plant capacity by EDC cracking, 2021
- Table 80: VCM industry, Brazil, capacity by major plants (mtpa) 2016-2026
- Table 81: VCM industry, Argentina, capacity by major plants (mtpa) 2016-2026
- Table 82: VCM industry, Venezuela, capacity by major plants (mtpa) 2016-2026
- Table 83: VCM industry, Africa, key statistics, 2021
- Table 84: VCM industry, Africa, capacity by key countries (mtpa), 2016-2026
- Table 85: VCM industry, Egypt, capacity by major plants (mtpa) 2016-2026
- Table 86: VCM industry, South Africa, capacity by major plants (mtpa) 2016-2026
- Table 87: VCM industry, Libya, capacity by major plants (mtpa) 2016-2026
List of Figures
List of Figures
- Figure 1: Global VCM industry, capacity share vis-a-vis growth by key countries, 2016-2021
- Figure 2: VCM industry, global, capacity by region (mtpa), 2021-2026
- Figure 3: VCM industry, global, capacity share of top 10 companies (%), 2021
- Figure 4: VCM industry, global, active VCM capacity of top 10 countries (mtpa), 2021
- Figure 5: Global VCM industry, installed plant capacity by production process (%) 2021
- Figure 6: VCM industry, global, planned and announced capacity additions by region (mtpa), 2026
- Figure 7: VCM industry, global, planned and announced capacity additions by top 10 countries (mtpa), 2026
- Figure 8: VCM industry, global, planned and announced capacity additions by top 10 companies (mtpa), 2026
- Figure 9: VCM industry, global, total capex spending on planned and announced projects by region ($B), 2022-2026
- Figure 10: VCM industry, global, total capex spending on planned and announced projects by countries ($B), 2022-2026
- Figure 11: VCM industry, Asia, capacity share vis-a-vis growth by key countries, 2016-2021
- Figure 12: VCM industry, Asia, annual new build and expansion capital expenditure outlook for planned and announced projects ($B), 2022-2026
- Figure 13: VCM Industry, Asia, annual new build and expansion capital expenditure outlook for planned and announced projects by countries ($B), 2022-2026
- Figure 14: VCM industry, Middle East, capacity share vis-a-vis growth by key countries, 2016-2021
- Figure 15: Middle East, VCM industry, installed plant capacity by technology (%) 2021
- Figure 16: VCM industry, North America, capacity share vis-a-vis growth by countries, 2016-2021
- Figure 17: North America, VCM industry, installed plant capacity by production process (%) 2021
- Figure 18: VCM industry, North America, annual new build and expansion capital expenditure outlook for active, planned and announced projects ($B), 2022-2026
- Figure 19: VCM industry, North America, annual new build and expansion capital expenditure outlook for active, planned and announced projects by countries ($B), 2022-2026
- Figure 20: VCM industry, Europe, capacity share vis-a-vis growth by key countries, 2016-2021
- Figure 21: Europe VCM industry, installed plant capacity by production process (%) 2021
- Figure 22: VCM industry, Europe, annual new build and expansion capital expenditure outlook for active, planned and announced projects ($B), 2022-2026
- Figure 23: VCM industry, Europe, annual new build and expansion capital expenditure outlook for active, planned and announced projects by countries ($B), 2022-2026
- Figure 24: VCM industry, FSU, capacity share vis-a-vis growth by country, 2016 - 2021
- Figure 25: FSU, VCM industry, installed plant capacity by production process (%) 2021
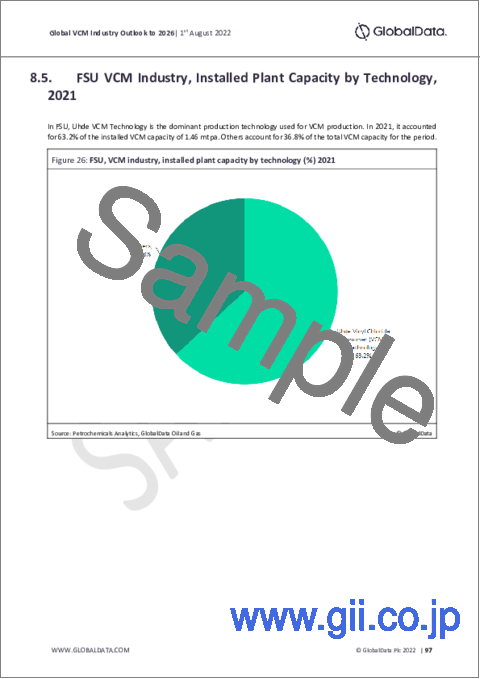
- Figure 26: FSU, VCM industry, installed plant capacity by technology (%) 2021
- Figure 27: VCM industry, South America, capacity share vis-a-vis growth by key countries, 2016-2021
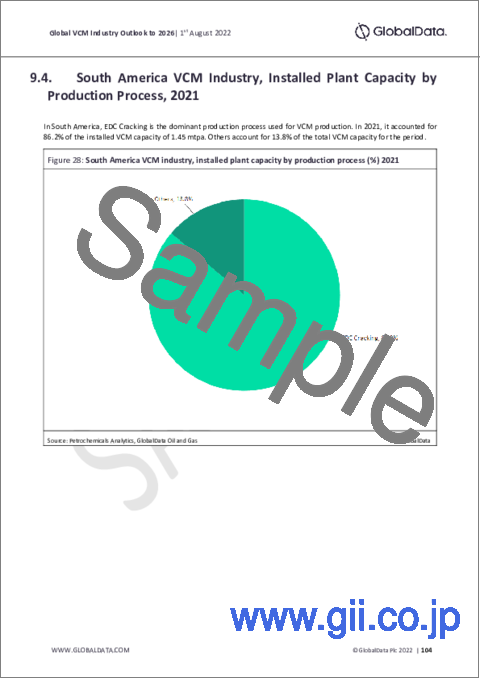
- Figure 28: South America VCM industry, installed plant capacity by production process (%) 2021
- Figure 29: VCM industry, Africa, capacity share vis-a-vis growth by countries, 2016-2021
Global VCM capacity is poised to see considerable growth over the next five years, potentially increasing from 50.67 mtpa in 2021 to 53.89 mtpa in 2026. Around 16 planned and announced VCM projects are expected to come online by 2026, predominantly in Asia followed by the North America over the upcoming years. Among countries, China is expected to lead VCM capacity additions by 2026, followed by US and Thailand. Formosa Plastics Group, Shin-Etsu Chemical Co Ltd, and Tianjin Bohai Chemical Industry Co Ltd are the top three companies by planned and announced capacity additions globally over the upcoming years
Scope
- Global VCM capacity outlook by region
- Global VCM outlook by country
- VCM planned and announced projects details
- Capacity share of the major VCM producers globally
- Global VCM capital expenditure outlook by region
- Global VCM capital expenditure outlook by country
Reasons to Buy
- Obtain the most up to date information available on all active, planned, and announced VCM plants globally
- Identify opportunities in the global VCM industry with the help of upcoming projects and capital expenditure outlook
- Facilitate decision making on the basis of strong historical and forecast of VCM capacity data
Table of Contents
Table of Contents
1. Introduction
- 1.1. What is This Report About?
- 1.2. Market Definition
2. Global Vinyl Chloride Monomer (VCM) Capacity and Capital Expenditure Review
- 2.1. Global Vinyl Chloride Monomer (VCM) Industry, An Overview
- 2.2. Global VCM Industry, Capacity by Key Countries, 2016-2026
- 2.3. Global VCM Industry, Capacity Share vis-a-vis Growth by Key Countries, 2016-2021
- 2.4. Global VCM Industry, Top 10 Planned and Announced Projects
- 2.5. Global VCM Capacity Contribution by Region
- 2.6. Key Companies by VCM Capacity Contribution (% Share), 2021
- 2.7. Key Countries by Active Global Capacity Contribution to VCM Industry
- 2.8. Global VCM Industry, Installed Plant Capacity by Production Process, 2021
- 2.9. Regional Capacity Additions from Planned and Announced Projects
- 2.10. Global Capacity Additions from Planned and Announced Projects by Top 10 Countries
- 2.11. Global Capacity Additions from Planned and Announced Projects by Top 10 Companies
- 2.12. Regional Capex Spending on Planned and Announced Projects
- 2.13. Global Capex Spending on Planned and Announced Projects by Countries
3. Global Planned and Announced VCM Projects
4. Asia VCM Industry
- 4.1. Asia VCM Industry, An Overview
- 4.2. Asia VCM Industry, Capacity by Key Countries, 2016-2026
- 4.3. Asia VCM Industry, Capacity Share vis-a-vis Growth by Key Countries, 2016-2021
- 4.4. Asia VCM Industry, Annual New Build and Expansion Capital Expenditure Outlook for Planned and Announced Projects
- 4.5. Asia VCM Industry, Annual New Build and Expansion Capital Expenditure Outlook for Planned and Announced Plants by Countries
- 4.6. VCM Industry in China
- 4.7. VCM Industry in Taiwan
- 4.8. VCM Industry in Japan
- 4.9. VCM Industry in India
- 4.10. VCM Industry in South Korea
- 4.11. VCM Industry in Indonesia
- 4.12. VCM Industry in Thailand
- 4.13. VCM Industry in Pakistan
- 4.14. VCM Industry in Vietnam
5. Middle East VCM Industry
- 5.1. Middle East VCM Industry, An Overview
- 5.2. Middle East VCM Industry, Capacity by key Countries, 2016-2026
- 5.3. Middle East VCM Industry, Capacity Share vis-a-vis Growth by key Countries, 2016-2021
- 5.4. Middle East VCM Industry, Installed Plant Capacity by Production Process, 2021
- 5.5. Middle East VCM Industry, Installed Plant Capacity by Technology, 2021
- 5.6. VCM Industry in Iran
- 5.7. VCM Industry in Saudi Arabia
- 5.8. VCM Industry in Qatar
- 5.9. VCM Industry in Turkey
- 5.10. VCM Industry in Iraq
6. North America VCM Industry
- 6.1. North America VCM Industry, An Overview
- 6.2. North America VCM Industry, Capacity by Countries, 2016-2026
- 6.3. North America VCM Industry, Capacity Share vis-a-vis Growth by Countries, 2016-2021
- 6.4. North America VCM Industry, Installed Plant Capacity by Production Process, 2021
- 6.5. North America VCM Industry, Annual New Build and Expansion Capital Expenditure Outlook for Active, Planned and Announced Projects
- 6.6. North America VCM Industry, Annual New Build and Expansion Capital Expenditure Outlook for Active, Planned and Announced Projects by Countries
- 6.7. VCM Industry in the US
7. Europe VCM Industry
- 7.1. Europe VCM Industry, An Overview
- 7.2. Europe VCM Industry, Capacity by key Countries, 2016-2026
- 7.3. Europe VCM Industry, Capacity Share vis-a-vis Growth by key Countries, 2016-2021
- 7.5. Europe VCM Industry, Installed Plant Capacity by Production Process, 2021
- 7.6. Europe VCM Industry, Annual New Build and Expansion Capital Expenditure Outlook for Active, Planned and Announced Projects
- 7.7. Europe VCM Industry, Annual New Build and Expansion Capital Expenditure Outlook for Active, Planned and Announced Projects by Countries
- 7.8. VCM Industry in Germany
- 7.9. VCM Industry in France
- 7.10. VCM Industry in Belgium
- 7.11. VCM Industry in Netherlands
- 7.12. VCM Industry in Norway
- 7.13. VCM Industry in Hungary
- 7.14. VCM Industry in Poland
- 7.15. VCM Industry in Spain
- 7.16. VCM Industry in Sweden
- 7.17. VCM Industry in Czech Republic
- 7.18. VCM Industry in Portugal
- 7.19. VCM Industry in Slovakia
8. Former Soviet Union (FSU) VCM Industry
- 8.1. FSU, VCM Industry, An Overview
- 8.2. FSU VCM Industry, Capacity by Country, 2016-2026
- 8.3. FSU VCM Industry, Capacity Share vis-a-vis Growth by Country, 2016 - 2021
- 8.4. FSU VCM Industry, Installed Plant Capacity by Production Process, 2021
- 8.5. FSU VCM Industry, Installed Plant Capacity by Technology, 2021
- 8.6. VCM Industry in Russia
- 8.7. VCM Industry in Ukraine
9. South America VCM Industry
- 9.1. South America VCM Industry, An Overview
- 9.2. South America VCM Industry, Capacity by Key Countries, 2016-2026
- 9.3. South America VCM Industry, Capacity Share vis-a-vis Growth by Key Countries, 2016-2021
- 9.4. South America VCM Industry, Installed Plant Capacity by Production Process, 2021
- 9.5. VCM Industry in Brazil
- 9.6. VCM Industry in Argentina
- 9.7. VCM Industry in Venezuela
10. Africa VCM Industry
- 10.1. Africa VCM Industry, An Overview
- 10.2. Africa VCM Industry, Capacity by Key Countries, 2016-2026
- 10.3. Africa VCM Industry, Capacity Share vis-a-vis Growth by Key Countries, 2016-2021
- 10.4. Africa VCM Industry, Installed Plant Capacity by Production Process, 2021
- 10.5. VCM Industry in Egypt
- 10.6. VCM Industry in the South Africa
- 10.7. VCM Industry in Libya
11. Appendix
- 11.1. Definitions
- 11.2. Abbreviations
- 11.3. Status Definition
- 11.4. Methodology
- Contact Us