|
|
市場調査レポート
商品コード
1379278
グルカル酸の世界市場 - 世界の業界分析、規模、シェア、成長、動向、地域別見通し、予測(2023年~2030年)- (タイプ別、用途別、地域別、企業別)Glucaric Acid Market - Global Glucaric Acid Industry Analysis, Size, Share, Growth, Trends, Regional Outlook, and Forecast 2023-2030 - (By Type Coverage, By Application Coverage, By Geographic Coverage and By Company) |
||||||
|
|
|||||||
|
|||||||

| グルカル酸の世界市場 - 世界の業界分析、規模、シェア、成長、動向、地域別見通し、予測(2023年~2030年)- (タイプ別、用途別、地域別、企業別) |
|
出版日: 2023年11月01日
発行: Fairfield Market Research
ページ情報: 英文 178 Pages
納期: 2~5営業日
|

全表示
- 概要
- 目次
世界のグルカル酸の市場規模は、2022年に13億米ドルを達成し、2030年には約26億米ドルと大きく成長すると予測されています。2023年から2030年までの予測期間中、市場は10.5%の堅調なCAGRで成長するとみられています。
グルカル酸市場の成長を牽引する主な動向は、洗剤業界からの需要の高まりです。グルカル酸の環境に優しい特性により、洗剤やクリーニング製品に含まれる有害な化学物質の代替品として適しており、持続可能性の動向、厳しい規制、環境に優しく生分解性の代替品を求める消費者の嗜好に合致しています。
研究開発(R&D)への投資の増加は、グルカル酸の生産方法の革新を促進し、新たな用途を探求しています。研究開発の努力は、拡張性、費用対効果、競合を強化することを目的としており、様々な産業でグルカル酸の採用を促進しています。
純グルカル酸タイプは、その汎用性、高純度、様々な用途への適合性により、最大の市場シェアを占めています。確立された製造工程と安定した品質が、この製品の市場優位性を高めています。
グルカル酸市場で最大の市場シェアを占めるのは洗剤用途です。環境に優しく持続可能な洗浄製品に対する消費者の需要が、洗剤へのグルカル酸の採用を促進しています。その有効性と厳しい環境規制への適合性により、グルカル酸は洗剤業界で好まれています。
北米は、持続可能性を重視し、環境規制が厳しく、医薬品産業と洗剤産業が確立していることから、グルカル酸市場を独占しています。消費者の意識と規制遵守が北米の市場リーダーシップに貢献しています。
当レポートでは、世界のグルカル酸市場について調査し、市場の概要とともに、タイプ別、用途別、地域別動向、および市場に参入する企業の競合動向などを提供しています。
目次
第1章 エグゼクティブサマリー
第2章 市場概要
- 市場の定義とセグメンテーション
- 市場力学
- バリューチェーン分析
- ポーターのファイブフォース分析
- COVID-19の影響分析
- ウクライナとロシアの紛争の影響
- 経済概要
- PESTLE分析
第3章 世界のグルカル酸市場の見通し、2018年~2030年
- 世界のグルカル酸市場の見通し、タイプ別、金額別(10億米ドル)、2018年~2030年
- 世界のグルカル酸市場の見通し、用途別、金額(10億米ドル)、2018年~2030年
- 世界のグルカル酸市場の見通し、地域別、金額(10億米ドル)、2018年~2030年
第4章 北米のグルカル酸市場の見通し、2018年~2030年
第5章 欧州のグルカル酸市場の見通し、2018年~2030年
第6章 アジア太平洋のグルカル酸市場の見通し、2018年~2030年
第7章 ラテンアメリカのグルカル酸市場の見通し、2018年~2030年
第8章 中東・アフリカのグルカル酸市場の見通し、2018年~2030年
第9章 競合情勢
- メーカーと用途のヒートマップ
- 企業の市場シェア分析、2022年
- 競争力ダッシュボード
- 企業プロファイル
- Rivertop Renewables
- Chemrez Technologies Inc.
- Jungbunzlauer Suisse AG
- Haihang Industry Co., Ltd.
- Merck KGaA
- Logos
- Santa Cruz Biotechnology, Inc.
- Yifan Biotechnology Group Co., Ltd.
- Anhui Huailong Biochem Co., Ltd.
- Shandong Baovi Energy Technology Co., Ltd.
- Haihang Industry Co., Ltd.
- Parchem Fine & Specialty Chemicals
- Tokyo Chemical Industry Co., Ltd.
- Innospec Inc.
- Jigs Chemical
第10章 付録
The global glucaric acid market is poised for significant growth, with a projected market size of approximately US$2.6 billion by 2030, compared to US$1.3 billion recorded in 2022. The market is expected to grow at a solid CAGR of 10.5% during the forecast period from 2023 to 2030.
Key Drivers of Market Growth:
Increasing Demand from the Detergent Industry: The key trend driving the growth of the glucaric acid market is the rising demand from the detergent industry. Glucaric acid's eco-friendly properties make it a suitable replacement for harmful chemicals in detergents and cleaning products, aligning with sustainability trends, stringent regulations, and consumer preferences for greener, biodegradable alternatives.
Investment in Research and Development: Increasing investment in research and development (R&D) is fostering innovation in glucaric acid production methods and exploring new applications. R&D efforts aim to enhance scalability, cost-effectiveness, and competitiveness, which drives the adoption of glucaric acid across various industries.
Pure Glucaric Acid Type Dominance: Pure glucaric acid type holds the largest market share due to its versatility, high purity, and suitability for various applications. Established production processes and consistent quality have made it a preferred choice, contributing to its market dominance.
Detergent Applications Leading: Detergent applications represent the largest market share in the glucaric acid market. Consumer demand for eco-friendly and sustainable cleaning products is driving the adoption of glucaric acid in detergents. Its effectiveness and compliance with stringent environmental regulations make it a preferred choice in the detergent industry.
North America Leading the Market: North America dominates the glucaric acid market, driven by its strong emphasis on sustainability, strict environmental regulations, and well-established pharmaceutical and detergent industries. Consumer awareness and regulatory compliance contribute to North America's market leadership.
Challenges:
High Initial Capital and Labor Costs: The glucaric acid market faces challenges related to high initial capital and labor costs. Establishing production facilities and implementing eco-friendly production methods require significant upfront investments. Skilled labor is essential for efficient and sustainable production, which can increase operational costs.
Regulatory Compliance: Regulatory compliance poses challenges in the glucaric acid market, as stringent environmental and safety regulations govern chemical manufacturing. Meeting these requirements necessitates substantial investments in research, production, and documentation. Regulatory frameworks can vary by region and may change over time, adding complexity and uncertainty.
Key Trends and Opportunities to Look at:
Biotechnology and Fermentation: Biotechnology and fermentation technology play a pivotal role in the glucaric acid market. These advanced methods enable more efficient, eco-friendly, and cost-effective production processes. Microbial fermentation and biocatalysts are utilized to reduce environmental impact, increase yields, and drive sustainable growth in various industries, including pharmaceuticals and detergents.
Green Chemistry: Green chemistry technology is revolutionizing the glucaric acid market by promoting environmentally friendly and sustainable production methods. It involves designing efficient, non-toxic, and eco-compatible chemical processes for glucaric acid synthesis. Green chemistry minimizes waste, reduces hazardous materials, and conserves resources, enhancing the environmental friendliness and competitiveness of glucaric acid.
Biocatalysis: Biocatalysis technology is gaining prominence in the glucaric acid market as it offers an environmentally friendly and efficient route for synthesis. Enzymes and microorganisms serve as biocatalysts to facilitate glucaric acid production, reducing the need for harsh chemicals and energy-intensive processes. This sustainable approach aligns with green chemistry principles and contributes to the growth of the market by providing a cleaner and more sustainable production method for glucaric acid.
Competitive Landscape:
The global glucaric acid market is consolidated, with a few major players operating globally. Key players are introducing new products and expanding distribution channels to enhance their global presence. The market is expected to witness further consolidation in the coming years.
Key Market Leaders:
Rivertop Renewables
Chemrez Technologies Inc.
Jungbunzlauer
Haihang Industry Co., Ltd.
Merck KGaA
Santa Cruz Biotechnology, Inc.
Shandong Baovi Energy Technology Co., Ltd.
Parchem Fine & Specialty Chemicals
Tokyo Chemical Industry Co., Ltd.
Innospec Inc.
Jigs Chemical
Table of Contents
1. Executive Summary
- 1.1. Global Glucaric Acid Market Snapshot
- 1.2. Future Projections
- 1.3. Key Market Trends
- 1.4. Regional Snapshot, by Value, 2022
- 1.5. Analyst Recommendations
2. Market Overview
- 2.1. Market Definitions and Segmentations
- 2.2. Market Dynamics
- 2.2.1. Drivers
- 2.2.2. Restraints
- 2.2.3. Market Opportunities
- 2.3. Value Chain Analysis
- 2.4. Porter's Five Forces Analysis
- 2.5. Covid-19 Impact Analysis
- 2.5.1. Supply
- 2.5.2. Demand
- 2.6. Impact of Ukraine-Russia Conflict
- 2.7. Economic Overview
- 2.7.1. World Economic Projections
- 2.8. PESTLE Analysis
3. Global Glucaric Acid Market Outlook, 2018 - 2030
- 3.1. Global Glucaric Acid Market Outlook, by Type, Value (US$ Bn), 2018 - 2030
- 3.1.1. Key Highlights
- 3.1.1.1. Pure Glucaric Acid
- 3.1.1.2. Calcium-D-Glucarate
- 3.1.1.3. Potassium Sodium-D-Glucarate
- 3.1.1.4. D-glucaro-1, 4-lactone
- 3.1.1.5. Others
- 3.1.1. Key Highlights
- 3.2. Global Glucaric Acid Market Outlook, by Application, Value (US$ Bn), 2018 - 2030
- 3.2.1. Key Highlights
- 3.2.1.1. Detergents
- 3.2.1.2. Pharmaceuticals
- 3.2.1.3. Food Manufacturing
- 3.2.1.4. Corrosion Inhibitors
- 3.2.1.5. Others
- 3.2.1. Key Highlights
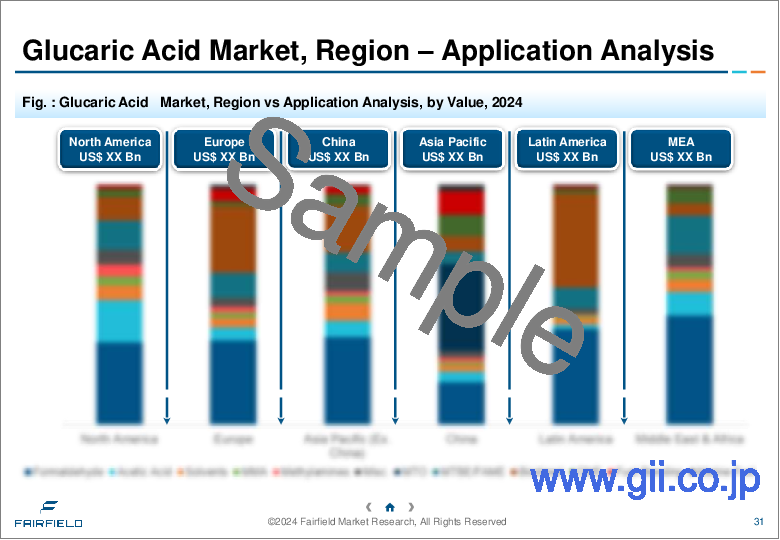
- 3.3. Global Glucaric Acid Market Outlook, by Region, Value (US$ Bn), 2018 - 2030
- 3.3.1. Key Highlights
- 3.3.1.1. North America
- 3.3.1.2. Europe
- 3.3.1.3. Asia Pacific
- 3.3.1.4. Latin America
- 3.3.1.5. Middle East & Africa
- 3.3.1. Key Highlights
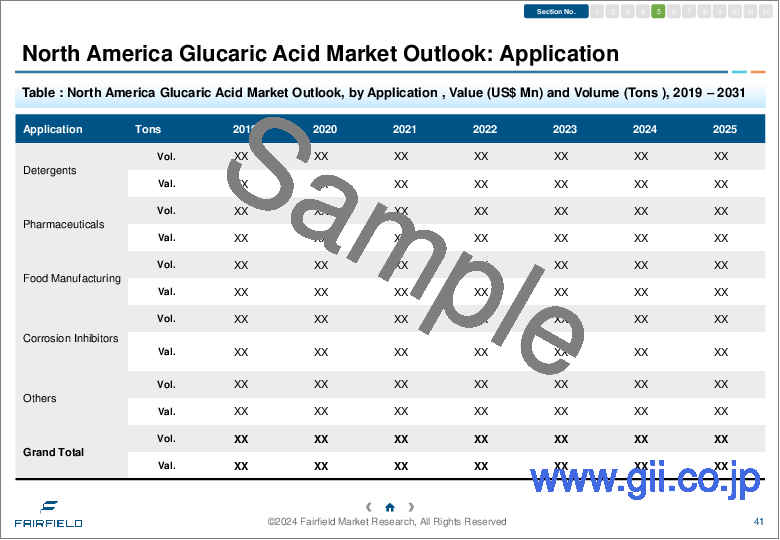
4. North America Glucaric Acid Market Outlook, 2018 - 2030
- 4.1. North America Glucaric Acid Market Outlook, by Type, Value (US$ Bn), 2018 - 2030
- 4.1.1. Key Highlights
- 4.1.1.1. Pure Glucaric Acid
- 4.1.1.2. Calcium-D- glucarate
- 4.1.1.3. Potassium Sodium-D- glucarate
- 4.1.1.4. D-glucaro-1, 4-lactone
- 4.1.1.5. Others
- 4.1.1. Key Highlights
- 4.2. North America Glucaric Acid Market Outlook, by Application, Value (US$ Bn), 2018 - 2030
- 4.2.1. Key Highlights
- 4.2.1.1. Detergents
- 4.2.1.2. Pharmaceuticals
- 4.2.1.3. Food Manufacturing
- 4.2.1.4. Corrosion Inhibitors
- 4.2.1.5. Others
- 4.2.2. BPS Analysis/Market Attractiveness Analysis
- 4.2.1. Key Highlights
- 4.3. North America Glucaric Acid Market Outlook, by Country, Value (US$ Bn), 2018 - 2030
- 4.3.1. Key Highlights
- 4.3.1.1. U.S. Glucaric Acid Market, by Type, Value (US$ Bn), 2018 - 2030
- 4.3.1.2. U.S. Glucaric Acid Market, by Application, Value (US$ Bn), 2018 - 2030
- 4.3.1.3. Canada Glucaric Acid Market, by Type, Value (US$ Bn), 2018 - 2030
- 4.3.1.4. Canada Glucaric Acid Market, by Application, Value (US$ Bn), 2018 - 2030
- 4.3.2. BPS Analysis/Market Attractiveness Analysis
- 4.3.1. Key Highlights
5. Europe Glucaric Acid Market Outlook, 2018 - 2030
- 5.1. Europe Glucaric Acid Market Outlook, by Type, Value (US$ Bn), 2018 - 2030
- 5.1.1. Key Highlights
- 5.1.1.1. Pure Glucaric Acid
- 5.1.1.2. Calcium-D-Glucarate
- 5.1.1.3. Potassium Sodium-D-Glucarate
- 5.1.1.4. D-glucaro-1, 4-lactone
- 5.1.1.5. Others
- 5.1.1. Key Highlights
- 5.2. Europe Glucaric Acid Market Outlook, by Application, Value (US$ Bn), 2018 - 2030
- 5.2.1. Key Highlights
- 5.2.1.1. Detergents
- 5.2.1.2. Pharmaceuticals
- 5.2.1.3. Food Manufacturing
- 5.2.1.4. Corrosion Inhibitors
- 5.2.1.5. Others
- 5.2.2. BPS Analysis/Market Attractiveness Analysis
- 5.2.1. Key Highlights
- 5.3. Europe Glucaric Acid Market Outlook, by Country, Value (US$ Bn), 2018 - 2030
- 5.3.1. Key Highlights
- 5.3.1.1. Germany Glucaric Acid Market, by Type, Value (US$ Bn), 2018 - 2030
- 5.3.1.2. Germany Glucaric Acid Market, by Application, Value (US$ Bn), 2018 - 2030
- 5.3.1.3. U.K. Glucaric Acid Market, by Type, Value (US$ Bn), 2018 - 2030
- 5.3.1.4. U.K. Glucaric Acid Market, by Application, Value (US$ Bn), 2018 - 2030
- 5.3.1.5. France Glucaric Acid Market, by Type, Value (US$ Bn), 2018 - 2030
- 5.3.1.6. France Glucaric Acid Market, by Application, Value (US$ Bn), 2018 - 2030
- 5.3.1.7. Italy Glucaric Acid Market, by Type, Value (US$ Bn), 2018 - 2030
- 5.3.1.8. Italy Glucaric Acid Market, by Application, Value (US$ Bn), 2018 - 2030
- 5.3.1.9. Turkey Glucaric Acid Market, by Type, Value (US$ Bn), 2018 - 2030
- 5.3.1.10. Turkey Glucaric Acid Market, by Application, Value (US$ Bn), 2018 - 2030
- 5.3.1.11. Russia Glucaric Acid Market, by Type, Value (US$ Bn), 2018 - 2030
- 5.3.1.12. Russia Glucaric Acid Market, by Application, Value (US$ Bn), 2018 - 2030
- 5.3.1.13. Rest of Europe Glucaric Acid Market, by Type, Value (US$ Bn), 2018 - 2030
- 5.3.1.14. Rest of Europe Glucaric Acid Market, by Application, Value (US$ Bn), 2018 - 2030
- 5.3.2. BPS Analysis/Market Attractiveness Analysis
- 5.3.1. Key Highlights
6. Asia Pacific Glucaric Acid Market Outlook, 2018 - 2030
- 6.1. Asia Pacific Glucaric Acid Market Outlook, by Type, Value (US$ Bn), 2018 - 2030
- 6.1.1. Key Highlights
- 6.1.1.1. Pure Glucaric Acid
- 6.1.1.2. Calcium-D-Glucarate
- 6.1.1.3. Potassium Sodium-D-Glucarate
- 6.1.1.4. D-glucaro-1, 4-lactone
- 6.1.1.5. Others
- 6.1.1. Key Highlights
- 6.2. Asia Pacific Glucaric Acid Market Outlook, by Application, Value (US$ Bn), 2018 - 2030
- 6.2.1. Key Highlights
- 6.2.1.1. Detergents
- 6.2.1.2. Pharmaceuticals
- 6.2.1.3. Food Manufacturing
- 6.2.1.4. Corrosion Inhibitors
- 6.2.1.5. Others
- 6.2.2. BPS Analysis/Market Attractiveness Analysis
- 6.2.1. Key Highlights
- 6.3. Asia Pacific Glucaric Acid Market Outlook, by Country, Value (US$ Bn), 2018 - 2030
- 6.3.1. Key Highlights
- 6.3.1.1. China Glucaric Acid Market, by Type, Value (US$ Bn), 2018 - 2030
- 6.3.1.2. China Glucaric Acid Market by Application, Value (US$ Bn), 2018 - 2030
- 6.3.1.3. Japan Glucaric Acid Market, by Type, Value (US$ Bn), 2018 - 2030
- 6.3.1.4. Japan Glucaric Acid Market, by Application, Value (US$ Bn), 2018 - 2030
- 6.3.1.5. South Korea Glucaric Acid Market, by Type, Value (US$ Bn), 2018 - 2030
- 6.3.1.6. South Korea Glucaric Acid Market, by Application, Value (US$ Bn), 2018 - 2030
- 6.3.1.7. India Glucaric Acid Market, by Type, Value (US$ Bn), 2018 - 2030
- 6.3.1.8. India Glucaric Acid Market, by Application, Value (US$ Bn), 2018 - 2030
- 6.3.1.9. Southeast Asia Glucaric Acid Market, by Type, Value (US$ Bn), 2018 - 2030
- 6.3.1.10. Southeast Asia Glucaric Acid Market, by Application, Value (US$ Bn), 2018 - 2030
- 6.3.1.11. Rest of Asia Pacific Glucaric Acid Market, by Type, Value (US$ Bn), 2018 - 2030
- 6.3.1.12. Rest of Asia Pacific Glucaric Acid Market, by Application, Value (US$ Bn), 2018 - 2030
- 6.3.2. BPS Analysis/Market Attractiveness Analysis
- 6.3.1. Key Highlights
7. Latin America Glucaric Acid Market Outlook, 2018 - 2030
- 7.1. Latin America Glucaric Acid Market Outlook, by Type, Value (US$ Bn), 2018 - 2030
- 7.1.1. Key Highlights
- 7.1.1.1. Pure Glucaric Acid
- 7.1.1.2. Calcium-D- Glucarate
- 7.1.1.3. Potassium Sodium-D-Glucarate
- 7.1.1.4. D-glucaro-1, 4-lactone
- 7.1.1.5. Others
- 7.1.1. Key Highlights
- 7.2. Latin America Glucaric Acid Market Outlook, by Application, Value (US$ Bn), 2018 - 2030
- 7.2.1. Key Highlights
- 7.2.1.1. Detergents
- 7.2.1.2. Pharmaceuticals
- 7.2.1.3. Food Manufacturing
- 7.2.1.4. Corrosion Inhibitors
- 7.2.1.5. Others
- 7.2.2. BPS Analysis/Market Attractiveness Analysis
- 7.2.1. Key Highlights
- 7.3. Latin America Glucaric Acid Market Outlook, by Country, Value (US$ Bn), 2018 - 2030
- 7.3.1. Key Highlights
- 7.3.1.1. Brazil Glucaric Acid Market, by Type, Value (US$ Bn), 2018 - 2030
- 7.3.1.2. Brazil Glucaric Acid Market, by Application, Value (US$ Bn), 2018 - 2030
- 7.3.1.3. Mexico Glucaric Acid Market, by Type, Value (US$ Bn), 2018 - 2030
- 7.3.1.4. Mexico Glucaric Acid Market, by Application, Value (US$ Bn), 2018 - 2030
- 7.3.1.5. Argentina Glucaric Acid Market, by Type, Value (US$ Bn), 2018 - 2030
- 7.3.1.6. Argentina Glucaric Acid Market, by Application, Value (US$ Bn), 2018 - 2030
- 7.3.1.7. Rest of Latin America Glucaric Acid Market, by Type, Value (US$ Bn), 2018 - 2030
- 7.3.1.8. Rest of Latin America Glucaric Acid Market, by Application, Value (US$ Bn), 2018 - 2030
- 7.3.2. BPS Analysis/Market Attractiveness Analysis
- 7.3.1. Key Highlights
8. Middle East & Africa Glucaric Acid Market Outlook, 2018 - 2030
- 8.1. Middle East & Africa Glucaric Acid Market Outlook, by Type, Value (US$ Bn), 2018 - 2030
- 8.1.1. Key Highlights
- 8.1.1.1. Pure Glucaric Acid
- 8.1.1.2. Calcium-D-Glucarate
- 8.1.1.3. Potassium Sodium-D-Glucarate
- 8.1.1.4. D-glucaro-1, 4-lactone
- 8.1.1.5. Others
- 8.1.1. Key Highlights
- 8.2. Middle East & Africa Glucaric Acid Market Outlook, by Application, Value (US$ Bn), 2018 - 2030
- 8.2.1. Key Highlights
- 8.2.1.1. Detergents
- 8.2.1.2. Pharmaceuticals
- 8.2.1.3. Food Manufacturing
- 8.2.1.4. Corrosion Inhibitors
- 8.2.1.5. Others
- 8.2.2. BPS Analysis/Market Attractiveness Analysis
- 8.2.1. Key Highlights
- 8.3. Middle East & Africa Glucaric Acid Market Outlook, by Country, Value (US$ Bn), 2018 - 2030
- 8.3.1. Key Highlights
- 8.3.1.1. GCC Glucaric Acid Market, by Type, Value (US$ Bn), 2018 - 2030
- 8.3.1.2. GCC Glucaric Acid Market, by Application, Value (US$ Bn), 2018 - 2030
- 8.3.1.3. South Africa Glucaric Acid Market, by Type, Value (US$ Bn), 2018 - 2030
- 8.3.1.4. South Africa Glucaric Acid Market, by Application, Value (US$ Bn), 2018 - 2030
- 8.3.1.5. Egypt Glucaric Acid Market, by Type, Value (US$ Bn), 2018 - 2030
- 8.3.1.6. Egypt Glucaric Acid Market, by Application, Value (US$ Bn), 2018 - 2030
- 8.3.1.7. Nigeria Glucaric Acid Market, by Type, Value (US$ Bn), 2018 - 2030
- 8.3.1.8. Nigeria Glucaric Acid Market, by Application, Value (US$ Bn), 2018 - 2030
- 8.3.1.9. Rest of Middle East & Africa Glucaric Acid Market, by Type, Value (US$ Bn), 2018 - 2030
- 8.3.1.10. Rest of Middle East & Africa Glucaric Acid Market, by Application, Value (US$ Bn), 2018 - 2030
- 8.3.2. BPS Analysis/Market Attractiveness Analysis
- 8.3.1. Key Highlights
9. Competitive Landscape
- 9.1. Manufacturer vs Application Heatmap
- 9.2. Company Market Share Analysis, 2022
- 9.3. Competitive Dashboard
- 9.4. Company Profiles
- 9.4.1. Rivertop Renewables
- 9.4.1.1. Company Overview
- 9.4.1.2. Product Portfolio
- 9.4.1.3. Financial Overview
- 9.4.1.4. Business Strategies and Development
- 9.4.2. Chemrez Technologies Inc.
- 9.4.2.1. Company Overview
- 9.4.2.2. Product Portfolio
- 9.4.2.3. Financial Overview
- 9.4.2.4. Business Strategies and Development
- 9.4.3. Jungbunzlauer Suisse AG
- 9.4.3.1. Company Overview
- 9.4.3.2. Product Portfolio
- 9.4.3.3. Financial Overview
- 9.4.3.4. Business Strategies and Development
- 9.4.4. Haihang Industry Co., Ltd.
- 9.4.4.1. Company Overview
- 9.4.4.2. Product Portfolio
- 9.4.4.3. Financial Overview
- 9.4.4.4. Business Strategies and Development
- 9.4.5. Merck KGaA
- 9.4.5.1. Company Overview
- 9.4.5.2. Product Portfolio
- 9.4.5.3. Financial Overview
- 9.4.5.4. Business Strategies and Development
- 9.4.6. Logos
- 9.4.6.1. Company Overview
- 9.4.6.2. Product Portfolio
- 9.4.6.3. Financial Overview
- 9.4.6.4. Business Strategies and Development
- 9.4.7. Santa Cruz Biotechnology, Inc.
- 9.4.7.1. Company Overview
- 9.4.7.2. Product Portfolio
- 9.4.7.3. Financial Overview
- 9.4.7.4. Business Strategies and Development
- 9.4.8. Yifan Biotechnology Group Co., Ltd.
- 9.4.8.1. Company Overview
- 9.4.8.2. Product Portfolio
- 9.4.8.3. Financial Overview
- 9.4.8.4. Business Strategies and Development
- 9.4.9. Anhui Huailong Biochem Co., Ltd.
- 9.4.9.1. Company Overview
- 9.4.9.2. Product Portfolio
- 9.4.9.3. Financial Overview
- 9.4.9.4. Business Strategies and Development
- 9.4.10. Shandong Baovi Energy Technology Co., Ltd.
- 9.4.10.1. Company Overview
- 9.4.10.2. Product Portfolio
- 9.4.10.3. Financial Overview
- 9.4.10.4. Business Strategies and Development
- 9.4.11. Haihang Industry Co., Ltd.
- 9.4.11.1. Company Overview
- 9.4.11.2. Product Portfolio
- 9.4.11.3. Financial Overview
- 9.4.11.4. Business Strategies and Development
- 9.4.12. Parchem Fine & Specialty Chemicals
- 9.4.12.1. Company Overview
- 9.4.12.2. Product Portfolio
- 9.4.12.3. Financial Overview
- 9.4.12.4. Business Strategies and Development
- 9.4.13. Tokyo Chemical Industry Co., Ltd.
- 9.4.13.1. Company Overview
- 9.4.13.2. Product Portfolio
- 9.4.13.3. Financial Overview
- 9.4.13.4. Business Strategies and Development
- 9.4.14. Innospec Inc.
- 9.4.14.1. Company Overview
- 9.4.14.2. Product Portfolio
- 9.4.14.3. Financial Overview
- 9.4.14.4. Business Strategies and Development
- 9.4.15. Jigs Chemical
- 9.4.15.1. Company Overview
- 9.4.15.2. Product Portfolio
- 9.4.15.3. Financial Overview
- 9.4.15.4. Business Strategies and Development
- 9.4.1. Rivertop Renewables
10. Appendix
- 10.1. Research Methodology
- 10.2. Report Assumptions
- 10.3. Acronyms and Abbreviations

