|
|
市場調査レポート
商品コード
1176579
レアアースの世界市場-2023-2030Global Rare Earth Elements Market - 2023-2030 |
||||||
|
|
|||||||
|
● お客様のご希望に応じて、既存データの加工や未掲載情報(例:国別セグメント)の追加などの対応が可能です。 詳細はお問い合わせください。 |
|||||||


| レアアースの世界市場-2023-2030 |
|
出版日: 2022年12月26日
発行: DataM Intelligence
ページ情報: 英文 212 Pages
納期: 約2営業日
|
- 全表示
- 概要
- 目次
市場概要
レアアースの市場規模は、予測期間内(2023-2030年)にCAGR9.4%で成長し、著しい成長を見せています。
レアアースとは、周期表でグループ分けされた17種類の金属および化合物で、特定の性質を持つ元素です。レアアースは、抽出時に一次産品として生産されるか、ウランやトリウムなど他の主要元素の抽出時に製品別として生産されます。企業の営業活動の大部分は中国にあり、その他の企業は米国、オーストラリア、カナダに拠点を置いています。
中国のレアアース産業は国有企業が完全に支配しており、中国政府の市場統合計画により、国有企業の役割はますます強くなると予想されています。M&Aや新たな生産能力の拡大が、市場の主要プレーヤーが採用する主要な戦略の1つです。レアアース価格が不安定なため、主要プレーヤーは激しい取引上の思惑にさらされています。
レアアース市場における企業の競争力を決定する上で大きな役割を果たす要因は、量的な資源ベース、質的な資源ベース、採掘および抽出技術における技術的優位性、連邦政府の優遇措置へのアクセス、研究開発の専門知識、顧客範囲と垂直統合、合弁事業および戦略的パートナーシップの程度、事業に課せられる環境規制、事業国の貿易障壁、専門知識および熟練労働力の利用可能性などです。
市場力学
風力発電用のダイレクトドライブタービンの使用量増加により、レアアースの市場シェアが上昇。
風力エネルギー生産用のダイレクトドライブタービンの使用量増加が、レアアースの市場シェアを押し上げています。
風力エネルギーは、発電のための費用対効果が高く、クリーンなソリューションとなっています。これは、再生不可能な燃料に代わるクリーンなソリューションと呼ばれています。さらに、風力発電所は、温室効果ガスの排出を抑えながら電力を生成する代替手段を提供します。風力発電は、連邦政府による生産奨励策や排出規制が強化されているため、今後も市場の拡大が見込まれています。
風力発電機には、発電のために大型のギアボックスが使用されています。ダイレクトドライブ永久磁石発電機は、その効率性とメンテナンスのダウンタイムの少なさから、従来のギア駆動のタービンに取って代わります。ダイレクトドライブタービンの中には、ギア駆動のタービンに比べて25~30%効率が高いものもあります。
一般的な大型風力発電機には、ボロン、鉄、ディディミウムの合金でできた高強度磁石が2トン近く必要です。MWのタービンには約半トンの永久磁石が使用され、さらにプラセオジム、ジスプロシウム、ネオジムの混合物であるディディミウム金属を150~200kg使用する必要があります。
2019年時点の風力発電設備容量は650.8GW、2019年に59.7GW追加、世界の風力専門家をリード。
中国や欧州での積極的な拡張活動により、シェアは8%に上昇すると予想されます。中国は、2020年までに風力発電容量を200GWに引き上げる計画を発表しました。この需要は主にダイレクトドライブタービンで、2020年までに世界で生産されるネオジムおよびプラセオジム金属の全供給量を消費することになります。
需給ギャップと代替材料の台頭は、レアアースの成長にとって大きな課題的な雰囲気を作り出しています。
レアアースの世界の供給は、特定の地域に大きく集中している一方で、需要は世界中に広く広がっています。その結果、レアアース酸化物を世界中のさまざまな最終使用産業に到達させるために、貿易が重要な役割を担っています。現在の生産は主に米国と中国に限定されており、その他の地域ではほとんど生産されていません。
これらの国では、限られた数の採掘場に供給が過度に依存しているため、生産が中断されると価格が大きく変動し、さまざまな繊細な最終用途への供給が困難になることがよくあります。環境問題、連邦政府の割り当て、生産コストの上昇により、これらの国々では小規模な採掘場が閉鎖されることがよくあります。
これは主要な輸入国への供給と輸出の途絶につながり、輸入国はリサイクルに頼るか、代替可能な材料に切り替えることになります。例えば、ニッケル、クロム、マンガンで改質したチタンやバナジウムは、ニッケル水素電池のレアアースの代替金属として使用することができます。さらに、埋蔵量の商業的な開発にはタイムラグがあるため、最終用途の需要の急増が供給の増加を上回っています。このため、代替可能な材料について真剣に検討する必要があります。
COVID-19の影響分析
COVID-19の大流行により、製造業が閉鎖されたため、世界のレアアース市場はわずかに減少しました。世界のいくつかの国では、COVID-19の流行期間中に生産活動が制限されました。さらに、2020年4月から6月にかけての低需要により、電子機器や自動車の成長が低下しました。国際エネルギー機関の発表によると、2020年1月から4月のCOVID-19パンデミック期間中、自動車の販売は2019年と比較して年間で15%縮小し、乗用車および小型商用車の電気販売も2019年の水準と比較して大きく減少しました。
また、2020年8月には、複数の大手メーカーが電子機器や電気自動車などの生産を開始したため、レアアースの需要がやや増加しました。大手メーカーは原料の供給不足に直面していました。さらに、いくつかの機関、学校、大学がオンライン授業にシフトし、スマートフォンの需要を推進したため、発展途上国における需要の急増により、スマートフォン、スピーカーなどの携帯電子機器の販売が増加し、需要が急激に増加しています。
目次
第1章 レアアースの世界市場調査手法と調査範囲
- 調査手法
- 調査目的および調査範囲
第2章 レアアースの世界市場-市場の定義と概要
第3章 レアアースの世界市場- エグゼクティブサマリー
- タイプ別市場内訳
- 供給元別市場内訳
- 用途別市場内訳
- エンドユーザー別市場内訳
- 地域別市場内訳
第4章 レアアースの世界市場-市場力学
- 市場影響要因
- 促進要因
- 風力発電用ダイレクトドライブタービンの使用量増加により、レアアースの市場シェアが上昇
- 抑制要因
- 需給ギャップと代替材料の台頭が、レアアースの成長に大きな影響を及ぼしています。
- ビジネスチャンス
- 影響分析
- 促進要因
第5章 レアアースの世界市場-産業分析
- ポーターのファイブフォース分析
- サプライチェーン分析
- 価格設定分析
- 規制分析
第6章 レアアースの世界市場-COVID-19分析
- COVID-19の市場分析
- COVID-19市場参入前のシナリオ
- COVID-19の現在の市場シナリオ
- COVID-19の後、または将来のシナリオ
- COVID-19の中での価格ダイナミクス
- 需要-供給スペクトラム
- パンデミック時の市場に関連する政府の取り組み
- メーカーの戦略的な取り組み
- まとめ
第8章 レアアースの世界市場-供給元別
- バストナサイト
- ロパライト
- モナザイト
- レアアースラテライト
- ゼノタイム
- その他
第9章 レアアースの世界市場-用途別
- 磁石
- 触媒
- 金属合金
- 研磨
- セラミックス/ガラス
- 添加剤
- その他
第10章 レアアースの世界市場- エンドユーザー別
- 工業用
- 建築・建設
- 自動車用
- ガラス
- 蛍光灯
- エレクトロニクス
- スマートフォン
- 読者
- 拡声器
- ポータブルコンピューター
- カメラ
- その他
- その他
第11章 レアアースの世界市場-地域別
- 北米
- 米国
- カナダ
- メキシコ
- 欧州
- ドイツ
- 英国
- フランス
- イタリア
- スペイン
- その他欧州
- 南米
- ブラジル
- アルゼンチン
- その他の南米地域
- アジア太平洋地域
- 中国
- インド
- 日本
- 韓国
- その他アジア太平洋地域
- 中東・アフリカ地域
第12章 レアアースの世界市場- 競争情勢
- 競合シナリオ
- 市況/シェア分析
- M&A(合併・買収)分析
第13章 レアアースの世界市場-企業プロファイル
- China Rare Earth Holdings Limited
- 企業概要
- エンドユーザー向けポートフォリオと説明
- 主なハイライト
- 財務概要
- Arafura Resources Limited
- Lynas Corporation, Ltd.
- Avalon Advanced Materials Inc.
- Alkane Resources Ltd
- Shin-Etsu Chemical Co. Ltd
- Canada Rare Earth Corporation
- Iluka Resources Ltd
- Eutectix LLC
- Rare Element Resources Ltd.
第14章 レアアースの世界市場-重要考察
第15章 レアアースの世界市場-DataM
Market Overview
Rare Earth Elements Market size was worth US$ XX million in 2022 and is estimated to show significant growth by reaching up to US$ XX million by 2030, growing at a CAGR of 9.4% within the forecast period (2023-2030).
Rare earth elements are seventeen metals and compounds grouped in the periodic table with specific properties. Rare earth is either produced as primary products during extraction or as by-products during the extraction of some other principal elements such as uranium and thorium. Most of the firms' operating activities are located in China, with other firms based out of U.S., Australia and Canada.
State-owned firms enjoy complete dominance over the rare earth industry in China and with the Chinese government's market consolidation plan, it is expected that the state's role to get stronger. Mergers & acquisitions and new capacity expansions are among the key strategies adopted by the market's major players. Because of volatile rare earth prices, key players are subject to intense trade speculation.
The factors that play a major role in determining the competitive edge of a company in the rare earth market are: resource base in terms of volume, resource base in terms of quality, technological edge in mining and extraction techniques, access to federal incentives, R&D expertise, customer reach and the extent of vertical integration, joint ventures and strategic partnerships, environmental regulations imposed on operations, trade barriers in the country of operations and expertise and availability of skilled manpower.
Market Dynamics
Increasing usage of direct-drive turbines for wind energy production drives the market share for rare earth elements.
Increasing usage in direct-drive turbines for wind energy production is driving the market share for rare earth elements
Wind energy has become a cost-effective and clean solution for electricity generation. It is termed the clean alternative to non-renewable fuels. Furthermore, wind energy farms provide an alternative method to generate electricity with reduced emission of greenhouse gases. Wind energy generation is expected to show incremental market growth in the future because of growing federal incentives for production and regulations on emissions.
Wind turbines involve the usage of large gearboxes for electricity generation. Direct-drive permanent magnet generators replace conventional gear-driven turbines because of the latter's efficiency and lower maintenance downtime. Some direct-drive turbines are 25-30% more efficient than gear-driven turbines.
A typical large wind turbine requires nearly two tons of high-strength magnets, usually alloys of boron, iron and didymium metal. Each MW of turbine uses about half a ton of permanent magnet and, in turn, involves using 150-200 kg of didymium metal, a mixture of praseodymium, dysprosium and neodymium.
The installed wind power capacity as of 2019 stands at 650.8 GW, 59.7 GW added in 2019, Leading wind experts from around the world.
The share is expected to rise to 8% because of aggressive expansion activities in China and Europe. China announced plans to raise its wind power capacity to 200 GW by 2020. This demand primarily comprises direct-drive turbines and will consume the entire supply of neodymium and praseodymium metal produced worldwide by 2020.
Demand-supply outages and the rise of substitutable materials create a huge challenging atmosphere for the growth of rare earth elements
The global supply of rare earth is heavily concentrated in certain geographies while the demand is widely spread worldwide. As a result, trade plays a vital role in reaching rare earth oxides to various end-use industries worldwide. The current production is mainly restricted to U.S. and China, with little produced in other geographies.
As a result of supply disruption overdependence on a limited number of mining sites in these countries, any disruption to production often results in huge price fluctuations and challenges the availability of various sensitive end-uses. Environmental concerns, enactment of federal quotas and rising production costs often result in the closure of small mining sites in these countries.
It leads to the disruption of supplies and exports to key importing countries, which either rely on recycling or switch to substitutable materials. For instance, titanium and vanadium modified with nickel, chromium and manganese can be used as substitutable metals for rare earth in NiMH batteries. In addition to the above, the rapidly growing end-use demand outpaces supply growth due to a lag period involved in the commercial development of reserves. This rising deficit only propels a serious evaluation of substitutable materials.
COVID-19 Impact Analysis
The global rare earth elements market has slightly declined due to the COVID-19 pandemic, as manufacturing industries were closed. Several countries globally have restricted production activities during the COVID-19 pandemic. Further, the growth of electronic devices and automobiles declined due to low demand from April to June 2020. As per International Energy Agency, during January to April 2020 COVID-19 pandemic period, the sale of cars contracted by 15% over the year compared to 2019, while electric sales for passenger and light-duty commercial vehicles also declined broadly as compared to 2019 levels.
In addition, the demand for rare earth elements slightly increased in August 2020 as several leading manufacturers started producing electronic devices, electric vehicles, etc. The leading manufacturers were facing a lack in the supply of raw materials. Further demand is increased suddenly due to the increasing sale of portable electronic devices such as smartphones, speakers, etc., due to a surge in demand in developing countries as several institutions, schools and colleges shifted into online classes, which have propelled the demand for smartphones.
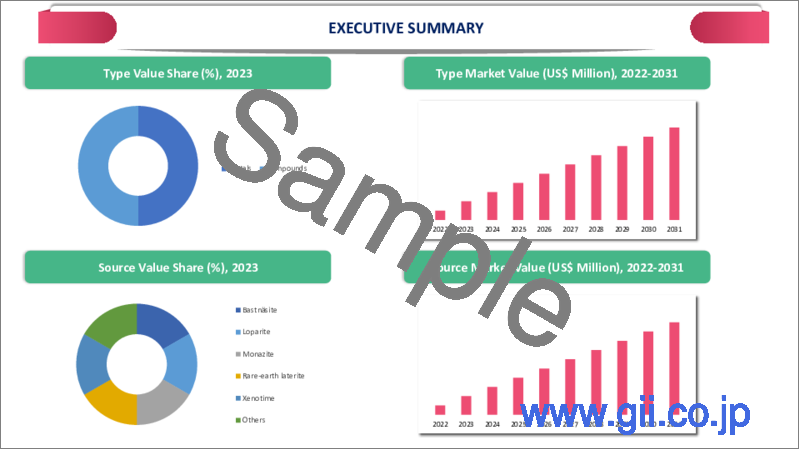
Segment Analysis
The global rare earth elements market is segmented by type, source, application, end-user and region.
The growing demand for compounds in applications such as catalysts, polishing agents, phosphors and magnets in various growing end-use industries is boosting the segment's growth
The global rare earth elements market is segmented based on type: metal and compounds. The compounds dominate the market of the mentioned types. Similar to rare earth metals, rare earth compounds are also found in niche volumes in the earth, which may or may not have rare earth metals. Rare earth elements are also used in compounds in various commercial applications. Cerium compounds, carbonates, chlorides and oxides are rare earth compounds. These compounds are used as catalysts, polishing agents, phosphors and magnets in various growing end-use industries
Compounds evolved as the largest product category in the global rare earth elements market, accounting for a share of 89.22% of total sales revenue in 2020. The rapidly growing sales of electronic components led to the growth of rare earth compounds across the globe. Further, the evolution of personal wearable electronics led to new growth avenues in rechargeable batteries, driving the need for rare earth compounds.
Geographical Analysis
The growing demand for rare earth can be attributed to the expanding automotive industry in North America
The growing demand for rare earth can be attributed to the expanding automotive industry in North America. For example, in 2018, Tesla announced using neodymium in its Model 3 Long Range cars. The introduction of rare earth metals is anticipated to spur the demand for neodymium over the forecast period.
U.S. dominates the North America rare earth Elements (MIM) market. The U.S. is the second largest consumer of rare earth metals after China. These elements are predominantly used in catalyst compositions as catalytic converters and refinery applications.
The country has significant unexploited reserves and relies on production from the Mountain Pass mine in California and on imports that cater to domestic demand. U.S. Department of Energy reported that in 2018 U.S. imported all of the REEs it consumes, about 80% of which come from China. In 2018, the DOE informed that the nation imported around US$160 million rare earth compounds and metals, excluding some such as scandium and yttrium.
However, the real economic cost of REEs is so deceptive that the nation imports nearly all of its REEs in the form of finished goods rather than raw materials. When put in these terms, U.S. Department of Energy projected that U.S. imported US$ 2.6 trillion of finished goods containing REEs in 2018.
Competitive Landscape
The global rare earth elements market is highly competitive with local and global key players. The key players contributing to the market's growth are China Rare Earth Holdings Limited, Arafura Resources Limited, Lynas Corporation, Ltd., Avalon Advanced Materials Inc., Alkane Resources Ltd, Shin-Etsu Chemical Co. Ltd, Canada Rare Earth Corporation, Iluka Resources Ltd., Eutectix LLC, Rare Element Resources Ltd and others.
The major companies are adopting several growth strategies, such as product launches, acquisitions and collaborations, contributing to the global growth of the rare earth elements market.
For instance, in December 2019, USA Rare Earth and Australian Rare Earth Company Arafura Resources entered a strategic relationship. Under a letter of intent, Arafura will send Heavy Rare Earth (HREE) concentrate from Nolans for processing at USA Rare Earth's Colorado pilot plant.
LYNAS CORPORATION, LTD.
Overview: Lynas is one of the world's largest producers of rare earth materials. It has two major operations: a mining and concentration plant at Mount Weld, Western Australia and a refining facility at Kuantan, Malaysia. The company's rare earth oxides are mined and initially processed at their Mt Weld Concentration Plant. Lynas Rare Earths are used in many high-tech and future-facing industries, including electronics, wind turbines, catalytic converters and electric and hybrid motor vehicles.
Product Portfolio: Rare earth products: Neodymium and Praseodymium (NdPr) used in magnets, Lanthanum (La), Cerium (Ce) and Mixed Heavy Rare Earths (SEG) are the high-quality products included in their product portfolio.
Key Development
On January 2021, Lynas Corporation inked an agreement with U.S. Government to build a light rare earth separation plant in Texas. The plant will process material directly sourced from Lynas' cracking and leaching plant under development in Western Australia. It is expected to produce nearly 5000 tonnes of rare earth products annually, including around 1250 tonnes of neodymium-praseodymium (NdPr).
Why Purchase the Report?
- Visualize the global rare earth elements market segmentation by type, source, application, end-user and region, highlighting key commercial assets and players.
- Identify commercial opportunities in the rare earth elements market by analyzing trends and co-development deals.
- Excel data sheet with thousands of global rare earth elements market-level 4/5 segmentation points.
- PDF report with the most relevant analysis cogently put together after exhaustive qualitative interviews and in-depth market study.
- Product mapping in excel for the key product of all major market players
The global rare earth elements market report would provide approximately 61 market data tables, 55 figures and 212 pages.
Target Audience 2022
- Service Providers/ Buyers
- Residential
- Research Laboratory
- Restaurant Business
- Energy & Utilities Companies
- Distributors
Table of Contents
1. Global Rare Earth Elements Market Methodology and Scope
- 1.1. Research Methodology
- 1.2. Research Objective and Scope of the Report
2. Global Rare Earth Elements Market - Market Definition and Overview
3. Global Rare Earth Elements Market - Executive Summary
- 3.1. Market Snippet by Type
- 3.2. Market Snippet by Source
- 3.3. Market Snippet by Application
- 3.4. Market Snippet by End-User
- 3.5. Market Snippet by Region
4. Global Rare Earth Elements Market-Market Dynamics
- 4.1. Market Impacting Factors
- 4.1.1. Drivers
- 4.1.1.1. Elevated usage in direct-drive turbines for wind energy production is driving the market share for rare earth elements
- 4.1.1.2. XX
- 4.1.2. Restraints
- 4.1.2.1. Demand-supply outages and the rise of substitutable materials create a huge challenging atmosphere for the growth of rare earth elements
- 4.1.2.2. XX
- 4.1.3. Opportunity
- 4.1.3.1. XX
- 4.1.4. Impact Analysis
- 4.1.1. Drivers
5. Global Rare Earth Elements Market - Industry Analysis
- 5.1. Porter's Five Forces Analysis
- 5.2. Supply Chain Analysis
- 5.3. Pricing Analysis
- 5.4. Regulatory Analysis
6. Global Rare Earth Elements Market - COVID-19 Analysis
- 6.1. Analysis of COVID-19 on the Market
- 6.1.1. Before COVID-19 Market Scenario
- 6.1.2. Present COVID-19 Market Scenario
- 6.1.3. After COVID-19 or Future Scenario
- 6.2. Pricing Dynamics Amid COVID-19
- 6.3. Demand-Supply Spectrum
- 6.4. Government Initiatives Related to the Market During Pandemic
- 6.5. Manufacturers Strategic Initiatives
- 6.6. Conclusion
7. Global Rare Earth Elements Market - By Type
- 7.1. Introduction
- 7.1.1. Market Size Analysis and Y-o-Y Growth Analysis (%), By Type
- 7.1.2. Market Attractiveness Index, By Type
- 7.1.3. Metals *
- 7.1.4. Introduction
- 7.1.5. Market Size Analysis and Y-o-Y Growth Analysis (%)
- 7.1.6. Cerium
- 7.1.7. Erbium
- 7.1.8. Europium
- 7.1.9. Gadolinium
- 7.1.10. Holmium
- 7.1.11. Lanthanum
- 7.1.12. Neodymium
- 7.1.13. Praseodymium
- 7.1.14. Promethium
- 7.1.15. Samarium
- 7.1.16. Scandium
- 7.1.17. Terbium
- 7.1.18. Thulium
- 7.1.19. Ytterbium
- 7.1.20. Yttrium
- 7.1.21. Others
- 7.2. Compounds
- 7.2.1. Cerium Compounds
- 7.2.2. Carbonates
- 7.2.3. Chlorides
- 7.2.4. Oxides
- 7.2.5. Others
8. Global Rare Earth Elements Market - By Source
- 8.1. Introduction
- 8.1.1. Market Size Analysis and Y-o-Y Growth Analysis (%), By Source
- 8.1.2. Market Attractiveness Index, By Source
- 8.2. Bastnasite *
- 8.2.1. Introduction
- 8.2.2. Market Size Analysis and Y-o-Y Growth Analysis (%)
- 8.3. Loparite
- 8.4. Monazite
- 8.5. Rare-earth laterite
- 8.6. Xenotime
- 8.7. Others
9. Global Rare Earth Elements Market - By Application
- 9.1. Introduction
- 9.1.1. Market Size Analysis and Y-o-Y Growth Analysis (%), By Application
- 9.1.2. Market Attractiveness Index, By Application
- 9.2. Magnets *
- 9.2.1. Introduction
- 9.2.2. Market Size Analysis and Y-o-Y Growth Analysis (%)
- 9.3. Catalyst
- 9.4. Metals Alloys
- 9.5. Polishing
- 9.6. Ceramics/Glass
- 9.7. Additives
- 9.8. Others
10. Global Rare Earth Elements Market - By End-User
- 10.1. Introduction
- 10.1.1. Market Size Analysis and Y-o-Y Growth Analysis (%), By End-User
- 10.1.2. Market Attractiveness Index, By End-User
- 10.2. Industrial *
- 10.2.1. Introduction
- 10.2.2. Market Size Analysis and Y-o-Y Growth Analysis (%)
- 10.3. Building and Construction
- 10.4. Automotive
- 10.5. Glass
- 10.6. Fluorescent Lighting
- 10.7. Electronics
- 10.7.1. Smart Phones
- 10.7.2. Readers
- 10.7.3. Loudspeaker
- 10.7.4. Portable Computers
- 10.7.5. Cameras
- 10.7.6. Others
- 10.8. Others
11. Global Rare Earth Elements Market - By Region
- 11.1. Introduction
- 11.1.1. Market Size Analysis and Y-o-Y Growth Analysis (%), By Region
- 11.1.2. Market Attractiveness Index, By Region
- 11.2. North America
- 11.2.1. Introduction
- 11.2.2. Key Region-Specific Dynamics
- 11.2.3. Market Size Analysis and Y-o-Y Growth Analysis (%), By Type
- 11.2.4. Market Size Analysis and Y-o-Y Growth Analysis (%), By Source
- 11.2.5. Market Size Analysis and Y-o-Y Growth Analysis (%), By Application
- 11.2.6. Market Size Analysis and Y-o-Y Growth Analysis (%), By End-User
- 11.2.7. Market Size Analysis and Y-o-Y Growth Analysis (%), By Country
- 11.2.7.1. U.S.
- 11.2.7.2. Canada
- 11.2.7.3. Mexico
- 11.3. Europe
- 11.3.1. Introduction
- 11.3.2. Key Region-Specific Dynamics
- 11.3.3. Market Size Analysis and Y-o-Y Growth Analysis (%), By Type
- 11.3.4. Market Size Analysis and Y-o-Y Growth Analysis (%), By Source
- 11.3.5. Market Size Analysis and Y-o-Y Growth Analysis (%), By Application
- 11.3.6. Market Size Analysis and Y-o-Y Growth Analysis (%), By End-User
- 11.3.7. Market Size Analysis and Y-o-Y Growth Analysis (%), By Country
- 11.3.7.1. Germany
- 11.3.7.2. UK
- 11.3.7.3. France
- 11.3.7.4. Italy
- 11.3.7.5. Spain
- 11.3.7.6. Rest of Europe
- 11.4. South America
- 11.4.1. Introduction
- 11.4.2. Key Region-Specific Dynamics
- 11.4.3. Market Size Analysis and Y-o-Y Growth Analysis (%), By Type
- 11.4.4. Market Size Analysis and Y-o-Y Growth Analysis (%), By Source
- 11.4.5. Market Size Analysis and Y-o-Y Growth Analysis (%), By Application
- 11.4.6. Market Size Analysis and Y-o-Y Growth Analysis (%), By End-User
- 11.4.7. Market Size Analysis and Y-o-Y Growth Analysis (%), By Country
- 11.4.7.1. Brazil
- 11.4.7.2. Argentina
- 11.4.7.3. Rest of South America
- 11.5. Asia-Pacific
- 11.5.1. Introduction
- 11.5.2. Key Region-Specific Dynamics
- 11.5.3. Market Size Analysis and Y-o-Y Growth Analysis (%), By Type
- 11.5.4. Market Size Analysis and Y-o-Y Growth Analysis (%), By Source
- 11.5.5. Market Size Analysis and Y-o-Y Growth Analysis (%), By Application
- 11.5.6. Market Size Analysis and Y-o-Y Growth Analysis (%), By End-User
- 11.5.7. Market Size Analysis and Y-o-Y Growth Analysis (%), By Country
- 11.5.7.1. China
- 11.5.7.2. India
- 11.5.7.3. Japan
- 11.5.7.4. South Korea
- 11.5.7.5. Rest of Asia-Pacific
- 11.6. Middle East and Africa
- 11.6.1. Introduction
- 11.6.2. Key Region-Specific Dynamics
- 11.6.3. Market Size Analysis and Y-o-Y Growth Analysis (%), By Type
- 11.6.4. Market Size Analysis and Y-o-Y Growth Analysis (%), By Source
- 11.6.5. Market Size Analysis and Y-o-Y Growth Analysis (%), By Application
- 11.6.6. Market Size Analysis and Y-o-Y Growth Analysis (%), By End-User
12. Global Rare Earth Elements Market - Competitive Landscape
- 12.1. Competitive Scenario
- 12.2. Market Positioning/Share Analysis
- 12.3. Mergers and Acquisitions Analysis
13. Global Rare Earth Elements Market- Company Profiles
- 13.1. China Rare Earth Holdings Limited*
- 13.1.1. Company Overview
- 13.1.2. End-User Portfolio and Description
- 13.1.3. Key Highlights
- 13.1.4. Financial Overview
- 13.2. Arafura Resources Limited
- 13.3. Lynas Corporation, Ltd.
- 13.4. Avalon Advanced Materials Inc.
- 13.5. Alkane Resources Ltd
- 13.6. Shin-Etsu Chemical Co. Ltd
- 13.7. Canada Rare Earth Corporation
- 13.8. Iluka Resources Ltd
- 13.9. Eutectix LLC
- 13.10. Rare Element Resources Ltd.
LIST NOT EXHAUSTIVE
14. Global Rare Earth Elements Market - Premium Insights
15. Global Rare Earth Elements Market - DataM
- 15.1. Appendix
- 15.2. About Us and Services
- 15.3. Contact Us