|
|
市場調査レポート
商品コード
1696298
再生可能エネルギー証書の世界市場:2025年~2032年Global Renewable Energy Certificate Market - 2025-2032 |
||||||
|
|
|||||||
カスタマイズ可能
適宜更新あり
|
|||||||


| 再生可能エネルギー証書の世界市場:2025年~2032年 |
|
出版日: 2025年03月25日
発行: DataM Intelligence
ページ情報: 英文 180 Pages
納期: 即日から翌営業日
|

- 全表示
- 概要
- 目次
世界の再生可能エネルギー証書の市場規模は、2024年に141億2,000万米ドルに達し、2032年には1,127億米ドルに達すると予測され、予測期間の2025年~2032年のCAGRは26.32%となる見込みです。
気候変動の緩和と温室効果ガス(GHG)排出量削減の必要性により、世界のエネルギー情勢は劇的に変化しています。再生可能エネルギー証書(REC)は、この変化における重要な手段として登場し、使用量を追跡しながら再生可能エネルギー供給を奨励する市場ベースのソリューションを提供しています。この徹底的な分析では、世界のREC市場の特徴について調査し、その発展、セグメンテーション、規制の枠組み、主な競合他社、地域の洞察、市場の課題、今後の動向などを明らかにしています。
再生可能エネルギー証書(REC)は、グリーンタグとして知られることもあり、再生可能エネルギー源から1メガワット時(MWh)の電力を生産することによる環境的・社会的利益を表しています。RECは、発電された物理的な電力とは区別され、独立した販売、取引、消費が可能です。この区別は、企業が直接電力を供給できなくても、持続可能なエネルギー利用へのコミットメントを示すための柔軟な枠組みを提供します。
アジア太平洋の新興市場がREC採用をリードしているとはいえ、まだ初期段階にある国もいくつかあります。しかし、インドや中国のような国々は、再生可能エネルギー目標にRECを組み込むことで、かなりの成果を上げています。この地域、特にインドでは、RECの取引量が増加しています。2024年1月にインドエネルギー取引所(IEX)で152万RECという記録的な取引が行われたことからもわかるように、インドの再生可能エネルギーへのコミットメントは明白であり、これは拡大するエネルギーニーズに合致しています。
世界各国の政府は、再生可能エネルギーとカーボン・オフセットの利用を義務付ける政策を打ち出しています。EUの再生可能エネルギー指令や米国のクリーンパワープランなどの政策は、RECの需要拡大に重要な役割を果たしています。これらの規制は、エネルギー生産者に対し、RECを発行することで再生可能エネルギー目標を達成していることを証明するよう求めています。アジア太平洋では、国際再生可能エネルギー証書(I-REC)と世界再生可能エネルギー取引可能証書(TIGR)が重要な例です。
国際再生可能エネルギー証書(I-REC)基準は、オランダに本部を置くI-REC基準財団によって監督されています。I-REC基準は、再生可能エネルギーの生産と消費を認証するための世界の枠組みを提供します。I-REC規格は、再生可能エネルギーの生産と消費を認証するための世界の枠組みを提供し、再生可能エネルギーの主張が現地の規制や市場の要求に従って一貫してチェックされ、検証されることを保証するものです。
よりクリーンで再生可能なエネルギー源への世界のエネルギー転換が進むにつれて、RECに対する需要も当然高まります。これは、化石燃料から再生可能エネルギー発電へと転換する市場において特に当てはまり、RECは、エネルギーが持続可能な形で生成されたことを証明する役割を果たすからです。例えば、中国の再生可能エネルギー部門、特に太陽光発電技術は大きく進歩しています。中国は、2060年までにカーボンニュートラルの目標を達成する予定です。
Googleは、再生可能エネルギー企業のIntersect Powerおよび投資会社のTPG Rise Climateと協力し、複数のギガワット規模のデータセンターに電力を供給するのに十分な再生可能エネルギーを創出することを発表しました。再生可能エネルギーへの投資総額は200億米ドルと予想され、Intersect Powerはすでに最初のプロジェクトに資金を提供しています。戦略的な3者協力の一環として、Intersect Powerは新たな再生可能エネルギー・インフラを構築し、Googleは工業団地に新設されるデータセンター・キャンパスのアンカーテナントとして電力の引き取りを確保します。この野心的なプロジェクトは、米国全土のギガワット級のデータセンター容量に再生可能エネルギーを供給するもので、段階的に実施されます。初期段階は2026年までに稼動し、2027年までに完全完成する予定です。
RECビジネスにとって最も重要な問題のひとつは、地域間の統一性と標準化の欠如です。例えば、世界中で利用されているi-RECシステムは、必ずしも各国の認証システムに対応しておらず、国境を越えたビジネスに困難を引き起こしています。
調和がとれていないため、取引コストや管理負担が増大します。REC価格は、需要の変動、政策の変更、再生可能エネルギーの利用可能性などの要因によって、非常に変動しやすいです。この不確実性は、企業にとって長期的な計画を困難にし、潜在的な買い手を思いとどまらせる可能性があります。
当レポートでは、世界の再生可能エネルギー証書市場について調査し、市場の概要とともに、タイプ別、証書別、エネルギー源別、エンドユーザー別、地域別動向、競合情勢、および市場に参入する企業のプロファイルなどを提供しています。
目次
第1章 調査手法と範囲
第2章 定義と概要
第3章 エグゼクティブサマリー
第4章 市場力学
- 影響要因
- 促進要因
- 抑制要因
- 機会
- 影響分析
第5章 業界分析
- ポーターのファイブフォース分析
- サプライチェーン分析
- 価格分析
- 規制分析
- DMIオピニオン
第6章 タイプ別
- コンプライアンスREC
- 自主的REC
第7章 証明書別
- I-REC
- TIGR
- GEC
第8章 エネルギー源別
- 太陽光REC
- 風力発電REC
- 水力発電REC
- その他
第9章 エンドユーザー別
- 工業
- 商業
- 住宅
- 政府
第10章 地域別
- 北米
- 米国
- カナダ
- メキシコ
- 欧州
- ドイツ
- 英国
- フランス
- イタリア
- スペイン
- その他
- 南米
- ブラジル
- アルゼンチン
- その他
- アジア太平洋
- 中国
- インド
- タイ
- ベトナム
- 台湾
- シンガポール
- マレーシア
- インドネシア
- 日本
- オーストラリア
- フィリピン
- カンボジア
- その他
- 中東・アフリカ
第11章 競合情勢
- 競合シナリオ
- 市場ポジショニング/シェア分析
- 合併と買収の分析
第12章 企業プロファイル
- ECOHZ
- Green-e Energy
- APX Inc.
- ENGIE
- I-REC standard
- RECS International
- Statkraft
- The Green Certificate Company Limited
- Eneco Energy Trade
- Shell Energy
- Climate Bridge(Shanghai)Ltd.
- Tata Power Renewable Energy Ltd.
- Adani Green Energy
- INDIAN ENERGY EXCHANGE LIMITED
- National Renewable Energy Certification(T-REC)Center
第13章 付録
Global Renewable Energy Certificate Market reached US$ 14.12 billion in 2024 and is expected to reach US$ 112.70 billion by 2032, growing with a CAGR of 26.32% during the forecast period 2025-2032.
The global energy landscape is changing dramatically, driven by the need to mitigate climate change and reduce greenhouse gas (GHG) emissions. Renewable Energy Certificates (RECs) have emerged as a vital instrument in this shift, providing a market-based solution to encourage renewable energy supply while tracking usage. This thorough analysis investigates the characteristics of the global REC market, including its evolution, segmentation, regulatory frameworks, main competitors, regional insights, market challenges and future trends.
Renewable Energy Certificates (RECs), sometimes known as green tags, represent the environmental and social benefits of producing one megawatt-hour (MWh) of electricity from renewable energy sources. RECs are distinct from the physical power generated, allowing for independent sale, trade or consumption. This distinction provides a flexible framework for enterprises to demonstrate their commitment to sustainable energy use, even if they cannot directly supply it.
While Asia-Pacific's emerging markets are leading the way in REC adoption, several countries are still in the early stages. However, countries like India and China are making considerable gains in incorporating RECs into their renewable energy targets. The region, particularly India, is seeing an increase in REC trade volumes. India's commitment to renewable energy is obvious, as evidenced by record-breaking transactions of 1.52 million RECs on the Indian Energy Exchange (IEX) in January 2024, which align with its expanding energy needs.
Dynamics
Rising Government Regulations
Governments around the world have put in place policies requiring the use of renewable energy and carbon offsets. Policies such as the EU Renewable Energy Directive and U.S. Clean Power Plan have played an important role in increasing demand for RECs. The restrictions compel energy producers to certify they're reaching renewable energy targets by issuing RECs. In Asia-Pacific, the International Renewable Energy Certificate (I-REC) and the Tradable Instrument for Global Renewables (TIGR) are significant examples.
The International Renewable Energy Certificate (I-REC) Standard is overseen by the I-REC Standard Foundation, based in the Netherlands. The I-REC Standard provides a global framework for certifying renewable energy production and consumption. It contributes to ensuring that renewable energy claims are consistently checked and validated in accordance with local regulations and market requirements.
Growing Energy Transition
As the world's energy shift to cleaner, renewable sources continue, the demand for RECs naturally increases. This is especially true in markets switching from fossil fuels to renewable energy, as RECs serve as verification that energy was generated sustainably. For instance, China's renewable energy sector, particularly PV technology, is making substantial progress. China is solidly on track to achieve its carbon neutrality goals by 2060.
Google has announced a cooperation with renewable energy company Intersect Power and investment firm TPG Rise Climate to create enough renewable energy to power several gigawatt-scale data centers. The total investment in renewable energy is projected at US$ 20 billion, with Intersect having already funded the first project. As part of the strategic three-party collaboration, Intersect Power will create new renewable energy infrastructure, with Google ensuring power offtake as the anchor tenant for newly built data centre campuses in co-located industrial parks. This ambitious project seeks to provide renewable energy for gigawatts of data centre capacity across U.S. and will be carried out in phases. The initial phase is planned to become operational by 2026, with full completion by 2027.
Complexity and Market Volatility
One of the most significant issues for the RECs business is a lack of uniformity and standardization between regions. For example, the I-REC system utilized worldwide does not always correspond to national certification systems, causing difficulties in cross-border business.
The lack of harmonization raises transaction costs and administrative load. REC prices can be highly volatile, based on factors such as demand fluctuations, policy changes and the availability of renewable energy. This uncertainty can make long-term planning difficult for businesses and dissuade potential buyers
Segment Analysis
The global renewable energy certificate market is segmented based on type, certificate, energy source, end-user and region.
Corporate Sustainability Commitments Drives Voluntary REC Segment
The voluntary REC segment is expected to dominate the global market in 2024. The voluntary REC industry is expanding rapidly, driven by corporate sustainability commitments and net-zero ambitions. Companies like Google, Microsoft and Amazon have established high renewable energy objectives, driving REC purchases in this sector.
In 2022, around 240 million RECs retired in voluntary markets, vs approximately 390 million RECs in compliance markets. The voluntary market encompasses a wide range of items, buyers and market situations. Different products package RECs and power differently, catering to different types of clients, ranging from residential families making relatively small buys to non-residential buyers making huge purchases.
Geographical Penetration
Production and Consumer Trends in North America
North America, particularly plays a dominant role in the global renewable energy certificate market, driven by both production and consumption factors. The region is primarily driven by a robust regulatory framework and government requirements for renewable energy. U.S. and Canada are the market leaders in terms of both issuance and acquisition of RECs.
Voluntary RECs are increasing popularity in U.S. due to business sustainability goals and tax incentives, such as the Inflation Reduction Act of 2022. This trend is especially noticeable in the data centre industry, where corporations are aggressively pursuing green Power Purchase Agreements (PPAs). Mexico's REC market is stable, with regulators aiming to entice smaller generators with standard changes and rate reductions. This program is projected to promote the development of International Renewable Energy Certificates (I-RECs), especially in sectors like retail and industry that want to certify their renewable energy use.
Growing Energy Transition in Asia-Pacific
Asia-Pacific is expected to be the fastest-growing region in the global REC market. The Asia-Pacific region has experienced a significant transformation in its energy landscape over the past decade, marked by a robust shift towards renewable energy sources. This transition is not only altering the region's energy mix but also propelling the development and adoption of Renewable Energy Certificates (RECs) as mechanisms to certify and trade renewable energy generation.
The Philippines exemplifies this commitment. According to the Department of Energy, the country ascended to the 2nd spot in BloombergNEF's 2024 Climatescope Report, a significant rise from 20th place in 2021. This leap reflects the global community's growing confidence in the Philippines' dedication to clean energy transition and sustainable growth.
Vietnam has also made notable strides in renewable energy development. As of recent reports, hydropower accounts for approximately 44% of the country's energy generation, followed by oil and gas at 34% and coal at 19%. This distribution highlights Vietnam's substantial reliance on renewable sources, particularly hydropower, in its energy mix.
Competitive Landscape
The major global players in the market include ECOHZ, Green-e Energy, Green-e Energy, APX Inc., ENGIE, I-REC standard, RECS International, Statkraft, The Green Certificate Company Limited, Eneco Energy Trade, Shell Energy, Climate Bridge (Shanghai) Ltd., Tata Power Renewable Energy Ltd., Adani Green Energy, INDIAN ENERGY EXCHANGE LIMITED and National Renewable Energy Certification (T-REC) Center.
Asia-Pacific Renewable Energy Certificate (REC) market is growing rapidly, driven by increasing corporate demand for clean energy and supportive government policies. Countries across the region are expanding their REC frameworks to encourage renewable energy adoption and carbon reduction.
Advanced digital platforms are enhancing transparency and efficiency in REC trading, making it easier for businesses to meet sustainability goals. The market is also seeing increased participation from energy producers, utilities and large corporations seeking to offset emissions. With rising awareness and regulatory support, the REC market in Asia-Pacific is poised for continued expansion and integration into global sustainability initiatives.
Pricing Analysis
The pricing of Renewable Energy Certificates (RECs) in the global market is influenced by factors such as supply-demand dynamics, regulatory frameworks and the distinction between compliance and voluntary markets. In compliance markets like the U.S. RPS program and the EU's Guarantees of Origin (GO) system, prices are more stable but fluctuate based on mandated targets and market liquidity.
In voluntary markets, such as I-RECs in Asia and Latin America, prices vary significantly depending on corporate sustainability commitments and regional policy changes. Additionally, vintage-based pricing plays a role, with older RECs often trading at a discount compared to newer ones. The growing demand for RECs, driven by corporate net-zero goals and Scope 2 emissions reduction, continues to impact pricing, while factors like renewable project financing and geopolitical shifts also contribute to price volatility.
China: The pricing of Renewable Energy Certificates (RECs) in China is influenced by several factors, including government policies, supply-demand dynamics, corporate sustainability commitments and the dominance of state-owned enterprises in the renewable energy sector. The price of China's RECs fluctuates based on the type of renewable energy source, with wind and solar RECs generally priced higher than hydropower RECs due to differences in generation costs and technology maturity. China's hydro RECs were priced at US$ 0.30/MWh, while solar RECs were priced at US$ 0.80/MWh in 2023.
The increasing demand from multinational corporations looking to meet renewable energy targets under initiatives like RE100 has contributed to price adjustments, but concerns over double-counting, lack of transparency and limited third-party verification have kept some buyers hesitant, preventing price surges seen in more mature REC markets.
Sustainability Analysis
The Renewable Energy Certificate (REC) market plays a vital role in driving sustainability efforts globally by incentivizing renewable energy production, reducing carbon emissions and facilitating the energy transition. By purchasing RECs organizations directly fund renewable energy projects like wind, solar, hydro and biomass, increasing global renewable energy capacity.
Regulatory mandates like Renewable Portfolio Standards (RPS) drive demand in compliance REC markets, ensuring a stable framework. Voluntary markets grow as more corporations commit to sustainability goals and adopt Science-Based Targets or net-zero pledges. Emerging platforms simplify REC purchasing for small businesses and individuals, expanding market participation.
The government and private entities' significant investment in renewable energy, notably large-scale solar power facilities, is propelling industry expansion. For example, in April 2023, U.S. Department of Energy (DOE) announced a US$ 52 million financial commitment for a carefully selected collection of 19 projects. This includes US$ 10 million supplied from the Bipartisan Infrastructure Law, aimed at strengthening the domestic solar supply chain in US.
Blockchain and Transparency in REC Trading
The use of blockchain technology in conjunction with AI can increase the transparency and security of REC transactions. Blockchain technology can generate a decentralized and unchangeable record of all REC purchases and sales, lowering fraud and increasing trust in the certification process. This will also boost the transparency of renewable energy projects and assist track the actual production of renewable energy in real-time.
According to Silke Mooldijk, the corporate climate responsibility expert at the NewClimate Institute, if tech businesses do not disclose transparent information, consumers may be unable to understand the climatic impact of AI and move their behavior towards different models. Google recognizes that unbundled renewable energy certificates do not cut emissions and has begun replacing them with clean energy.
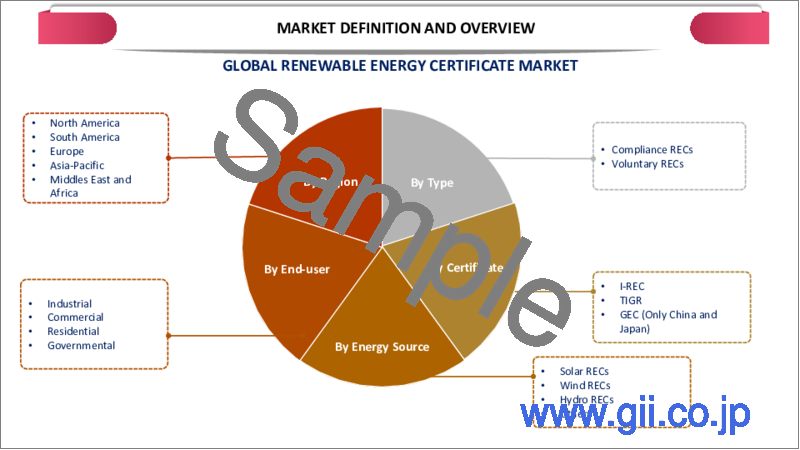
By Type
- Compliance RECs
- Voluntary RECs
By Certificate
- I-REC
- TIGR
- GEC
By Energy Source
- Solar RECs
- Wind RECs
- Hydro RECs
- Others
By End-User
- Industrial
- Commercial
- Residential
- Governmental
By Region
- North America
- US
- Canada
- Mexico
- Europe
- Germany
- UK
- France
- Italy
- Spain
- Rest of Europe
- South America
- Brazil
- Argentina
- Rest of South America
- Asia-Pacific
- China
- India
- Thailand
- Vietnam
- Taiwan
- Singapore
- Malaysia
- Indonesia
- Japan
- Australia
- The Philippines
- Cambodia
- Rest of Asia-Pacific
- Middle East and Africa
Key Developments
- In May 2024, the Indian Energy Exchange (IEX) recorded a 26.4% year-on-year rise in REC trading for the fiscal year 2024. This increase in both the number and value of RECs traded reflects India's growing need for renewable energy.
- In February 2024, the Indian Wind Power Association Northern Region Council appealed the ECOHZ's (CERC) new 2022 legislation on renewable energy certificates. The outcome of this issue could significantly affect the REC market dynamics in India.
Why Choose DataM Intelligence?
- Data-Driven Insights: Dive into detailed analyses with granular insights such as pricing, market shares and value chain evaluations, enriched by interviews with industry leaders and disruptors.
- Post-Purchase Support and Expert Analyst Consultations: As a valued client, gain direct access to our expert analysts for personalized advice and strategic guidance, tailored to your specific needs and challenges.
- White Papers and Case Studies: Benefit quarterly from our in-depth studies related to your purchased titles, tailored to refine your operational and marketing strategies for maximum impact.
- Annual Updates on Purchased Reports: As an existing customer, enjoy the privilege of annual updates to your reports, ensuring you stay abreast of the latest market insights and technological advancements. Terms and conditions apply.
- Specialized Focus on Emerging Markets: DataM differentiates itself by delivering in-depth, specialized insights specifically for emerging markets, rather than offering generalized geographic overviews. This approach equips our clients with a nuanced understanding and actionable intelligence that are essential for navigating and succeeding in high-growth regions.
- Value of DataM Reports: Our reports offer specialized insights tailored to the latest trends and specific business inquiries. This personalized approach provides a deeper, strategic perspective, ensuring you receive the precise information necessary to make informed decisions. These insights complement and go beyond what is typically available in generic databases.
Table of Contents
1. Methodology and Scope
- 1.1. Research Methodology
- 1.2. Research Objective and Scope of the Report
2. Definition and Overview
3. Executive Summary
- 3.1. Snippet by Type
- 3.2. Snippet by Certificate
- 3.3. Snippet by Energy Source
- 3.4. Snippet by End-User
- 3.5. Snippet by Region
4. Dynamics
- 4.1. Impacting Factors
- 4.1.1. Drivers
- 4.1.1.1. Rising Government Regulations
- 4.1.1.2. Growing Energy Transition
- 4.1.2. Restraints
- 4.1.2.1. Complexity and Market Volatility
- 4.1.3. Opportunity
- 4.1.4. Impact Analysis
- 4.1.1. Drivers
5. Industry Analysis
- 5.1. Porter's Five Force Analysis
- 5.2. Supply Chain Analysis
- 5.3. Pricing Analysis
- 5.4. Regulatory Analysis
- 5.5. DMI Opinion
6. By Type
- 6.1. Introduction
- 6.1.1. Market Size Analysis and Y-o-Y Growth Analysis (%), By Type
- 6.1.2. Market Attractiveness Index, By Type
- 6.2. Compliance RECs
- 6.2.1. Introduction
- 6.2.2. Market Size Analysis and Y-o-Y Growth Analysis (%)
- 6.3. Voluntary RECs
7. By Certificate
- 7.1. Introduction
- 7.1.1. Market Size Analysis and Y-o-Y Growth Analysis (%), By Certificate
- 7.1.2. Market Attractiveness Index, By Certificate
- 7.2. I-REC
- 7.2.1. Introduction
- 7.2.2. Market Size Analysis and Y-o-Y Growth Analysis (%)
- 7.3. TIGR
- 7.4. GEC
8. By Energy Source
- 8.1. Introduction
- 8.1.1. Market Size Analysis and Y-o-Y Growth Analysis (%), By Energy Source
- 8.1.2. Market Attractiveness Index, By Energy Source
- 8.2. Solar RECs
- 8.2.1. Introduction
- 8.2.2. Market Size Analysis and Y-o-Y Growth Analysis (%)
- 8.3. Wind RECs
- 8.4. Hydro RECs
- 8.5. Others
9. By End-User
- 9.1. Introduction
- 9.1.1. Market Size Analysis and Y-o-Y Growth Analysis (%), By End-User
- 9.1.2. Market Attractiveness Index, By End-User
- 9.2. Industrial
- 9.2.1. Introduction
- 9.2.2. Market Size Analysis and Y-o-Y Growth Analysis (%)
- 9.3. Commercial
- 9.4. Residential
- 9.5. Governmental
10. By Region
- 10.1. Introduction
- 10.1.1. Market Size Analysis and Y-o-Y Growth Analysis (%), By Region
- 10.1.2. Market Attractiveness Index, By Region
- 10.2. North America
- 10.2.1. Introduction
- 10.2.2. Key Region-Specific Dynamics
- 10.2.3. Market Size Analysis and Y-o-Y Growth Analysis (%), By Type
- 10.2.4. Market Size Analysis and Y-o-Y Growth Analysis (%), By Certificate
- 10.2.5. Market Size Analysis and Y-o-Y Growth Analysis (%), By Energy Source
- 10.2.6. Market Size Analysis and Y-o-Y Growth Analysis (%), By End-User
- 10.2.7. Market Size Analysis and Y-o-Y Growth Analysis (%), By Country
- 10.2.7.1. US
- 10.2.7.2. Canada
- 10.2.7.3. Mexico
- 10.3. Europe
- 10.3.1. Introduction
- 10.3.2. Key Region-Specific Dynamics
- 10.3.3. Market Size Analysis and Y-o-Y Growth Analysis (%), By Type
- 10.3.4. Market Size Analysis and Y-o-Y Growth Analysis (%), By Certificate
- 10.3.5. Market Size Analysis and Y-o-Y Growth Analysis (%), By Energy Source
- 10.3.6. Market Size Analysis and Y-o-Y Growth Analysis (%), By End-User
- 10.3.7. Market Size Analysis and Y-o-Y Growth Analysis (%), By Country
- 10.3.7.1. Germany
- 10.3.7.2. UK
- 10.3.7.3. France
- 10.3.7.4. Italy
- 10.3.7.5. Spain
- 10.3.7.6. Rest of Europe
- 10.4. South America
- 10.4.1. Introduction
- 10.4.2. Key Region-Specific Dynamics
- 10.4.3. Market Size Analysis and Y-o-Y Growth Analysis (%), By Type
- 10.4.4. Market Size Analysis and Y-o-Y Growth Analysis (%), By Certificate
- 10.4.5. Market Size Analysis and Y-o-Y Growth Analysis (%), By Energy Source
- 10.4.6. Market Size Analysis and Y-o-Y Growth Analysis (%), By End-User
- 10.4.7. Market Size Analysis and Y-o-Y Growth Analysis (%), By Country
- 10.4.7.1. Brazil
- 10.4.7.2. Argentina
- 10.4.7.3. Rest of South America
- 10.5. Asia-Pacific
- 10.5.1. Introduction
- 10.5.2. Key Region-Specific Dynamics
- 10.5.3. Market Size Analysis and Y-o-Y Growth Analysis (%), By Type
- 10.5.4. Market Size Analysis and Y-o-Y Growth Analysis (%), By Certificate
- 10.5.5. Market Size Analysis and Y-o-Y Growth Analysis (%), By Energy Source
- 10.5.6. Market Size Analysis and Y-o-Y Growth Analysis (%), By End-User
- 10.5.7. Market Size Analysis and Y-o-Y Growth Analysis (%), By Country
- 10.5.7.1. China
- 10.5.7.2. India
- 10.5.7.3. Thailand
- 10.5.7.4. Vietnam
- 10.5.7.5. Taiwan
- 10.5.7.6. Singapore
- 10.5.7.7. Malaysia
- 10.5.7.8. Indonesia
- 10.5.7.9. Japan
- 10.5.7.10. Australia
- 10.5.7.11. The Philippines
- 10.5.7.12. Cambodia
- 10.5.7.13. Rest of Asia-Pacific
- 10.6. Middle East and Africa
- 10.6.1. Introduction
- 10.6.2. Key Region-Specific Dynamics
- 10.6.3. Market Size Analysis and Y-o-Y Growth Analysis (%), By Type
- 10.6.4. Market Size Analysis and Y-o-Y Growth Analysis (%), By Certificate
- 10.6.5. Market Size Analysis and Y-o-Y Growth Analysis (%), By Energy Source
- 10.6.6. Market Size Analysis and Y-o-Y Growth Analysis (%), By End-User
11. Competitive Landscape
- 11.1. Competitive Scenario
- 11.2. Market Positioning/Share Analysis
- 11.3. Mergers and Acquisitions Analysis
12. Company Profiles
- 12.1. ECOHZ
- 12.1.1. Company Overview
- 12.1.2. Product Portfolio and Description
- 12.1.3. Financial Overview
- 12.1.4. Key Developments
- 12.2. Green-e Energy
- 12.3. APX Inc.
- 12.4. ENGIE
- 12.5. I-REC standard
- 12.6. RECS International
- 12.7. Statkraft
- 12.8. The Green Certificate Company Limited
- 12.9. Eneco Energy Trade
- 12.10. Shell Energy
- 12.11. Climate Bridge (Shanghai) Ltd.
- 12.12. Tata Power Renewable Energy Ltd.
- 12.13. Adani Green Energy
- 12.14. INDIAN ENERGY EXCHANGE LIMITED
- 12.15. National Renewable Energy Certification (T-REC) Center
LIST NOT EXHAUSTIVE
13. Appendix
- 13.1. About Us and Services
- 13.2. Contact Us
