|
|
市場調査レポート
商品コード
1512685
水産養殖添加物の世界市場:2024年~2031年Global Aquaculture Additives Market - 2024-2031 |
||||||
カスタマイズ可能
適宜更新あり
|
|||||||


| 水産養殖添加物の世界市場:2024年~2031年 |
|
出版日: 2024年07月10日
発行: DataM Intelligence
ページ情報: 英文 229 Pages
納期: 即日から翌営業日
|

- 全表示
- 概要
- 目次
概要
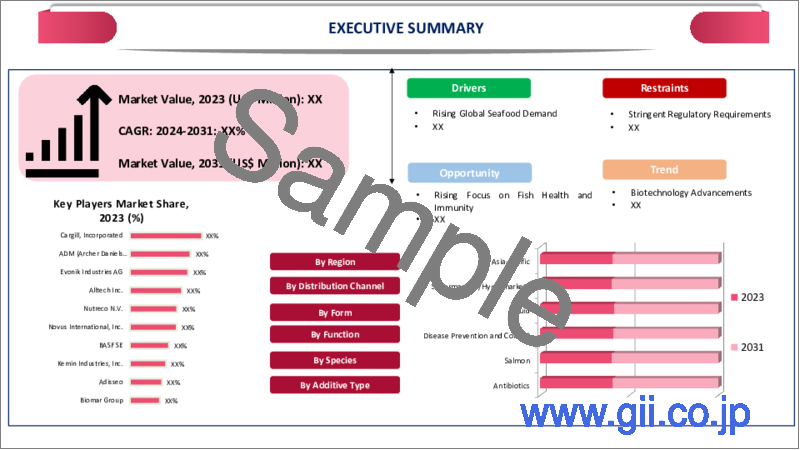
世界の水産養殖添加物市場は、2023年に108億9,000万米ドルに達し、2031年には161億米ドルに達すると予測され、予測期間2024-2031年のCAGRは4.94%で成長する見込みです。
水産養殖添加物市場は、養殖エビ、魚、その他の水生動物の健康、市場開拓、収量を改善するために利用される多種多様な物質や化合物で構成されています。飼料の配合を最適化し、水質を改善し、耐病性を高め、全体的な動物の福祉を向上させる能力を通じて、これらの添加物は現代の養殖事業にとって不可欠です。
水産養殖添加物市場は、水産物の需要増加に対応するために世界の養殖産業が拡大を続けているのと連動して、顕著な拡大と革新を経験しています。2023年9月、英国を拠点とするBioKind社は、農業廃棄物の自然発酵によって作られる持続可能なタンパク質で養殖飼料添加物生産に革命を起こしています。この環境に優しいプロセスは、乱獲を減らし、炭素排出を最小限に抑え、毒素を排除します。
養殖用添加物市場では、サケ部門が25.54%以上のシェアを占めています。同様に、北米が水産養殖添加物市場を独占し、1/3以上の最大市場シェアを獲得しています。北米の飼料・養殖企業は、研究開発(R&D)プロジェクトに多額の投資を行い、地域市場の需要に適した業界向けの新技術や添加物を生み出しています。
ダイナミクス
養殖用添加物の配合と供給システムにおける技術の進歩
世界の水産養殖添加物市場では、水産養殖添加物の製剤と送達技術の技術開発が大きな成長と技術革新を牽引しています。水産養殖添加物の有効性、安全性、持続可能性を最大化するために、新しい成分組成、より優れた送達システム、生産技術の改善など、さまざまな開発が行われています。
水産養殖添加物市場は、政府機関や業界研究による最近の数字に見られるように、技術による革命的な影響を経験しています。このインパクトが市場拡大を後押しし、市場競争を促進しています。業界の利害関係者が研究開発、共同研究、知識交換への投資を続けているため、技術革新のペースは加速し、成長の新たな機会を引き出し、養殖生産における新たな課題に対処することが期待されます。
2023年1月、NutrecoとBiomEditは、養殖魚の健康と持続可能性の課題に対処するためにマイクロバイオーム技術を利用した新しい飼料添加物「Biome-actives」を開発する提携を発表しました。このパートナーシップは、これらの添加物の発見、開発、商品化に焦点を当てた業界初のものです。この添加物は、BiomEdit社のマイクロバイオーム科学とバイオインフォマティクス・プラットフォームを利用して開発されます。
水産物の需要増加と世界人口の増加。
ワイリー社の調査論文によると、人口が最も急速に増加している地域であるアフリカを除くすべての大陸で、一人当たりの消費量が増加する(OECD/FAO、2022年)。2030年までに、養殖業の生産量は捕獲漁業を大幅に上回ると予測されている(約600万トン)。総生産量では、2023年には養殖業が捕獲漁業を上回り、2030年には養殖業が全水産動物生産量(i.e.水産植物を除く)の52%を占めるようになります。
水産物に対する需要の増加と世界人口の増加は、世界の水産養殖添加物市場の成長を促進する重要な要因です。世界の人口が拡大し続け、特に所得水準が上昇し、食生活の嗜好が変化している地域では、水産物の需要が大幅に急増しています。
この動向の背景には、水産物の栄養面での利点、より健康的な食生活へのシフト、肉類など他の蛋白源による環境への影響に対する意識の高まりなど、さまざまな要因があります。国連食糧農業機関(FAO)の最新データによると、世界の水産物消費量は年々着実に増加しており、養殖はこの需要に大きく貢献しています。
2023年には、世界の養殖生産量は過去最高の9,600万トンを超え、人間が消費する水産物総供給量の半分以上を占めるに至った。天然魚介類に比べ、品質が安定しており、入手しやすく、持続可能であることから、養殖製品への嗜好が高まっており、この増加傾向は今後も続くと予想されます。
厳しい規制要件と認証プロセスによる製造業者のコンプライアンス・コストの増加。
養殖用添加物の市場は、厳しい規制と認証手続きによって厳しい試練にさらされており、生産者にとってのコンプライアンス価格が上昇しています。消費者の健康、環境保護、食品安全に対する懸念に応えるため、世界中の規制機関が水産養殖添加物の安全性、有効性、環境持続可能性を保証するために厳しい基準を課しています。
これらの法律の目的は環境と公衆衛生の保護であるが、養殖セクターのサプライヤーやメーカーにとっては、新市場への参入、技術革新の促進、事業コストの高止まりを困難にするものでもあります。さらに、さまざまな管轄区域にまたがる規制基準の複雑さとばらつきは、複数の市場で事業を展開する水産養殖添加物メーカーにとって、コンプライアンスの課題をさらに複雑にしています。
目次
第1章 調査手法と調査範囲
第2章 定義と概要
第3章 エグゼクティブサマリー
第4章 市場力学
- 影響要因
- 促進要因
- 水産養殖添加物の処方と送達システムにおける技術の進歩。
- 水産物に対する需要の増加と世界人口の増加。
- 抑制要因
- 厳しい規制要件と認証プロセスによる製造業者のコンプライアンスコストの増加。
- 機会
- 影響分析
- 促進要因
第5章 産業分析
- ポーターのファイブフォース分析
- サプライチェーン分析
- 価格分析
- 規制分析
- ロシア・ウクライナ戦争影響分析
- DMIの見解
第6章 COVID-19分析
第7章 添加物タイプ別
- 抗生物質
- ビタミン
- アミノ酸
- ミネラル
- 酵素
- プロバイオティクスとプレバイオティクス
- 結合剤
- その他
第8章 種属別
- サーモン
- ティラピア
- コイ
- ナマズ
- マス
- エビ
- その他
第9章 機能別
- 疾病予防と管理
- 成長促進
- 飼料効率改善
- 水質管理
- その他
第10章 形態別
- 液体
- 乾燥
- 粉末
- 顆粒
- その他
第11章 流通チャネル別
- スーパーマーケット/ハイパーマーケット
- オンライン小売
- 専門店
- その他
第12章 地域別
- 北米
- 米国
- カナダ
- メキシコ
- 欧州
- ドイツ
- 英国
- フランス
- イタリア
- スペイン
- その他欧州
- 南米
- ブラジル
- アルゼンチン
- その他南米
- アジア太平洋
- 中国
- インド
- 日本
- オーストラリア
- その他アジア太平洋地域
- 中東・アフリカ
第13章 競合情勢
- 競合シナリオ
- 市況/シェア分析
- M&A分析
第14章 企業プロファイル
- Archer Daniels Midland Company
- 会社概要
- 製品ポートフォリオと説明
- 財務概要
- 主な発展
- Alltech
- BASF SE
- Skretting
- Cargill, Incorporated
- Koninklijke DSM N.V.
- Nutreco N.V.
- Novus International, Inc.
- Evonik Industries AG
- Kemin Industries, Inc.
第15章 付録
Overview
Global Aquaculture Additives Market reached US$ 10.89 billion in 2023 and is expected to reach US$ 16.10 billion by 2031, growing with a CAGR of 4.94% during the forecast period 2024-2031.
The market for aquaculture additives comprises a wide variety of substances and compounds that are utilized to improve the well-being, development, and yield of farmed shrimp, fish, and other aquatic animals. Through their ability to optimize feed formulations, improve water quality, enhance disease resistance, and advance overall animal welfare, these additives are essential to modern aquaculture operations.
The aquaculture additives market has experienced notable expansion and innovation in tandem with the global aquaculture industry's ongoing expansion to cater to the increasing demand for seafood. In September 2023, based in the UK, BioKind is revolutionizing aquaculture feed additive production with sustainable proteins created through natural fermentation of agricultural waste. This eco-friendly process reduces over-fishing, minimizes carbon emissions, and eliminates toxins.
The salmon segment in aquaculture additives market accounts over 25.54% share. Similarly, North America dominates the aquaculture additives market, capturing the largest market share of over 1/3rd. North American feed and aquaculture companies maintain significant investments in research and development (R&D) projects to create novel technologies and additives for the industry that are suited to the demands of local markets.
Dynamics
Technological Advancements in Aquaculture Additive Formulations and Delivery Systems
Significant growth and innovation are being driven by technological developments in aquaculture additive formulations and delivery technologies in the global aquaculture additives market. To maximize the effectiveness, safety, and sustainability of aquaculture additives, a variety of developments have been made, such as new ingredient compositions, better delivery systems, and improved production techniques.
The aquaculture additives market is experiencing a revolutionary impact from technology, as seen by recent figures from government organizations and industry studies. This impact is propelling market expansion and driving industry competition. As industry stakeholders continue to invest in research and development, collaboration, and knowledge exchange, the pace of technological innovation is expected to accelerate, unlocking new opportunities for growth and addressing emerging challenges in aquaculture production.
In January 2023, Nutreco and BiomEdit announced a partnership to develop new feed additives called Biome-actives that use microbiome technology to address fish farming health and sustainability challenges. The partnership is the first in the industry to focus on discovery, development, and commercialization of these additives. The additives will be developed using BiomEdit's microbiome science and bioinformatics platform.
Increasing Demand for Seafood Products and Growing Global Population.
According to Wiley research paper, per capita consumption will increase in all continents except Africa, the region with the fastest growing population (OECD/FAO, 2022). By 2030, aquaculture is projected to produce substantially more than capture fisheries (by around 6 million tonnes). In terms of total production, aquaculture will surpass capture fisheries in 2023 and by 2030 aquaculture will represent 52% of all aquatic animal production (i.e., excluding aquatic plants).
The increasing demand for seafood products and the growing global population are significant drivers propelling the growth of the global aquaculture additives market. As the world's population continues to expand, particularly in regions with rising income levels and changing dietary preferences, the demand for seafood has experienced a substantial surge.
The trend is driven by various factors, including the nutritional benefits of seafood, the shift towards healthier diets, and the increasing awareness of the environmental impact of other protein sources such as meat. According to recent data from the Food and Agriculture Organization (FAO), global seafood consumption has been steadily increasing over the years, with aquaculture contributing significantly to meeting this demand.
In 2023, global aquaculture production reached a record high of over 96 million metric tons, accounting for more than half of the total seafood supply for human consumption. This upward trend is expected to continue, driven by the growing preference for aquaculture products due to their consistent quality, availability, and sustainability compared to wild-caught seafood.
Stringent Regulatory Requirements and Certification Processes, Leading to Increased Compliance Costs for Manufacturers.
The market for aquaculture additives is severely challenged by strict regulations and certification procedures, which raises the price of compliance for producers. In response to concerns about consumer health, environmental protection, and food safety, regulatory organizations from all over the world impose stringent standards to guarantee the safety, effectiveness, and environmental sustainability of aquaculture additives.
Although the goals of these laws are to protect the environment and public health, they can also make it more difficult for suppliers and manufacturers in the aquaculture sector to enter new markets, promote innovation, and keep costs of operations high. Moreover, the complexity and variability of regulatory standards across different jurisdictions further compound compliance challenges for aquaculture additives manufacturers operating in multiple markets.
Segment Analysis
The global aquaculture additives market is segmented based on additive type, species, functionality, distribution channel, form and region.
The Surging Demand for Salmon Species
The salmon species, which is widely used in aquaculture production worldwide, has a major impact on the need for aquaculture additives in the global market. The loss of wild fish stocks and rising consumer demand for premium seafood have led to an exponential increase in salmon aquaculture in recent decades. Because of this, there is a growing need for aquaculture additives that are specifically designed to meet the nutritional and health needs of salmon species, which has changed the dynamics of the worldwide aquaculture additives market.
According to FAO, salmon aquaculture production has grown rapidly in the past 10-15 years, with more than 2.8 million tons of farmed salmon produced in 2022. In 2023, 96 million metric tons of fish were bred, raised, and farmed, while 90.6 million were captured. Around 70% of salmon worldwide is farmed, with the majority of that being Atlantic salmon. Farmed salmon makes up over 90% of the farmed salmon market and more than 50% of the total global salmon market. The major markets for farmed Atlantic salmon are Japan, the European Union, and North America.
Moreover, the market for aquaculture additives specifically for salmon is distinguished by continuous research and development endeavors aimed at creating inventive remedies to tackle novel obstacles and market requirements. To lessen reliance on feed materials derived from the sea and to support the sustainability of salmon aquaculture, for example, research is being done on substitute ingredients, such as insect meal, proteins produced from algae, and single-cell proteins.
Geographical Penetration
Increasing Trend of Seafood among North Americans
North America's booming aquaculture industry, rising consumer demand for fish products, and legislative actions supporting sustainable aquaculture methods are some of the factors driving the market for aquaculture additives in the region. North America's aquaculture additives market has grown significantly in recent years, which is not surprising given the region's growing aquaculture industry and rising demand for fish products.
The Alaska Department of Fish and Game (ADF&G) reported that 230.2 million salmon were harvested in 2023, a 43% increase from 2022. In 2020, the combined production of farmed seafood in the United States, Canada, and Mexico exceeded 3.5 million metric tons. Notable contributors to this total were freshwater species including salmon, trout, catfish, and tilapia, as well as marine species like shrimp and shellfish.
In North America, feed additives for aquaculture, such as vitamins, minerals, amino acids, and enzymes, are frequently utilized to improve feed formulations, maximize nutrient use, and support animal health and growth. The consumption of aquafeed additives in North America exceeded 300,000 metric tons in 2020. Surveys and consumer studies indicate a growing preference for sustainably sourced and responsibly farmed seafood products in North America.
COVID-19 Impact Analysis
The aquaculture additives market has been impacted by the COVID-19 epidemic in a number of ways. Aquaculture additive production and distribution were first impacted by shortages of raw materials and delayed shipments caused by disruptions in global supply chains and logistics networks. Movement limitations and lockdown procedures made it more difficult for aquaculture farms and processing facilities to function, which reduced the need for chemicals.
The need for aquaculture additives, particularly those targeted at improving growth, disease control, and feed efficiency, has been fueled by this shift in consumer preferences. Furthermore, the aquaculture sector has responded to the pandemic's concerns by deploying digital technologies, remote monitoring technologies, and biosecurity measures to ensure the continuity of operations and mitigate the risk of disease outbreaks.
Russia-Ukraine War Impact Analysis
Significant uncertainty and disruptions have been brought about by the conflict between Russia and Ukraine, especially in the aquaculture additives industry. Geopolitical tensions have increased as a result of the conflict, causing swings in currency values, disruptions in commerce, and volatility in commodity prices.
The conflict has affected agricultural production and exports in Ukraine, a significant producer of feed components and additives, which has affected the cost and availability of essential raw materials for aquaculture additives. Furthermore, the crisis has prompted aquaculture firms to investigate alternate sourcing techniques and diversify their supply chains because to worries regarding geopolitical risks and supply chain security.
Increased geopolitical tensions may also result in changes to regulatory frameworks and trade patterns, which could have an effect on market access and investment choices in the aquaculture additives industry. In general, the conflict between Russia and Ukraine has introduced uncertainties and challenges for the aquaculture additives market, necessitating proactive risk management and contingency planning by industry stakeholders.
By Additive Type
- Antibiotics
- Vitamins
- Amino Acids
- Minerals
- Enzymes
- Probiotics and Prebiotics
- Binders
- Others
By Species
- Salmon
- Tilapia
- Carp
- Catfish
- Trout
- Shrimp
- Others
By Functionality
- Disease Prevention and Control
- Growth Promotion
- Feed Efficiency Improvement
- Water Quality Management
- Others
By Distribution Channel
- Supermarkets/Hypermarkets
- Online Retail
- Specialty Stores
- Others
By Form
- Liquid
- Dry
- Powder
- Granules
- Others
By Region
- North America
- U.S.
- Canada
- Mexico
- Europe
- Germany
- UK
- France
- Italy
- Russia
- Rest of Europe
- South America
- Brazil
- Argentina
- Rest of South America
- Asia-Pacific
- China
- India
- Japan
- Australia
- Rest of Asia-Pacific
- Middle East and Africa
Key Developments
- In July 2023, Nor-Feed that creates, manufactures, and distributes plant- and plant-extract based natural feed additives for animals. introduced Norponin Opti and Norponin Aqua, two new aqua feed additives that lower ammonia, a frequent aquaculture waste.
- In December 2023, Aquaculture feed manufacturer Skretting has announced the new generation of hatchery feed, Nutra Terra. Nutra Terra offers better resource utilization and lower emissions.
- In April 2023, Kemin AquaScience announced the launch of Pathorol for farmed shrimp health in multiple Asian countries. Phytogenic-based feed additive reduces the impact of parasitic infection and promotes hepatopancreatic health in shrimp.
Competitive Landscape
The major global players in the market include Archer Daniels Midland Company, Alltech, BASF SE, Skretting, Cargill, Incorporated, Koninklijke DSM N.V., Nutreco N.V., Novus International, Inc., Evonik Industries AG and Kemin Industries, Inc.
Why Purchase the Report?
- To visualize the global aquaculture additives market segmentation based on additive type, species, functionality, distribution channel, form and region as well as understand key commercial assets and players.
- Identify commercial opportunities by analyzing trends and co-development.
- Excel data sheet with numerous data points of aquaculture additives market-level with all segments.
- PDF report consists of a comprehensive analysis after exhaustive qualitative interviews and an in-depth study.
- Product mapping available as Excel consisting of key products of all the major players.
The global aquaculture additives market report would provide approximately 78 tables, 88 figures, and 229 Pages.
Target Audience 2024
- Manufacturers/ Buyers
- Industry Investors/Investment Bankers
- Research Professionals
- Emerging Companies
Table of Contents
1. Methodology and Scope
- 1.1. Research Methodology
- 1.2. Research Objective and Scope of the Report
2. Definition and Overview
3. Executive Summary
- 3.1. Snippet By Additive Type
- 3.2. Snippet by Type
- 3.3. Snippet by Functionality
- 3.4. Snippet by Form
- 3.5. Snippet by Distribution Channel
- 3.6. Snippet by Region
4. Dynamics
- 4.1. Impacting Factors
- 4.1.1. Drivers
- 4.1.1.1. Technological advancements in aquaculture additive formulations and delivery systems.
- 4.1.1.2. Increasing Demand for Seafood Products and Growing Global Population.
- 4.1.2. Restraints
- 4.1.2.1. Stringent Regulatory Requirements and Certification Processes, Leading to Increased Compliance Costs for Manufacturers.
- 4.1.3. Opportunity
- 4.1.4. Impact Analysis
- 4.1.1. Drivers
5. Industry Analysis
- 5.1. Porter's Five Force Analysis
- 5.2. Supply Chain Analysis
- 5.3. Pricing Analysis
- 5.4. Regulatory Analysis
- 5.5. Russia-Ukraine War Impact Analysis
- 5.6. DMI Opinion
6. COVID-19 Analysis
- 6.1. Analysis of COVID-19
- 6.1.1. Scenario Before COVID
- 6.1.2. Scenario During COVID
- 6.1.3. Scenario Post COVID
- 6.2. Pricing Dynamics Amid COVID-19
- 6.3. Demand-Supply Spectrum
- 6.4. Government Initiatives Related to the Market During Pandemic
- 6.5. Manufacturers Strategic Initiatives
- 6.6. Conclusion
7. By Additive Type
- 7.1. Introduction
- 7.1.1. Market Size Analysis and Y-o-Y Growth Analysis (%), By Additive Type
- 7.1.2. Market Attractiveness Index, By Additive Type
- 7.2. Antibiotics*
- 7.2.1. Introduction
- 7.2.2. Market Size Analysis and Y-o-Y Growth Analysis (%)
- 7.3. Antibiotics
- 7.4. Vitamins
- 7.5. Amino Acids
- 7.6. Minerals
- 7.7. Enzymes
- 7.8. Probiotics and Prebiotics
- 7.9. Binders
- 7.10. Others
8. By Species
- 8.1. Introduction
- 8.1.1. Market Size Analysis and Y-o-Y Growth Analysis (%), By Species
- 8.1.2. Market Attractiveness Index, By Species
- 8.2. Salmon*
- 8.2.1. Introduction
- 8.2.2. Market Size Analysis and Y-o-Y Growth Analysis (%)
- 8.3. Tilapia
- 8.4. Carp
- 8.5. Catfish
- 8.6. Trout
- 8.7. Shrimp
- 8.8. Others
9. By Functionality
- 9.1. Introduction
- 9.1.1. Market Size Analysis and Y-o-Y Growth Analysis (%), By Functionality
- 9.1.2. Market Attractiveness Index, By Functionality
- 9.2. Disease Prevention and Control*
- 9.2.1. Introduction
- 9.2.2. Market Size Analysis and Y-o-Y Growth Analysis (%)
- 9.3. Growth Promotion
- 9.4. Feed Efficiency Improvement
- 9.5. Water Quality Management
- 9.6. Others
10. By Form
- 10.1. Introduction
- 10.1.1. Market Size Analysis and Y-o-Y Growth Analysis (%), By Form
- 10.1.2. Market Attractiveness Index, By Form
- 10.2. Liquid*
- 10.2.1. Introduction
- 10.2.2. Market Size Analysis and Y-o-Y Growth Analysis (%)
- 10.3. Dry
- 10.4. Powder
- 10.5. Granules
- 10.6. Others
11. By Distribution Channel
- 11.1. Introduction
- 11.1.1. Market Size Analysis and Y-o-Y Growth Analysis (%), By Distribution Channel
- 11.1.2. Market Attractiveness Index, By Distribution Channel
- 11.2. Supermarkets/Hypermarkets*
- 11.2.1. Introduction
- 11.2.2. Market Size Analysis and Y-o-Y Growth Analysis (%)
- 11.3. Online Retail
- 11.4. Specialty Stores
- 11.5. Others
12. By Region
- 12.1. Introduction
- 12.1.1. Market Size Analysis and Y-o-Y Growth Analysis (%), By Region
- 12.1.2. Market Attractiveness Index, By Region
- 12.2. North America
- 12.2.1. Introduction
- 12.2.2. Key Region-Specific Dynamics
- 12.2.3. Market Size Analysis and Y-o-Y Growth Analysis (%), By Additive Type
- 12.2.4. Market Size Analysis and Y-o-Y Growth Analysis (%), By Species
- 12.2.5. Market Size Analysis and Y-o-Y Growth Analysis (%), By Functionality
- 12.2.6. Market Size Analysis and Y-o-Y Growth Analysis (%), By Form
- 12.2.7. Market Size Analysis and Y-o-Y Growth Analysis (%), By Distribution Channel
- 12.2.8. Market Size Analysis and Y-o-Y Growth Analysis (%), By Country
- 12.2.8.1. U.S.
- 12.2.8.2. Canada
- 12.2.8.3. Mexico
- 12.3. Europe
- 12.3.1. Introduction
- 12.3.2. Key Region-Specific Dynamics
- 12.3.3. Market Size Analysis and Y-o-Y Growth Analysis (%), By Additive Type
- 12.3.4. Market Size Analysis and Y-o-Y Growth Analysis (%), By Species
- 12.3.5. Market Size Analysis and Y-o-Y Growth Analysis (%), By Functionality
- 12.3.6. Market Size Analysis and Y-o-Y Growth Analysis (%), By Form
- 12.3.7. Market Size Analysis and Y-o-Y Growth Analysis (%), By Distribution Channel
- 12.3.8. Market Size Analysis and Y-o-Y Growth Analysis (%), By Country
- 12.3.8.1. Germany
- 12.3.8.2. UK
- 12.3.8.3. France
- 12.3.8.4. Italy
- 12.3.8.5. Spain
- 12.3.8.6. Rest of Europe
- 12.4. South America
- 12.4.1. Introduction
- 12.4.2. Key Region-Specific Dynamics
- 12.4.3. Market Size Analysis and Y-o-Y Growth Analysis (%), By Additive Type
- 12.4.4. Market Size Analysis and Y-o-Y Growth Analysis (%), By Species
- 12.4.5. Market Size Analysis and Y-o-Y Growth Analysis (%), By Functionality
- 12.4.6. Market Size Analysis and Y-o-Y Growth Analysis (%), By Form
- 12.4.7. Market Size Analysis and Y-o-Y Growth Analysis (%), By Distribution Channel
- 12.4.8. Market Size Analysis and Y-o-Y Growth Analysis (%), By Country
- 12.4.8.1. Brazil
- 12.4.8.2. Argentina
- 12.4.8.3. Rest of South America
- 12.5. Asia-Pacific
- 12.5.1. Introduction
- 12.5.2. Key Region-Specific Dynamics
- 12.5.3. Market Size Analysis and Y-o-Y Growth Analysis (%), By Additive Type
- 12.5.4. Market Size Analysis and Y-o-Y Growth Analysis (%), By Species
- 12.5.5. Market Size Analysis and Y-o-Y Growth Analysis (%), By Functionality
- 12.5.6. Market Size Analysis and Y-o-Y Growth Analysis (%), By Form
- 12.5.7. Market Size Analysis and Y-o-Y Growth Analysis (%), By Distribution Channel
- 12.5.8. Market Size Analysis and Y-o-Y Growth Analysis (%), By Country
- 12.5.8.1. China
- 12.5.8.2. India
- 12.5.8.3. Japan
- 12.5.8.4. Australia
- 12.5.8.5. Rest of Asia-Pacific
- 12.6. Middle East and Africa
- 12.6.1. Introduction
- 12.6.2. Key Region-Specific Dynamics
- 12.6.3. Market Size Analysis and Y-o-Y Growth Analysis (%), By Additive Type
- 12.6.4. Market Size Analysis and Y-o-Y Growth Analysis (%), By Species
- 12.6.5. Market Size Analysis and Y-o-Y Growth Analysis (%), By Functionality
- 12.6.6. Market Size Analysis and Y-o-Y Growth Analysis (%), By Form
- 12.6.7. Market Size Analysis and Y-o-Y Growth Analysis (%), By Distribution Channel
13. Competitive Landscape
- 13.1. Competitive Scenario
- 13.2. Market Positioning/Share Analysis
- 13.3. Mergers and Acquisitions Analysis
14. Company Profiles
- 14.1. Archer Daniels Midland Company*
- 14.1.1. Company Overview
- 14.1.2. Product Portfolio and Description
- 14.1.3. Financial Overview
- 14.1.4. Key Developments
- 14.2. Alltech
- 14.3. BASF SE
- 14.4. Skretting
- 14.5. Cargill, Incorporated
- 14.6. Koninklijke DSM N.V.
- 14.7. Nutreco N.V.
- 14.8. Novus International, Inc.
- 14.9. Evonik Industries AG
- 14.10. Kemin Industries, Inc.
LIST NOT EXHAUSTIVE
15. Appendix
- 15.1. About Us and Services
- 15.2. Contact Us
