|
|
市場調査レポート
商品コード
1474064
イメージ最適化の世界市場-2024-2031年Global Image Optimization Market - 2024-2031 |
||||||
|
|
|||||||
カスタマイズ可能
適宜更新あり
|
|||||||


| イメージ最適化の世界市場-2024-2031年 |
|
出版日: 2024年05月02日
発行: DataM Intelligence
ページ情報: 英文 180 Pages
納期: 即日から翌営業日
|

- 全表示
- 概要
- 目次
概要
世界のイメージ最適化市場は、2023年に1億5,320万米ドルに達し、2031年には2億3,870万米ドルに達すると予測され、予測期間2024-2031年のCAGRは5.7%で成長する見込みです。
レスポンシブウェブデザインやモバイルファーストウェブデザインの動向に勢いがつき始めました。モバイルデバイスから資料にアクセスする消費者の増加により、モバイルプラットフォーム向けのイメージ最適化が重要になっています。スムーズなモバイル体験はイメージ最適化によって後押しされ、画像が素早く読み込まれ、タブレットで最高の状態で表示されるようになります。eコマースが世界的に急成長した結果、オンライン小売プラットフォームにおける商品写真、販促バナー、ビジュアル素材の使用は劇的に増加しました。最適化された写真は、商品の露出を増やし、顧客を引きつけ、コンバージョンを促進するために不可欠です。eコマース企業は、顧客の満足度を高め、販売を成功させるために、画像の最適化にお金をかけています。
主要なキープレイヤーによる製品発表の増加は、予測期間中の世界市場の成長を後押しします。例えば、2022年5月23日、日立製作所はLumada Inspection Insightsを発表し、デジタルおよびグリーンポートフォリオを強化しました。両社は、重要資産の監視、検査、最適化のためのデジタルソリューションのE2Eポートフォリオを提供しています。日立エネルギーと日立バンタラが共同開発したLumada Inspection Insightsは、強力な人工知能(AI)を使用して、LiDAR、熱画像、衛星画像などの写真やビデオを解析します。これにより、顧客は資産点検を自動化し、持続可能性の目標をサポートし、物理的セキュリティを向上させ、暴風雨や火災に関連するリスクや影響を低減することができます。
北米は、同地域のeコマース部門の急成長により、市場を独占している地域です。主要企業による製品投入の増加が、予測期間中の市場成長を後押ししています。例えば、2023年1月3日、Sony Electronicsは、X95LおよびX93L Mini LED、X90L Full Array LED、A95L QD-OLED、A80L OLEDなど5種類のモデルからなるテレビラインナップ、2023 BRAVIA XRを発表しました。さらに臨場感あふれるサウンド体験を求める消費者のために、各モデルはSonyのサウンドバーと連携し、ファントムスピーカーを生成して音場を最適化する360 Spatial Sound Mapping3も提供します。
ダイナミクス
デジタルコンテンツの急成長
eコマース、ソーシャルメディア、デジタルマーケティング、教育など、さまざまな業界において、デジタルコンテンツの急激な成長に伴い、オンライン画像の利用が急速に増加しています。これらの画像を管理し、パフォーマンスを向上させるイメージ最適化ソリューションへの需要が高まっているのは、デジタル素材の開発が拡大している結果です。ブログ、ソーシャルメディアネットワーク、オンラインマーケット、ストリーミングサービスなど、コンテンツチャネルの増加は、人々や企業によるビジュアルコンテンツの継続的な作成と配信を可能にしています。画像の最適化は、これらの画像が素早く読み込まれ、見栄えが良く、あらゆるプラットフォームやデバイスで一貫したユーザー体験を提供できるようにするために非常に重要になります。
eコマースプラットフォームやオンラインショッピングの拡大により、デジタルショップは商品写真やマーケティングビジュアル、プロモーショングラフィックで溢れかえっています。これらの写真がトラフィックを呼び込み、コンバージョンを促し、eコマーススペースで競争力を持つためには、迅速な読み込み時間、優れたプレゼンテーション、モバイルデバイスでのアクセシビリティのために最適化されていなければなりません。ビジュアルは、デジタル広告キャンペーン、Eメールマーケティング、コンテンツマーケティング戦術において、消費者の注目を集め、メッセージをうまく伝えるために重要な役割を果たします。最高のパフォーマンスとエンゲージメント指標を得るためには、インフォグラフィック、バナー画像、広告クリエイティブ、マルチメディアコンテンツはすべて画像に最適化されていなければなりません。
eコマースの拡大
eコマースでの購買において、商品写真は重要な役割を果たします。最適化された商品写真は、読み込みが速く、品質が高く、商品の詳細な情報を提供するため、見込み客は引き込まれ、興味を持つ可能性が高くなります。eコマースシステムは、画像の最適化によって商品を効果的に展示し、売上とコンバージョンを増加させます。オンライン購入にモバイル機器を使用する人が増えるにつれ、モバイル最適化が重要になってきます。商品写真やショッピング体験全体が、スマートフォンやタブレットなどのモバイル機器に最適化されていることを確認することは、画像の最適化と呼ばれています。モバイルプラットフォームでは、これによってユーザー体験が向上し、購入が完了する可能性が高まります。
eコマースの専門家は、スマートフォンなどのモバイル機器の利用が世界規模で増加しているため、eコマース産業が拡大していると述べています。2024年までには、eコマースによる購入全体の約42.9%がモバイル販売になると予測されています。米国の消費者の約47%がソーシャルプラットフォームを通じて商品を購入したと回答し、中国の消費者の84%以上がソーシャルネットワークで買い物をしたと回答しました。
複雑さと技術的専門知識
画像の最適化には、画像フォーマット、圧縮アルゴリズム、色空間、解像度、メタデータ、ウェブパフォーマンスの最適化戦略など、さまざまな技術的概念の知識が必要になることが多いです。ユーザー、特に非技術者は、これらの概念をナビゲートし、最適化テクニックを効果的に実装することは困難であると感じています。イメージ最適化ツールやソフトウェアを利用するには、その特徴、設定、機能に精通している必要があります。高度な画像編集ソフトウェアや最適化プラットフォームには学習曲線が伴うことが多く、技術的なバックグラウンドを持たないユーザーがこれらのツールを最適に活用することは困難です。
使用事例やコンテンツの種類に応じて適切な最適化手法を選択するには、専門知識が必要です。例えば、ファイルサイズを最大限に縮小するために非可逆圧縮を使用するタイミングや、ロスレス圧縮で品質を優先するタイミングを理解することは、技術的な知識と経験を必要とする複雑な決断です。既存のワークフローやeコマースプラットフォーム、開発環境にイメージ最適化ソリューションを統合することは、技術的な統合プロセスに精通していないユーザーにとっては難しい課題です。互換性の問題、APIの使用、カスタマイズの要件などが障害となります。
目次
第1章 調査手法と調査範囲
第2章 定義と概要
第3章 エグゼクティブサマリー
第4章 市場力学
- 影響要因
- 促進要因
- デジタルコンテンツの急成長
- eコマースの拡大
- 抑制要因
- 複雑さと技術的専門性
- 機会
- 影響分析
- 促進要因
第5章 産業分析
- ポーターのファイブフォース分析
- サプライチェーン分析
- 価格分析
- 規制分析
- ロシア・ウクライナ戦争の影響分析
- DMIの見解
第6章 COVID-19分析
第7章 コンポーネント別
- ソフトウェア
- サービス
第8章 展開別
- クラウドベース
- オンプレミス
第9章 企業規模別
- 中小企業
- 大企業
第10章 技術別
- 機械学習ベースの最適化
- AI活用の最適化
- 手動の最適化
第11章 エンドユーザー別
- eコマース・小売
- メディア・エンターテインメント
- 旅行・ホスピタリティ
- ヘルスケア・ライフサイエンス
- 教育
- その他
第12章 地域別
- 北米
- 米国
- カナダ
- メキシコ
- 欧州
- ドイツ
- 英国
- フランス
- イタリア
- スペイン
- その他欧州
- 南米
- ブラジル
- アルゼンチン
- その他南米
- アジア太平洋
- 中国
- インド
- 日本
- オーストラリア
- その他アジア太平洋地域
- 中東・アフリカ
第13章 競合情勢
- 競合シナリオ
- 市況/シェア分析
- M&A分析
第14章 企業プロファイル
- TinyIMG
- 会社概要
- 製品ポートフォリオと説明
- 財務概要
- 主な発展
- Nekkra UG
- ShortPixel
- Piio
- ImageKit.io
- imgix
- Cloudinary
- Imagify
- Gumlet
- Scaleflex
第15章 付録
Overview
Global Image Optimization Market reached US$ 153.2 Million in 2023 and is expected to reach US$ 238.7 Million by 2031, growing with a CAGR of 5.7% during the forecast period 2024-2031.
The growing trend towards responsive and mobile-first web design started momentum. The increasing number of consumers who access material through mobile devices has made picture optimization for mobile platforms important. A smooth mobile experience is boosted by image optimization, which makes sure that images load quickly and are shown as best they can be on tablets. The use of product photos, promotional banners and visual material on online retail platforms has increased dramatically as a result of the fast rise of e-commerce globally. Optimized photos are essential for increasing the exposure of products, drawing in customers and promoting conversions. E-commerce companies spend money on image optimization to increase customer happiness and sales success.
Growing product launches by the major key players help to boost global market growth over the forecast period. For instance, on May 23, 2022, Hitachi launched Lumada Inspection Insights and strengthened its digital and green portfolio. The companies end to end-to-end portfolio of digital solutions for the monitoring, inspection and optimization of critical assets. Lumada Inspection Insights, developed by Hitachi Energy and Hitachi Vantara, uses powerful artificial intelligence (AI) to analyze photos and videos, including LiDAR, thermal and satellite imagery. The allows customers to automate asset inspection, support sustainability goals, improve physical security and lower risks and impacts related to storms or fires.
North America is the dominating region in the market due to the rapid growth in the region's E-Commerce sector. Growing product launches by major key players help to boost market growth over the forecast period. For instance, on 03, January 2023, Sony Electronics launched the 2023 BRAVIA XR, a TV lineup in 5 different models such as X95L and X93L Mini LED, X90L Full Array LED, A95L QD-OLED and A80L OLED. For consumers looking for an even more immersive sound experience, each model also works with Sony soundbars to offer 360 Spatial Sound Mapping3 which generates phantom speakers and sound field optimization.
Dynamics
Rapid Growth of Digital Content
Online image usage is rising quickly along with the exponential growth of digital content across several industries, including e-commerce, social media, digital marketing and education. The growing demand for image optimization solutions to manage and improve the performance of these pictures is a result of the growth in the development of digital material. The increasing number of content channels, including blogs, social media networks, online markets and streaming services, has made possible the ongoing creation and distribution of visual content by people and companies alike. Image optimization becomes crucial in order to ensure that these pictures load quickly, look excellent and offer a consistent user experience across all platforms and devices.
Digital shops are overflowing with product photos, marketing visuals and promotional graphics due to the expansion of e-commerce platforms and online shopping. For these pictures to draw in traffic, encourage conversions and be competitive in the e-commerce space, they must be optimized for quick loading times, excellent presentation and accessibility on mobile devices. Visuals play an important part in digital advertising campaigns, email marketing and content marketing tactics to successfully catch consumer attention and communicate messages. For the best performance and engagement metrics, infographics, banner images, ad creatives and multimedia content must all be optimized for images.
E-commerce Expansion
Product photos play an important part in e-commerce purchases made by customers. Prospective customers are more likely to be pulled in and engaged by optimized product photographs that load rapidly, are of excellent quality and offer in-depth views of the product. E-commerce systems effectively exhibit items due to image optimization, which increases sales and conversions. Mobile optimization becomes critical as more people use mobile devices for online purchasing. Ensuring that product photographs and the entire shopping experience are optimized for mobile devices, such as smartphones and tablets, is known as image optimization. On mobile platforms, this enhances user experience and raises the possibility that purchases will be finished.
E-commerce experts stated that the E-Commerce industry is expanding due to the increasing usage of mobile devices such as smartphones on a globally scale. By 2024, mobile sales are predicted to have made around 42.9% of all purchases made via e-commerce. Around 47% of US consumers reported purchasing goods through social platforms and over 84% of Chinese consumers reported shopping on social networks, the highest in the world.
Complexity and Technical Expertise
Image optimization often requires knowledge of various technical concepts such as image formats, compression algorithms, color spaces, resolution, metadata and web performance optimization strategies. Users, especially non-technical ones find it challenging to navigate these concepts and implement optimization techniques effectively. Utilizing image optimization tools and software requires familiarity with their features, settings and functionalities. Advanced image editing software or optimization platforms often come with a learning curve, making it difficult for users without technical backgrounds to leverage these tools optimally.
Choosing the right optimization techniques for different use cases and content types requires expertise. For example, understanding when to use lossy compression for maximum file size reduction or when to prioritize quality with lossless compression is complex decisions that require technical knowledge and experience. Integrating image optimization solutions into existing workflows, e-commerce platforms or development environments can be challenging for users who are not familiar with technical integration processes. Compatibility issues, API usage and customization requirements pose obstacles.
Segment Analysis
The global image optimization market is segmented based on component, deployment, enterprise size, technology, end-user and region.
Image Optimization Software Segment Accounted for Largest Market Share in the Market
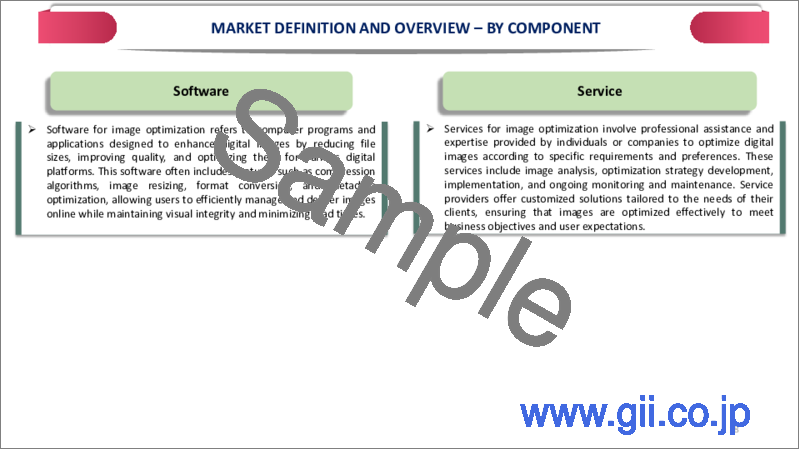
Based on the component, the image optimization market is segmented into software and services.
Image optimization software offers a wide range of advanced functionalities and features like automatic image resizing, quality enhancement tools, compression algorithms, format conversion and batch processing capabilities. The features allow users to optimize images efficiently and effectively, saving time and effort. Image optimization software often offers customization options that allow users to tailor optimization settings based on specific requirements and use cases. Customizable settings for image quality, compression levels, color profiles, resolution and file formats ensure that optimized images meet desired standards and objectives.
Leading image optimization software programs include clear processes, user-friendly interfaces and optimization preset integrated right in. Due to its simplicity of use, a broad spectrum of users including web developers, designers, content providers and e-commerce specialists use it without having to possess advanced technical knowledge. Because image optimization software is scalable, users effectively handle a high volume of photos. Image optimization software manages different workloads and scale resources as needed, guaranteeing continuous performance and dependability, whether it is optimizing a small number of photos for a website or managing a large image library for an e-commerce platform.
Geographical Penetration
North America is Dominating the Image Optimization Market
Driving among nations in digital transformation across industries is North America. Online platforms, digital marketing strategies and digital technology are all being used by businesses at an increasing rate. The need for image optimization solutions to improve digital content quality, performance and user experience has increased as a result of this development. Major companies in the region's growing e-commerce market include Amazon, Walmart and several other online stores. The necessity for high-quality photos for websites and marketing materials has increased due to the expansion of e-commerce. To increase load speeds, visual attractiveness and conversion rates in the e-commerce industry, image optimization technologies and services are crucial.
Businesses participate substantially in online advertising campaigns across search engines, social media platforms and display networks in North America, which has a sizable digital advertising industry. Effective digital ad campaigns depend on optimized pictures to increase engagement, clicks and conversions. Image optimization solutions are becoming more and more in demand as digital ad expenditure continues rising. Film studios, streaming services, game companies and digital media publishers are all part of the booming media and entertainment sector in the area. To provide audiences with clear, sharp and quickly loaded images and graphics, image optimization solutions are becoming increasingly popular in these industries where high-quality visuals are crucial.
Competitive Landscape
The major global players in the market include TinyIMG, Nekkra UG, ShortPixel, Piio, ImageKit.io, imgix, Cloudinary, Imagify, Gumlet and Scaleflex.
COVID-19 Impact Analysis
Activity on the internet increased throughout the epidemic as more individuals resorted to digital platforms for communication, employment, education and entertainment. To improve the quality and functionality of graphics on websites, social networking platforms and digital content, this increased demand for image optimization solutions. Lockdowns and other social distancing strategies led to a noticeable spike in e-commerce sales. The demand for image optimization tools increased as a result of businesses increasingly on high-quality photographs to successfully promote their items online. The technologies ensured rapid loading times, ideal resolution and an enhanced user experience.
Many organizations shifted to remote work setups, relying on virtual meetings, webinars and collaborative platforms. Image optimization became essential for video conferencing tools and online collaboration platforms to deliver clear and visually appealing content to remote clients. As traditional marketing channels were limited, businesses ramped up their digital marketing efforts, including social media campaigns and content marketing. Image optimization played a crucial role in optimizing visuals for digital marketing channels, improving engagement and overall campaign performance.
Russia-Ukraine War Impact Analysis
Supply chains were disrupted by the conflicts, particularly if major participants in the image optimization sector depended on parts, technology or personnel from conflict-affected areas. Companies in the image optimization industry see higher expenses as a result of supply chain interruptions or modifications, which might have an impact on their pricing and profitability. Geopolitical tensions generate uncertainty in international markets, which makes firms more cautious when implementing new technologies or services, such as image optimization solutions and cause them to postpone investments and spend carefully.
Major key players reassess their operations and partnerships in regions directly affected by the conflict, potentially leading to shifts in market dynamics and competition. In response to geopolitical events and market changes, companies in the image optimization market prioritize certain areas of technology development, such as cybersecurity, data protection or alternative sourcing strategies, to mitigate risks and adapt to the evolving landscape. Geopolitical tensions can also lead to changes in regulatory environments, trade policies or data protection laws, which impact how companies operate and offer image optimization solutions globally.
By Component
- Software
- Services
By Deployment
- Cloud-Based
- On-Premises
By Enterprise Size
- Small and Medium Enterprises
- Large Enterprises
By Technology
- Machine Learning-Based Optimization
- AI-Powered Optimization
- Manual Optimization
By End-User
- E-commerce and Retail
- Media and Entertainment
- Travel and Hospitality
- Healthcare and Life Sciences
- Education
- Others
By Region
- North America
- U.S.
- Canada
- Mexico
- Europe
- Germany
- UK
- France
- Italy
- Spain
- Rest of Europe
- South America
- Brazil
- Argentina
- Rest of South America
- Asia-Pacific
- China
- India
- Japan
- Australia
- Rest of Asia-Pacific
- Middle East and Africa
Key Developments
- On March 13, 2024, Cloudinary, a video and image technology platform announced a series of new intelligent image optimization capabilities such as Automatic Crop (c_auto). The company also launched its latest generative AI innovation which helps to improve image quality and produces professional-looking results, as well as Enhanced Downscaling.
- On November 09, 2021, Edgemesh added image optimization upgrade to accelerate e-commerce sites for the holiday shopping season. To support E-Commerce customer the company upgraded includes automatic optimization of every image on customer sites, helping to eliminate a laborious and expensive development task.
- On March 08, 2024, ImageEngine launched a developer program, opening the value of image-optimizing CDNS to developers and small businesses. It is free alternative to its flagship service. As long as consumption remains under 10GB of monthly bandwidth, this new tier will give developers, startups and small enterprises free access to cutting-edge picture optimization technologies.
Why Purchase the Report?
- To visualize the global image optimization market segmentation based on component, deployment, enterprise size, technology, end-user and region, as well as understand key commercial assets and players.
- Identify commercial opportunities by analyzing trends and co-development.
- Excel data sheet with numerous data points of image optimization market-level with all segments.
- PDF report consists of a comprehensive analysis after exhaustive qualitative interviews and an in-depth study.
- Product mapping available as excel consisting of key products of all the major players.
The global image optimization market report would provide approximately 78 tables, 72 figures and 180 Pages.
Target Audience 2024
- Manufacturers/ Buyers
- Industry Investors/Investment Bankers
- Research Professionals
- Emerging Companies
Table of Contents
1.Methodology and Scope
- 1.1.Research Methodology
- 1.2.Research Objective and Scope of the Report
2.Definition and Overview
3.Executive Summary
- 3.1.Snippet by Component
- 3.2.Snippet by Deployment
- 3.3.Snippet by Enterprise Size
- 3.4.Snippet by Technology
- 3.5.Snippet by End-User
- 3.6.Snippet by Region
4.Dynamics
- 4.1.Impacting Factors
- 4.1.1.Drivers
- 4.1.1.1.Rapid Growth of Digital Content
- 4.1.1.2.E-commerce Expansion
- 4.1.2.Restraints
- 4.1.2.1.Complexity and Technical Expertise
- 4.1.3.Opportunity
- 4.1.4.Impact Analysis
- 4.1.1.Drivers
5.Industry Analysis
- 5.1.Porter's Five Force Analysis
- 5.2.Supply Chain Analysis
- 5.3.Pricing Analysis
- 5.4.Regulatory Analysis
- 5.5.Russia-Ukraine War Impact Analysis
- 5.6.DMI Opinion
6.COVID-19 Analysis
- 6.1.Analysis of COVID-19
- 6.1.1.Scenario Before COVID-19
- 6.1.2.Scenario During COVID-19
- 6.1.3.Scenario Post COVID-19
- 6.2.Pricing Dynamics Amid COVID-19
- 6.3.Demand-Supply Spectrum
- 6.4.Government Initiatives Related to the Market During Pandemic
- 6.5.Manufacturers Strategic Initiatives
- 6.6.Conclusion
7.By Component
- 7.1.Introduction
- 7.1.1.Market Size Analysis and Y-o-Y Growth Analysis (%), By Component
- 7.1.2.Market Attractiveness Index, By Component
- 7.2.Software*
- 7.2.1.Introduction
- 7.2.2.Market Size Analysis and Y-o-Y Growth Analysis (%)
- 7.3.Services
8.By Deployment
- 8.1.Introduction
- 8.1.1.Market Size Analysis and Y-o-Y Growth Analysis (%), By Deployment
- 8.1.2.Market Attractiveness Index, By Deployment
- 8.2.Cloud-Based*
- 8.2.1.Introduction
- 8.2.2.Market Size Analysis and Y-o-Y Growth Analysis (%)
- 8.3.On-Premises
9.By Enterprise Size
- 9.1.Introduction
- 9.1.1.Market Size Analysis and Y-o-Y Growth Analysis (%), By Enterprise Size
- 9.1.2.Market Attractiveness Index, By Enterprise Size
- 9.2.Small and Medium Enterprises*
- 9.2.1.Introduction
- 9.2.2.Market Size Analysis and Y-o-Y Growth Analysis (%)
- 9.3.Large Enterprises
10.By Technology
- 10.1.Introduction
- 10.1.1.Market Size Analysis and Y-o-Y Growth Analysis (%), By Technology
- 10.1.2.Market Attractiveness Index, By Technology
- 10.2.Machine Learning-Based Optimization*
- 10.2.1.Introduction
- 10.2.2.Market Size Analysis and Y-o-Y Growth Analysis (%)
- 10.3.AI-Powered Optimization
- 10.4.Manual Optimization
11.By End-User
- 11.1.Introduction
- 11.1.1.Market Size Analysis and Y-o-Y Growth Analysis (%), By End-User
- 11.1.2.Market Attractiveness Index, By End-User
- 11.2.E-commerce and Retail*
- 11.2.1.Introduction
- 11.2.2.Market Size Analysis and Y-o-Y Growth Analysis (%)
- 11.3.Media and Entertainment
- 11.4.Travel and Hospitality
- 11.5.Healthcare and Life Sciences
- 11.6.Education
- 11.7.Others
12.By Region
- 12.1.Introduction
- 12.1.1.Market Size Analysis and Y-o-Y Growth Analysis (%), By Region
- 12.1.2.Market Attractiveness Index, By Region
- 12.2.North America
- 12.2.1.Introduction
- 12.2.2.Key Region-Specific Dynamics
- 12.2.3.Market Size Analysis and Y-o-Y Growth Analysis (%), By Component
- 12.2.4.Market Size Analysis and Y-o-Y Growth Analysis (%), By Type
- 12.2.5.Market Size Analysis and Y-o-Y Growth Analysis (%), By Enterprise Size
- 12.2.6.Market Size Analysis and Y-o-Y Growth Analysis (%), By Application
- 12.2.7.Market Size Analysis and Y-o-Y Growth Analysis (%), By Country
- 12.2.7.1.U.S.
- 12.2.7.2.Canada
- 12.2.7.3.Mexico
- 12.3.Europe
- 12.3.1.Introduction
- 12.3.2.Key Region-Specific Dynamics
- 12.3.3.Market Size Analysis and Y-o-Y Growth Analysis (%), By Component
- 12.3.4.Market Size Analysis and Y-o-Y Growth Analysis (%), By Deployment
- 12.3.5.Market Size Analysis and Y-o-Y Growth Analysis (%), By Enterprise Size
- 12.3.6.Market Size Analysis and Y-o-Y Growth Analysis (%), By Technology
- 12.3.7.Market Size Analysis and Y-o-Y Growth Analysis (%), By End-User
- 12.3.8.Market Size Analysis and Y-o-Y Growth Analysis (%), By Country
- 12.3.8.1.Germany
- 12.3.8.2.UK
- 12.3.8.3.France
- 12.3.8.4.Italy
- 12.3.8.5.Spain
- 12.3.8.6.Rest of Europe
- 12.4.South America
- 12.4.1.Introduction
- 12.4.2.Key Region-Specific Dynamics
- 12.4.3.Market Size Analysis and Y-o-Y Growth Analysis (%), By Component
- 12.4.4.Market Size Analysis and Y-o-Y Growth Analysis (%), By Deployment
- 12.4.5.Market Size Analysis and Y-o-Y Growth Analysis (%), By Enterprise Size
- 12.4.6.Market Size Analysis and Y-o-Y Growth Analysis (%), By Technology
- 12.4.7.Market Size Analysis and Y-o-Y Growth Analysis (%), By End-User
- 12.4.8.Market Size Analysis and Y-o-Y Growth Analysis (%), By Country
- 12.4.8.1.Brazil
- 12.4.8.2.Argentina
- 12.4.8.3.Rest of South America
- 12.5.Asia-Pacific
- 12.5.1.Introduction
- 12.5.2.Key Region-Specific Dynamics
- 12.5.3.Market Size Analysis and Y-o-Y Growth Analysis (%), By Component
- 12.5.4.Market Size Analysis and Y-o-Y Growth Analysis (%), By Deployment
- 12.5.5.Market Size Analysis and Y-o-Y Growth Analysis (%), By Enterprise Size
- 12.5.6.Market Size Analysis and Y-o-Y Growth Analysis (%), By Technology
- 12.5.7.Market Size Analysis and Y-o-Y Growth Analysis (%), By End-User
- 12.5.8.Market Size Analysis and Y-o-Y Growth Analysis (%), By Country
- 12.5.8.1.China
- 12.5.8.2.India
- 12.5.8.3.Japan
- 12.5.8.4.Australia
- 12.5.8.5.Rest of Asia-Pacific
- 12.6.Middle East and Africa
- 12.6.1.Introduction
- 12.6.2.Key Region-Specific Dynamics
- 12.6.3.Market Size Analysis and Y-o-Y Growth Analysis (%), By Component
- 12.6.4.Market Size Analysis and Y-o-Y Growth Analysis (%), By Deployment
- 12.6.5.Market Size Analysis and Y-o-Y Growth Analysis (%), By Enterprise Size
- 12.6.6.Market Size Analysis and Y-o-Y Growth Analysis (%), By Technology
- 12.6.7.Market Size Analysis and Y-o-Y Growth Analysis (%), By End-User
13.Competitive Landscape
- 13.1.Competitive Scenario
- 13.2.Market Positioning/Share Analysis
- 13.3.Mergers and Acquisitions Analysis
14.Company Profiles
- 14.1.TinyIMG*
- 14.1.1.Company Overview
- 14.1.2.Product Portfolio and Description
- 14.1.3.Financial Overview
- 14.1.4.Key Developments
- 14.2.Nekkra UG
- 14.3.ShortPixel
- 14.4.Piio
- 14.5.ImageKit.io
- 14.6.imgix
- 14.7.Cloudinary
- 14.8.Imagify
- 14.9.Gumlet
- 14.10.Scaleflex
LIST NOT EXHAUSTIVE
15.Appendix
- 15.1.About Us and Services
- 15.2.Contact Us
