|
|
市場調査レポート
商品コード
1455739
クロレラ成分の世界市場-2023年~2030年Global Chlorella Ingredients Market - 2023-2030 |
||||||
|
|
|||||||
カスタマイズ可能
適宜更新あり
|
|||||||


| クロレラ成分の世界市場-2023年~2030年 |
|
出版日: 2024年03月26日
発行: DataM Intelligence
ページ情報: 英文 220 Pages
納期: 即日から翌営業日
|

- 全表示
- 概要
- 目次
概要
クロレラ成分の世界市場は、2022年に1億4,187万米ドルに達し、2023年から2030年の予測期間中に7.2%のCAGRで成長し、2030年までに2億4,742万米ドルに達すると予想されます。
ヴィーガン、非遺伝子組み換えとコーシャダイエットパターンの動向の上昇は、様々な食品や非食品アプリケーションにさらされるようにクロレラ成分のような栄養製品のためのより良い機会を与えます。クロレラ成分の天然と持続可能な特性は、食品、飼料やパーソナルケア製品での使用をサポートしています。
世界新製品データベースによると、2022年には、米国で発売された新しいスキンケア製品の22.2%がクロレラやスピルリナで構成されています。さらに、継続的な研究開発活動、食品・飲料業界の進歩や機能性成分の幅広い使用は、製品の価値を向上させ、市場の成長を促進します。
人口の増加と様々な製品生産のアプリケーションで、有機および持続可能な成分の需要の増加は、世界市場の3分の1に北米の市場規模を拡大しています。急速な都市化、消費者の可処分所得の増加、あらゆる年齢層における藻類ベースのサプリメントの人気の高まりが市場の成長を後押ししています。
ダイナミクス
クロレラ成分の利点についての意識の高まり
クロレラ成分は、その健康上の利点のために健康志向の人々の間で動向しています。豊富なビタミン、ミネラル、クロレラ成分中の他の必須栄養素は、彼らの健康状態を改善するために様々な食品の種類を採用する準備ができている人々のためのより良い選択肢を作り、それらの栄養特性を高める。それは抗酸化特性を有し、胃腸の健康を改善する上で重要な役割を果たしています。
クロレラは、いくつかの健康状態に対処する能力のために医療分野で様々なアプリケーションを持っています。それはがんを予防するための薬用成分として使用されています。それは体から毒素を一掃し、免疫システムを改善し、白血球数を開発しています。クロレラは、インフルエンザワクチンにもっと反応し、放射線治療に役立ちます。クロレラ成分は、体内から重金属や有害化合物を除去するために使用するために人気があります。
クロレラは、クッキーなどのスナック菓子や食品・飲料の製造に使用されています。ヨーグルト、アイスクリームや他のスナック菓子の製造に使用されています。さらに、世界的に人々は安全で環境に優しいパーソナルケア製品を探しています。彼らのスキンケア製品や化粧品の成分への消費者の焦点の増加と天然スキンケア成分の必要性は、この分野でのクロレラ成分の市場を推進しています。
ヴィーガンタンパク質の需要の高まり
菜食主義は、健康志向の人々の間で世界の動向です。動物由来の製品から栄養特性を持つ代替製品への消費者の嗜好の大きなシフトは、積極的に市場の成長を推進しています。人々は、動物性製品に起因する健康や環境への懸念のために、動物性製品から離れ、栄養要件を満たすために植物由来のタンパク質やその他の栄養素を採用しています。
NIHによると、クロレラは、植物由来のソースでは見られないビタミンDとビタミンB12が含まれています。クロレラは、約55~60%のタンパク質で構成されています。クロレラ成分の高いタンパク質含量は、動物性タンパク質の代替としての使用を推進しています。10%のビタミンとミネラルと5%の繊維は、クロレラは、食品や飲料製品で、より栄養価の高いヴィーガン原料になります。
高コスト
クロレラ成分の高価な性質は、アプリケーションの一部でその使用を制限することができます。クロレラは、その細胞壁からその栄養素を解放するためにいくつかのメカニズムを経る必要があります。その栄養素を放出するために、その細胞壁の破壊は高価なプロセスです。熱加水分解などの様々な技術の使用は、生産コストを追加します。酵素やその他の不可欠な資源の使用は、製造経費を増加させます。
クロレラ成分の高価な機械や繊細な処理は、食品や医薬品分野などの用途で使用するために必要とされます。クロレラの高い製造コストは、市場の成長を抑制し、完成品の高コストにつながります。さらに、クロレラ成分の利点についての消費者の意識の欠如は、市場の成長を妨げます。
目次
第1章 調査手法と調査範囲
第2章 定義と概要
第3章 エグゼクティブサマリー
第4章 市場力学
- 影響要因
- 促進要因
- クロレラ成分の利点についての意識の高まり
- ヴィーガンタンパク質に対する需要の高まり
- 抑制要因
- 高コスト
- 機会
- 影響分析
- 促進要因
第5章 産業分析
- ポーターのファイブフォース分析
- サプライチェーン分析
- 価格分析
- 規制分析
第6章 COVID-19分析
第7章 供給源別
- 海洋水
- 淡水
第8章 形態別
- 液体
- 粉末
- その他
第9章 性質別
- 有機
- 従来型
第10章 消費者年齢層別
- 子供
- 成人
- 高齢者
第11章 流通チャネル別
- スーパーマーケット/ハイパーマーケット
- 健康ストア
- コンビニエンスストア
- オンラインストア
- その他
第12章 用途別
- 食品・飲料
- 健康・医療
- 動物飼料
- ペットフード
- 化粧品・パーソナルケア
- 肥料
- その他
第13章 エンドユーザー別
- 産業部門
- 小売部門
第14章 地域別
- 北米
- 米国
- カナダ
- メキシコ
- 欧州
- ドイツ
- 英国
- フランス
- イタリア
- スペイン
- その他欧州
- 南米
- ブラジル
- アルゼンチン
- その他南米
- アジア太平洋
- 中国
- インド
- 日本
- オーストラリア
- その他アジア太平洋地域
- 中東・アフリカ
第15章 競合情勢
- 競合シナリオ
- 市況/シェア分析
- M&A分析
第16章 競合情勢
- 競合シナリオ
- 市況/シェア分析
- M&A分析
第17章 企業プロファイル
- Parry Nutraceuticals
- 会社概要
- 製品ポートフォリオと説明
- 財務概要
- 主な発展
- Seagrass Tech Private Limited
- Sun Chlorella Corporation London
- Nutriphys
- Taiwan Chlorella Manufacturing Company
- Yaeyama Chlorella
- Gong Bih Enterprise
- Fuqing King Dnarmsa Spirulina Co. Ltd.
- Algenuity
- Tianjin Norland Biotech
第18章 付録
Overview
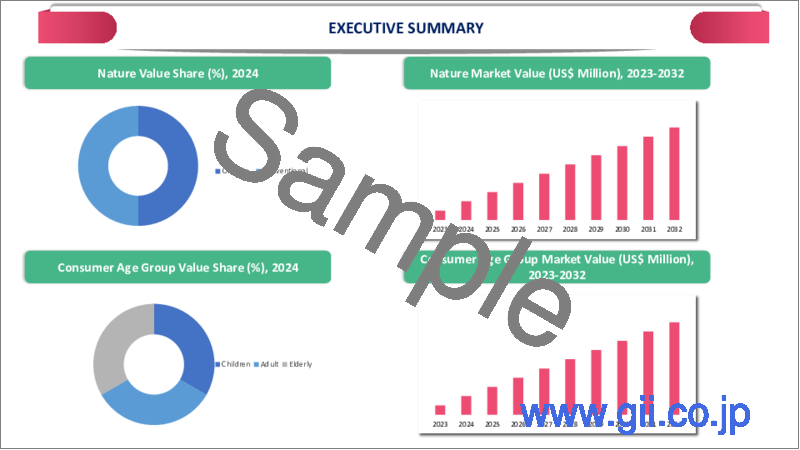
Global Chlorella Ingredients Market reached US$ 141.87 million in 2022 and is expected to reach US$ 247.42 million by 2030, growing with a CAGR of 7.2% during the forecast period 2023-2030.
The rising trend of vegan, non-GMO and kosher diet patterns gives a better opportunity for nutrient products like chlorella ingredients to get exposed to various food and non-food applications. The natural and sustainable properties of chlorella ingredients support its use in food, feed and personal care products.
According to the Global New Product Database, in 2022, 22.2% of the new skincare products that were launched in U.S. are composed of chlorella or spirulina. Further, the continuous R&D activities, advancements in the food and beverage industry and wide use of functional ingredients improve the product value fuel the market growth.
The rising population and increased demand for organic and sustainable ingredients in the application of various product productions expand the market size of North America to 1/3rd of global market. Rapid urbanization, increasing consumer disposable incomes and the growing popularity of algal-based supplements among all age groups fuel the market growth.
Dynamics
Increased Awareness About the Benefits of Chlorella Ingredients
The chlorella ingredients are trending among health-conscious people due to their health advantages. Rich vitamins, minerals and other essential nutrients in the chlorella ingredients increase their nutritional properties, making them a better choice for people ready to adopt various food types to improve their health conditions. It has antioxidant properties and plays a key role in improving gastrointestinal health.
Chlorella has various applications in the medical field due to its ability to deal with some health conditions. It is used as a medicinal ingredient for preventing cancer. It clears out toxins from the body, improves the immune system and develops white blood cell count. Chlorella reacts more to the flu vaccine and helps with radiation treatment. Chlorella ingredients are popular for their use in eliminating heavy metals and harmful compounds from the body.
Chlorella is used in manufacturing snacks such as cookies and other food and beverage products. They are used in yogurt, ice cream and other snack production. Further, globally people are looking for safe and eco-friendly personal care products. Increased consumer focus on the ingredients in their skincare products and cosmetics and the need for natural skin care ingredients drive the market for chlorella ingredients in this field.
Rising Demand for Vegan Protein
Veganism is a global trend among health-conscious people. The greater shift in consumer preferences from animal-based products to alternative products with nutritional properties positively drives market growth. People are adopting plant-derived proteins and other nutrients to meet their nutritional requirements leaving behind animal-based products, mostly due to health and environmental concerns caused by animal products.
According to NIH, chlorella contains Vit D and Vit B12, which are not seen in plant-derived sources. Chlorella is composed of about 55-60% protein. The high protein content of chlorella ingredients drives its use as a substitute for animal-based protein. 10% vitamins and minerals and 5% fibre make chlorella a more nutritious vegan ingredient in food and beverage products.
High Cost
The expensive nature of chlorella ingredients may limit its use in some of the applications. Chlorella needs to undergo a few mechanisms in order to free its nutrients from its cell wall. The breakdown of its cell wall to release its nutrient content is an expensive process. The use of various techniques, such as thermal hydrolysis, adds to production costs. The use of enzymes and other essential resources increases manufacturing expenses.
Expensive machinery and delicate processing of chlorella ingredients are needed for their use in applications such as food and pharmaceutical sectors. High manufacturing costs of chlorella result in the high cost of finished goods, retraining the market growth. Further, a lack of consumer awareness about the benefits of chlorella ingredients hinders market growth.
Segment Analysis
The global chlorella ingredients market is segmented based on source, form, nature, consumer age group, distribution channel, application, end-user and region.
Increased Use in Various Industries
The global chlorella ingredients market is segmented based on their end-user into the industrial and retail sectors. The industrial sector of chlorella ingredients held the largest segment due to its increased application in various industries. The food and beverage, health and medical industries widely use chlorella ingredients in their product productions.
The chlorella ingredients are successfully incorporated into various food products such as bread, pasta and cookies. Chlorella ingredient is used in food and beverage sectors to enhance colour and flavour. They also help in inducing freshness in the product. Chlorella's phenolic compounds are used in the medical and health industries. In feed and pet food industries, chlorella ingredients are used as its high protein and chlorophyll content strengthens animal health.
Geographical Penetration
Demand for Healthy Food Products in North America
North America holds the largest share of the global chlorella ingredients market, due to increased health consciousness among people of this region. The growing health concerns drive consumers to take up healthy and nutritious products to improve their health and well-being. Chlorella ingredients induce the growing popularity of food products.
The emerging advancements in the food industries and new product launches infused with chlorella ingredients boost this region's chlorella ingredients market growth. According to the World Animal Foundation, around 6 % of the U.S. population is declared vegan. The rising trend of veganism fuels the demand for plant and algal-based food ingredients, fueling the market.
Increased demand for natural skincare products and the high use of chlorella ingredients due to its soothing and hydrating properties make it a popular choice. This region's high demand for conventional products with nutritional benefits drives market growth. Increasing health consciousness among people, raising disposable incomes and improving purchasing power of people boost this region's market growth.
Competitive Landscape
The major global players in the market include Parry Nutraceuticals, Seagrass Tech Private Limited, Sun Chlorella Corporation London, Nutriphys, Taiwan Chlorella Manufacturing Company, Yaeyama Chlorella, Gong Bih Enterprise, Fuqing King Dnarmsa Spirulina Co. Ltd., Algenuity and Tianjin Norland Biotech.
COVID-19 Impact Analysis
The outbreak of the COVID-19 pandemic had a mixed impact on the global chlorella ingredients market. The lack of resources, such as raw materials and labor, decreased production at the industrial level. The lockdowns and strict government regulations about social distancing also had a negative impact on the production and distribution of the products.
Supply chain and distribution channel disturbances critically affected the reach of raw materials to manufacturing units and the final product to consumers. The interruption of the whole demand-supply chain created economic crises for some manufacturers. Internationally, restrictions impacted the import and export procedures.
The pandemic made people realise the importance of nutritious food products for a healthy life. Consumers changed their food habits and increased their intake of special foods with nutritious ingredients such as chlorella. The increased consumption of food products with chlorella ingredients to improve their health positively affected the market. The wide use of online platforms for food and grocery shopping boosted product sales.
Russia- Ukraine War Impact
The Russia-Ukraine war negatively impacted every possible sector, especially food. The scarcity of raw materials and reduced workforce halted product production at the industrial level. The interrupted processes at the industrial level badly impact the manufacturers' demand-supply chain. Unfavourable conditions halted the distribution channels.
The trade functions were badly affected due to war. Disturbances in the import and export trade transactions resulted in economic disturbances globally. Issues of food security developed, disturbing manufacturers and consumers. The political and economic uncertainty created by the war had a negative impact on the chlorella ingredients market.
By Source
- Marine Water
- Fresh Water
By Form
- Liquid
- Powder
- Others
By Nature
- Organic
- Conventional
By Consumer Age Group
- Children
- Adult
- Elderly
By Distribution Channel
- Supermarkets/Hypermarkets
- Health Stores
- Convenience Stores
- Online Stores
- Others
By Application
- Food and Beverages
- Health and Medical
- Animal Feed
- Pet Food
- Cosmetics and Personal Care
- Fertilizers
- Others
By End-User
- Industrial Sector
- Retail Sector
By Region
- North America
- U.S.
- Canada
- Mexico
- Europe
- Germany
- UK
- France
- Italy
- Russia
- Rest of Europe
- South America
- Brazil
- Argentina
- Rest of South America
- Asia-Pacific
- China
- India
- Japan
- Australia
- Rest of Asia-Pacific
- Middle East and Africa
Key Developments
- In November 2022, Allma, a Portuguese microalgae supplier, introduced new crispy chlorella snacks, including carrot, lemon and rosemary.
- In November 2022, Singapore-based Sophie's BioNutrients announced their collaboration with the Danish Technological Institute to introduce their new plant-based frozen ice cream from chlorella protein concentrate. This product is growing in popularity due to its dairy-free nature.
- In September 2022, Europe's largest chlorella algae facilities in Holland were purchased by a Danish-based food technology company, Aliga Microalgae. This facility is equipped with modern production units and helps commercialise chlorella products.
Why Purchase the Report?
- To visualize the global chlorella ingredients market segmentation based on source, form, nature, consumer age group, distribution channel, application, end-user and region, as well as understand key commercial assets and players.
- Identify commercial opportunities by analyzing trends and co-development.
- Excel data sheet with numerous data points of chlorella ingredients market-level with all segments.
- PDF report consists of a comprehensive analysis after exhaustive qualitative interviews and an in-depth study.
- Product mapping available as excel consisting of key products of all the major players.
The global chlorella ingredients market report would provide approximately 96 tables, 101 figures and 220 Pages.
Target Audience 2023
- Manufacturers/ Buyers
- Industry Investors/Investment Bankers
- Research Professionals
- Emerging Companies
Table of Contents
1.Methodology and Scope
- 1.1.Research Methodology
- 1.2.Research Objective and Scope of the Report
2.Definition and Overview
3.Executive Summary
- 3.1.Snippet by Source
- 3.2.Snippet by Form
- 3.3.Snippet by Nature
- 3.4.Snippet by Consumer Age Group
- 3.5.Snippet by Distribution Channel
- 3.6.Snippet by Application
- 3.7.Snippet by End-User
- 3.8.Snippet by Region
4.Dynamics
- 4.1.Impacting Factors
- 4.1.1.Drivers
- 4.1.1.1.Increased Awareness About the Benefits of Chlorella Ingredients
- 4.1.1.2.Rising Demand for Vegan Protein
- 4.1.2.Restraints
- 4.1.2.1.High Cost
- 4.1.3.Opportunity
- 4.1.4.Impact Analysis
- 4.1.1.Drivers
5.Industry Analysis
- 5.1.Porter's Five Force Analysis
- 5.2.Supply Chain Analysis
- 5.3.Pricing Analysis
- 5.4.Regulatory Analysis
6.COVID-19 Analysis
- 6.1.Analysis of COVID-19
- 6.1.1.Scenario Before COVID
- 6.1.2.Scenario During COVID
- 6.1.3.Scenario Post COVID
- 6.2.Pricing Dynamics Amid COVID-19
- 6.3.Demand-Supply Spectrum
- 6.4.Government Initiatives Related to the Market During Pandemic
- 6.5.Manufacturers Strategic Initiatives
- 6.6.Conclusion
7.By Source
- 7.1.Introduction
- 7.1.1.Market Size Analysis and Y-o-Y Growth Analysis (%), By Source
- 7.1.2.Market Attractiveness Index, By Source
- 7.2.Marine Water
- 7.2.1.Introduction
- 7.2.2.Market Size Analysis and Y-o-Y Growth Analysis (%)
- 7.3.Fresh Water
8.By Form
- 8.1.Introduction
- 8.1.1.Market Size Analysis and Y-o-Y Growth Analysis (%), By Form
- 8.1.2.Market Attractiveness Index, By Form
- 8.2.Liquid
- 8.2.1.Introduction
- 8.2.2.Market Size Analysis and Y-o-Y Growth Analysis (%)
- 8.3.Powder
- 8.4.Others
9.By Nature
- 9.1.Introduction
- 9.1.1.Market Size Analysis and Y-o-Y Growth Analysis (%), By Nature
- 9.1.2.Market Attractiveness Index, By Nature
- 9.2.Organic
- 9.2.1.Introduction
- 9.2.2.Market Size Analysis and Y-o-Y Growth Analysis (%)
- 9.3.Conventional
10.By Consumer Age Group
- 10.1.Introduction
- 10.1.1.Market Size Analysis and Y-o-Y Growth Analysis (%), By Consumer Age Group
- 10.1.2.Market Attractiveness Index, By Consumer Age Group
- 10.2.Children
- 10.2.1.Introduction
- 10.2.2.Market Size Analysis and Y-o-Y Growth Analysis (%)
- 10.3.Adult
- 10.4.Elderly
11.By Distribution Channel
- 11.1.Introduction
- 11.1.1.Market Size Analysis and Y-o-Y Growth Analysis (%), By Distribution Channel
- 11.1.2.Market Attractiveness Index, By Distribution Channel
- 11.2.Supermarkets/Hypermarkets
- 11.2.1.Introduction
- 11.2.2.Market Size Analysis and Y-o-Y Growth Analysis (%)
- 11.3.Health Stores
- 11.4.Convenience Stores
- 11.5.Online Stores
- 11.6.Others
12.By Application
- 12.1.1.Introduction
- 12.1.2.Market Size Analysis and Y-o-Y Growth Analysis (%), By Application
- 12.1.3.Market Attractiveness Index, By Application
- 12.2.Food and Beverages
- 12.2.1.Introduction
- 12.2.2.Market Size Analysis and Y-o-Y Growth Analysis (%)
- 12.3.Health and Medical
- 12.4.Animal Feed
- 12.5.Pet Food
- 12.6.Cosmetics and Personal Care
- 12.7.Fertilizers
- 12.8.Others
13.By End-User
- 13.1.Introduction
- 13.1.1.Market Size Analysis and Y-o-Y Growth Analysis (%), By End-User
- 13.1.2.Market Attractiveness Index, By End-User
- 13.2.Industrial Sector
- 13.2.1.Introduction
- 13.2.2.Market Size Analysis and Y-o-Y Growth Analysis (%)
- 13.3.Retail Sector
14.By Region
- 14.1.Introduction
- 14.1.1.Market Size Analysis and Y-o-Y Growth Analysis (%), By Region
- 14.1.2.Market Attractiveness Index, By Region
- 14.2.North America
- 14.2.1.Introduction
- 14.2.2.Key Region-Specific Dynamics
- 14.2.3.Market Size Analysis and Y-o-Y Growth Analysis (%), By Source
- 14.2.4.Market Size Analysis and Y-o-Y Growth Analysis (%), By Form
- 14.2.5.Market Size Analysis and Y-o-Y Growth Analysis (%), By Nature
- 14.2.6.Market Size Analysis and Y-o-Y Growth Analysis (%), By Consumer Age Group
- 14.2.7.Market Size Analysis and Y-o-Y Growth Analysis (%), By Distribution Channel
- 14.2.8.Market Size Analysis and Y-o-Y Growth Analysis (%), By Application
- 14.2.9.Market Size Analysis and Y-o-Y Growth Analysis (%), By End-User
- 14.2.10.Market Size Analysis and Y-o-Y Growth Analysis (%), By Country
- 14.2.10.1.U.S.
- 14.2.10.2.Canada
- 14.2.10.3.Mexico
- 14.3.Europe
- 14.3.1.Introduction
- 14.3.2.Key Region-Specific Dynamics
- 14.3.3.Market Size Analysis and Y-o-Y Growth Analysis (%), By Source
- 14.3.4.Market Size Analysis and Y-o-Y Growth Analysis (%), By Form
- 14.3.5.Market Size Analysis and Y-o-Y Growth Analysis (%), By Nature
- 14.3.6.Market Size Analysis and Y-o-Y Growth Analysis (%), By Consumer Age Group
- 14.3.7.Market Size Analysis and Y-o-Y Growth Analysis (%), By Distribution Channel
- 14.3.8.Market Size Analysis and Y-o-Y Growth Analysis (%), By Application
- 14.3.9.Market Size Analysis and Y-o-Y Growth Analysis (%), By End-User
- 14.3.10.Market Size Analysis and Y-o-Y Growth Analysis (%), By Country
- 14.3.10.1.Germany
- 14.3.10.2.U.K.
- 14.3.10.3.France
- 14.3.10.4.Italy
- 14.3.10.5.Spain
- 14.3.10.6.Rest of Europe
- 14.4.South America
- 14.4.1.Introduction
- 14.4.2.Key Region-Specific Dynamics
- 14.4.3.Market Size Analysis and Y-o-Y Growth Analysis (%), By Source
- 14.4.4.Market Size Analysis and Y-o-Y Growth Analysis (%), By Form
- 14.4.5.Market Size Analysis and Y-o-Y Growth Analysis (%), By Nature
- 14.4.6.Market Size Analysis and Y-o-Y Growth Analysis (%), By Consumer Age Group
- 14.4.7.Market Size Analysis and Y-o-Y Growth Analysis (%), By Distribution Channel
- 14.4.8.Market Size Analysis and Y-o-Y Growth Analysis (%), By Application
- 14.4.9.Market Size Analysis and Y-o-Y Growth Analysis (%), By End-User
- 14.4.10.Market Size Analysis and Y-o-Y Growth Analysis (%), By Country
- 14.4.10.1.Brazil
- 14.4.10.2.Argentina
- 14.4.10.3.Rest of South America
- 14.5.Asia-Pacific
- 14.5.1.Introduction
- 14.5.2.Key Region-Specific Dynamics
- 14.5.3.Market Size Analysis and Y-o-Y Growth Analysis (%), By Source
- 14.5.4.Market Size Analysis and Y-o-Y Growth Analysis (%), By Form
- 14.5.5.Market Size Analysis and Y-o-Y Growth Analysis (%), By Nature
- 14.5.6.Market Size Analysis and Y-o-Y Growth Analysis (%), By Consumer Age Group
- 14.5.7.Market Size Analysis and Y-o-Y Growth Analysis (%), By Distribution Channel
- 14.5.8.Market Size Analysis and Y-o-Y Growth Analysis (%), By Application
- 14.5.9.Market Size Analysis and Y-o-Y Growth Analysis (%), By End-User
- 14.5.10.Market Size Analysis and Y-o-Y Growth Analysis (%), By Country
- 14.5.10.1.China
- 14.5.10.2.India
- 14.5.10.3.Japan
- 14.5.10.4.Australia
- 14.5.10.5.Rest of Asia-Pacific
- 14.6.Middle East and Africa
- 14.6.1.Introduction
- 14.6.2.Key Region-Specific Dynamics
- 14.6.3.Market Size Analysis and Y-o-Y Growth Analysis (%), By Source
- 14.6.4.Market Size Analysis and Y-o-Y Growth Analysis (%), By Form
- 14.6.5.Market Size Analysis and Y-o-Y Growth Analysis (%), By Nature
- 14.6.6.Market Size Analysis and Y-o-Y Growth Analysis (%), By Consumer Age Group
- 14.6.7.Market Size Analysis and Y-o-Y Growth Analysis (%), By Distribution Channel
- 14.6.8.Market Size Analysis and Y-o-Y Growth Analysis (%), By Application
- 14.6.9.Market Size Analysis and Y-o-Y Growth Analysis (%), By End-User
15.Competitive Landscape
- 15.1.Competitive Scenario
- 15.2.Market Positioning/Share Analysis
- 15.3.Mergers and Acquisitions Analysis
16.Competitive Landscape
- 16.1.Competitive Scenario
- 16.2.Market Positioning/Share Analysis
- 16.3.Mergers and Acquisitions Analysis
17.Company Profiles
- 17.1.Parry Nutraceuticals
- 17.1.1.Company Overview
- 17.1.2.Product Portfolio and Description
- 17.1.3.Financial Overview
- 17.1.4.Key Developments
- 17.2.Seagrass Tech Private Limited
- 17.3.Sun Chlorella Corporation London
- 17.4.Nutriphys
- 17.5.Taiwan Chlorella Manufacturing Company
- 17.6.Yaeyama Chlorella
- 17.7.Gong Bih Enterprise
- 17.8.Fuqing King Dnarmsa Spirulina Co. Ltd.
- 17.9.Algenuity
- 17.10.Tianjin Norland Biotech
LIST NOT EXHAUSTIVE
18.Appendix
- 18.1.About Us and Services
- 18.2.Contact Us