|
|
市場調査レポート
商品コード
1423510
EPDMゴムの世界市場-2024-2031Global EPDM Rubber Market - 2024-2031 |
||||||
|
|
|||||||
カスタマイズ可能
適宜更新あり
|
|||||||


| EPDMゴムの世界市場-2024-2031 |
|
出版日: 2024年02月09日
発行: DataM Intelligence
ページ情報: 英文 181 Pages
納期: 即日から翌営業日
|

- 全表示
- 概要
- 目次
概要
EPDMゴムの世界市場は2023年に33億米ドルに達し、2031年には53億米ドルに達すると予測され、予測期間2024-2031年のCAGRは6.3%で成長する見込みです。建設業界は、この材料が窓のシールや屋根膜に使用されていることから、EPDMゴム市場の成長に貢献しています。世界のインフラ整備により、EPDMをベースとした製品の需要が増加しています。
欧州は、工業製品および自動車製品の重要な生産拠点です。EPDMゴムに対する欧州の自動車・建設業界のニーズは、一般的な市場力学に大きな影響を与えています。欧州諸国は厳しい環境・品質規制を頻繁に遵守しています。そのため、EPDMゴムのような様々な用途で高級素材の使用が促されています。そのため、欧州はこの地域の製品市場の成長に大きく貢献しています。
ダイナミクス
自動車産業の需要
自動車用のホースやチューブはEPDMゴムで作られています。この部品は、燃料、ブレーキ液、冷却水などの流体を動かすために必要です。EPDMは化学薬品や耐候性に強いため、こうした用途に適しています。
多くの自動車システムでは、EPDMゴムを使用して伸縮継手が作られています。このジョイントは、動きや温度変化に対応することで、自動車全体の信頼性を向上させます。自動車部門では、EPDMゴムの電気絶縁性をケーブル絶縁などの用途に使用しています。これは、自動車の電気システムが意図したとおりに動作することを保証するために必要です。
EPDMゴムの用途拡大
例えば、2020年10月には、Natron NxTシリーズのような特殊インクの導入により、ネオプレン、ニトリル、EPDM、EVAゴムなど、さまざまなゴム基材への印刷が可能になった。これにより、ウェットスーツ、ラバーバンド、靴底など、ゴムをベースにした製品におけるEPDMゴムの用途が広がります。
EPDMゴムへの印刷能力は、スポーツ(ウェットスーツ)、ファッション(靴底)、一般製造(輪ゴム)などの分野で非常に有用です。Natron NxTシリーズインキは、これらの分野特有のニーズに対応し、その結果、製品ラインにおけるEPDMゴムの使用が増加しました。
コスト変動
急激なコスト変動はサプライチェーンの混乱を引き起こすかもしれないです。メーカーは在庫管理、生産スケジューリング、調達活動が困難になる可能性があります。サプライチェーンの混乱は、顧客へのタイムリーな納品に支障をきたし、顧客との関係や市場の成長に悪影響を及ぼす可能性があります。
製品価格に見合った変動がないまま経費が変動すると、EPDMゴム・メーカーの利益率が低下する可能性があります。財務上の負担は、長期的な市場成長に不可欠な研究開発、技術革新、拡張プロジェクトへの投資を制限する可能性があります。したがって、EPDMゴムの製造と価格設定におけるコストの変動は、生産者と川下部門に問題をもたらし、世界のEPDMゴム市場全体の成長を阻害する可能性があります。
エネルギーコストの変動
生産コスト全体がEPDMゴムの市場競争力に影響を与える可能性があります。エネルギーコストが変動的で高い場合、企業は代替材料や代替品とのコスト競争力を維持するのに苦労する可能性があります。企業はより費用対効果の高い代替品を求めるため、市場の成長を妨げる可能性があります。エネルギーコストはEPDMゴムの生産費用のかなりの部分を占める。エネルギー価格の変動は、産業界にとって予算編成や計画に不確実性をもたらす可能性があります。製品価格の調整を伴わないエネルギーコストの急激な上昇は、利益率を低下させ、研究開発や市場拡大のための支出を制限する可能性があります。
自動車や建設などEPDMゴムを製品に使用している業界は、サプライチェーン全体でエネルギーコストが上昇した場合、課題に直面する可能性があります。EPDMゴムを含む商品の価格上昇は、購買決定に影響を与える可能性があり、その結果、これらの川下分野の拡大が制限されます。
目次
第1章 調査手法と調査範囲
第2章 定義と概要
第3章 エグゼクティブサマリー
第4章 市場力学
- 影響要因
- 促進要因
- 自動車産業の需要
- EPDMゴムの用途拡大
- 抑制要因
- コスト変動
- エネルギーコストの変動
- 機会
- 影響分析
- 促進要因
第5章 産業分析
- ポーターのファイブフォース分析
- サプライチェーン分析
- 価格分析
- 規制分析
- ロシア・ウクライナ戦争の影響分析
- DMIの見解
第6章 COVID-19分析
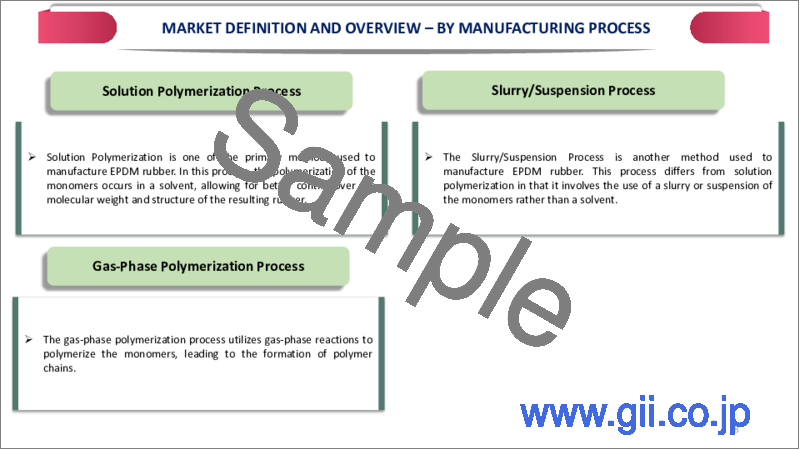
第7章 製造プロセス別
- 溶液重合プロセス
- スラリー/懸濁プロセス
- 気相重合プロセス
第8章 用途
- センシング
- エネルギーハーベスティング
- 熱電変換
- その他
第9章 地域別
- 北米
- 米国
- カナダ
- メキシコ
- 欧州
- ドイツ
- 英国
- フランス
- イタリア
- ロシア
- その他欧州
- 南米
- ブラジル
- アルゼンチン
- その他南米
- アジア太平洋
- 中国
- インド
- 日本
- オーストラリア
- その他アジア太平洋地域
- 中東・アフリカ
第10章 競合情勢
- 競合シナリオ
- 市況/シェア分析
- M&A分析
第11章 企業プロファイル
- Arlanxero
- 会社概要
- 製造プロセスのポートフォリオと説明
- 財務概要
- 主な発展
- Carlisle Companies Incorporated
- Dow Inc.
- Exxon Mobil Corporation
- PetroChina Company Limited
- Versalis S.p.A.
- SK Global Chemical Co. Ltd.
- Mitsui Chemicals Inc.
- Lion Elastomers LLC
- SABIC
第12章 付録
Overview
Global EPDM Rubber Market reached US$ 3.3 billion in 2023 and is expected to reach US$ 5.3 billion by 2031, growing with a CAGR of 6.3% during the forecast period 2024-2031. The construction industry has contributed to the growth of the EPDM rubber market, as the material is used in window seals and roofing membranes. Global infrastructure development has increased demand for products based on EPDM.
Europe is a significant hub for the production of industrial and automotive products. The European automotive and construction industries' need for EPDM rubber has a major impact on the general market dynamics. European nations frequently follow strict environmental and quality regulations. The has prompted the use of premium materials in a variety of applications, such as EPDM rubber. Therefore, Europe contributes to the growth of the regional product market with significant regional market share.
Dynamics
Automotive Industry Demand
Hoses and tubing for automobiles are made from EPDM rubber. The parts are necessary for moving fluids, including fuel, braking fluid and coolant. EPDM is appropriate for these applications because of its resilience to chemicals and weathering.
In many automobile systems, expansion joints are built using EPDM rubber. The joints improve the vehicle's overall dependability by accommodating movement and temperature changes. The automobile sector uses EPDM rubber's electrical insulation qualities for applications like cable insulation. The is necessary to guarantee that the electrical systems in cars operate as intended.
Growing Application of EPDM Rubber
For instance, in October 2020, the introduction of specialized inks, such as the Natron NxT Series, allows for printing on a variety of rubber substrates, including neoprene, nitrile, EPDM and EVA rubbers. The broadens the possible uses of EPDM rubber in products like wetsuits, rubber bands, shoe soles and other rubber-based things.
The ability to print on EPDM rubber is very useful in areas like sporting (wetsuits), fashion (shoe soles) and general manufacturing (rubber bands). The Natron NxT Series inks serve the specific needs of these sectors, resulting in increased use of EPDM rubber in their product lines.
Cost Fluctuations
Rapid cost fluctuates might cause supply chain disruptions. Manufacturers may encounter difficulties managing inventories, production scheduling and procurement activities. Supply chain disruptions may hinder the timely delivery of items to clients, harming customer relationships and market growth.
Fluctuating expenses without commensurate modifications in product prices might lead to lower profit margins for EPDM rubber manufacturers. The financial strain may limit investment in R&D, innovation and expansion projects that are critical for long-term market growth. Therefore, cost fluctuations in EPDM rubber manufacturing and pricing might provide issues for producers and downstream sectors, thereby impeding the overall growth of the global EPDM rubber market.
Volatility in Energy Costs
The entire cost of production can have an impact on EPDM rubber's market competitiveness. When energy costs are variable and high, companies may struggle to remain cost-competitive with alternative materials or substitutes. It can hamper market growth as companies seek more cost-effective alternatives. Energy costs account for a considerable component of EPDM rubber production expenses. Fluctuations in energy prices can cause uncertainty in budgeting and planning for industries. Sudden rises in energy costs without combining adjustments in product prices might reduce profit margins, limiting resources for expenditures in R&D and market expansion.
Industries that utilize EPDM rubber in their products, such as automotive and construction, may encounter challenges if energy costs rise across the supply chain. Higher prices for EPDM rubber-containing items may influence purchase decisions, thereby limiting the expansion of these downstream sectors.
Segment Analysis
The global EPDM rubber market is segmented based on Manufacturing Process, Application and region.
Growing Construction Augments the Product Sale
Roads, bridges and transportation systems are instances of large-scale infrastructure projects that greatly increase demand for EPDM rubber. By strengthening the structural integrity of these projects and guaranteeing that it can endure the stress and movement brought on by high traffic and environmental conditions, the material is used in expansion joints and bridge seals.
Nearly the next fifteen years, global construction output is expected to increase by nearly US$ 4.2 trillion, according to Oxford Economics. globally Construction Futures projects all of the world's major construction markets through 2037, as well as the globally construction sector. Superpower construction markets in China, US and India are responsible for the increase in construction activities from US$ 9.7 trillion in 2022 to US$ 13.9 trillion in 2037. Therefore, burgeoning demand from building and construction end-user segment captures the significant shares in the total global segmental shares.
Geographical Penetration
Established Startup Ecosystem Drives the North American Market
Expanding their capacity allows producers to fulfill the growing need for EPDM rubber in the Asia-Pacific area. The requirement for EPDM rubber, which is widely utilized for its exceptional weather resistance, heat resistance and electrical insulating capabilities, is growing as industries including automotive, construction and electrical continue to expand.
For instance, in 2022, Arlanxeo intended to boost its Changzhou, China, EPDM plant's operation capacity by 15%. Economies of scale are frequently the consequence of increased manufacturing capacity, lowering the cost of production per unit. It may result in EPDM rubber being priced more competitively, increasing its appeal to a wider range of businesses. Reduced costs might also increase demand, which would accelerate market expansion. Therefore, Asia-Pacific is leading the global EPDM rubber market with majority of the global market shares.
COVID-19 Impact Analysis
The manufacture and distribution of EPDM rubbers were impacted by the pandemic's disruption of global supply systems. The supply of EPDM rubbers and related goods may have been hampered by delays in the procurement of raw materials, manufacture and transportation. There may have been delays in the EPDM rubber industry's investment plans and capacity development projects because of economic uncertainties and the necessity for enterprises to prioritize financial security throughout the epidemic.
Price instability was caused by changes in supply and demand, which affected the EPDM rubber market among other markets. Market volatility was caused on by uncertainties over the scope and duration of the epidemic, which had an impact on industry participants' profit margins and pricing policies.
Russia-Ukraine War Impact Analysis
According to a recent assessment by the specialized rubber producer Jager Group, Russia is one of the major exporters to the global rubber market. "Russian suppliers hold double-digit market shares for both polybutadiene (BR) and isobutene-isoprene rubber (IIR)." About 550,000 Tons of carbon black and 240,000 Tons of synthetic rubber were supplied to the European Union by Russian businesses in 2021.
Procurement managers are therefore frantically seeking alternate suppliers. However, it's becoming clear that supply isn't keeping up with demand shortly. Amid the global supply chain crisis, bottlenecks are developing and complicating logistics for necessary raw materials. Therefore, the Russia-Ukraine war has had a negative impact in the global EPDM rubber market.
By Manufacturing Process
- Solution Polymerization Process
- Slurry/Suspension Process
- Gas-Phase Polymerization Process
By Application
- Automotive
- Building and Construction
- Plastic Modifications
- Tires and Tubes
- Wires and Cables
- Lubricant Additives
- Others
By Region
- North America
- U.S.
- Canada
- Mexico
- Europe
- Germany
- UK
- France
- Italy
- Russia
- Rest of Europe
- South America
- Brazil
- Argentina
- Rest of South America
- Asia-Pacific
- China
- India
- Japan
- Australia
- Rest of Asia-Pacific
- Middle East and Africa
Key Developments
- In 2022, Arlanxeo intended to boost its Changzhou, China, EPDM plant's operation capacity by 15%.
- In October 2020, the introduction of specialized inks, such as the Natron NxT Series, allows for printing on a variety of rubber substrates, including neoprene, nitrile, EPDM and EVA rubbers.
- In 2020, to boost the productivity of roofing projects, Carlisle Companies Incorporated produced 60-mil Reinforced Sure-Tough EPDM SAT (Self-Adhering Technology) EPDM.
Competitive Landscape
The major global players in the market include Arlanxero, Carlisle Companies Incorporated, Dow Inc., Exxon Mobil Corporation, PetroChina Company Limited, Versalis S.p.A., SK Global Chemical Co. Ltd., Mitsui Chemicals Inc., Lion Elastomers LLC and SABIC.
Why Purchase the Report?
- To visualize the global EPDM rubber market segmentation based on Manufacturing Process, Application and region, as well as understands key commercial assets and players.
- Identify commercial opportunities by analyzing trends and co-development.
- Excel data sheet with numerous data points of EPDM rubber market-level with all segments.
- PDF report consists of a comprehensive analysis after exhaustive qualitative interviews and an in-depth study.
- Manufacturing Process mapping available as excel consisting of key products of all the major players.
The global EPDM rubber market report would provide approximately 53 tables, 45 figures and 181 Pages.
Target Audience 2024
- Manufacturers/ Buyers
- Industry Investors/Investment Bankers
- Research Professionals
- Emerging Companies
Table of Contents
1. Methodology and Scope
- 1.1. Research Methodology
- 1.2. Research Objective and Scope of the Report
2. Definition and Overview
3. Executive Summary
- 3.1. Snippet by Manufacturing Process
- 3.2. Snippet by Application
- 3.3. Snippet by Region
4. Dynamics
- 4.1. Impacting Factors
- 4.1.1. Drivers
- 4.1.1.1. Automotive Industry Demand
- 4.1.1.2. Growing Application of EPDM Rubber
- 4.1.2. Restraints
- 4.1.2.1. Cost Fluctuations
- 4.1.2.2. Volatility in Energy Costs
- 4.1.3. Opportunity
- 4.1.4. Impact Analysis
- 4.1.1. Drivers
5. Industry Analysis
- 5.1. Porter's Five Force Analysis
- 5.2. Supply Chain Analysis
- 5.3. Pricing Analysis
- 5.4. Regulatory Analysis
- 5.5. Russia-Ukraine War Impact Analysis
- 5.6. DMI Opinion
6. COVID-19 Analysis
- 6.1. Analysis of COVID-19
- 6.1.1. Scenario Before COVID
- 6.1.2. Scenario During COVID
- 6.1.3. Scenario Post COVID
- 6.2. Pricing Dynamics Amid COVID-19
- 6.3. Demand-Supply Spectrum
- 6.4. Government Initiatives Related to the Market During Pandemic
- 6.5. Manufacturers Strategic Initiatives
- 6.6. Conclusion
7. By Manufacturing Process
- 7.1. Introduction
- 7.1.1. Market Size Analysis and Y-o-Y Growth Analysis (%), By Manufacturing Process
- 7.1.2. Market Attractiveness Index, By Manufacturing Process
- 7.2. Solution Polymerization Process*
- 7.2.1. Introduction
- 7.2.2. Market Size Analysis and Y-o-Y Growth Analysis (%)
- 7.3. Slurry/Suspension Process
- 7.4. Gas-Phase Polymerization Process
8. Application
- 8.1. Introduction
- 8.1.1. Market Size Analysis and Y-o-Y Growth Analysis (%), By Application
- 8.1.2. Market Attractiveness Index, By Application
- 8.2. Sensing*
- 8.2.1. Introduction
- 8.2.2. Market Size Analysis and Y-o-Y Growth Analysis (%)
- 8.3. Energy Harvesting
- 8.4. Thermoelectricity
- 8.5. Others
9. By Region
- 9.1. Introduction
- 9.1.1. Market Size Analysis and Y-o-Y Growth Analysis (%), By Region
- 9.1.2. Market Attractiveness Index, By Region
- 9.2. North America
- 9.2.1. Introduction
- 9.2.2. Key Region-Specific Dynamics
- 9.2.3. Market Size Analysis and Y-o-Y Growth Analysis (%), By Manufacturing Process
- 9.2.4. Market Size Analysis and Y-o-Y Growth Analysis (%), By Application
- 9.2.5. Market Size Analysis and Y-o-Y Growth Analysis (%), By Country
- 9.2.5.1. U.S.
- 9.2.5.2. Canada
- 9.2.5.3. Mexico
- 9.3. Europe
- 9.3.1. Introduction
- 9.3.2. Key Region-Specific Dynamics
- 9.3.3. Market Size Analysis and Y-o-Y Growth Analysis (%), By Manufacturing Process
- 9.3.4. Market Size Analysis and Y-o-Y Growth Analysis (%), By Application
- 9.3.5. Market Size Analysis and Y-o-Y Growth Analysis (%), By Country
- 9.3.5.1. Germany
- 9.3.5.2. UK
- 9.3.5.3. France
- 9.3.5.4. Italy
- 9.3.5.5. Russia
- 9.3.5.6. Rest of Europe
- 9.4. South America
- 9.4.1. Introduction
- 9.4.2. Key Region-Specific Dynamics
- 9.4.3. Market Size Analysis and Y-o-Y Growth Analysis (%), By Manufacturing Process
- 9.4.4. Market Size Analysis and Y-o-Y Growth Analysis (%), By Application
- 9.4.5. Market Size Analysis and Y-o-Y Growth Analysis (%), By Country
- 9.4.5.1. Brazil
- 9.4.5.2. Argentina
- 9.4.5.3. Rest of South America
- 9.5. Asia-Pacific
- 9.5.1. Introduction
- 9.5.2. Key Region-Specific Dynamics
- 9.5.3. Market Size Analysis and Y-o-Y Growth Analysis (%), By Manufacturing Process
- 9.5.4. Market Size Analysis and Y-o-Y Growth Analysis (%), By Application
- 9.5.5. Market Size Analysis and Y-o-Y Growth Analysis (%), By Country
- 9.5.5.1. China
- 9.5.5.2. India
- 9.5.5.3. Japan
- 9.5.5.4. Australia
- 9.5.5.5. Rest of Asia-Pacific
- 9.6. Middle East and Africa
- 9.6.1. Introduction
- 9.6.2. Key Region-Specific Dynamics
- 9.6.3. Market Size Analysis and Y-o-Y Growth Analysis (%), By Manufacturing Process
- 9.6.4. Market Size Analysis and Y-o-Y Growth Analysis (%), By Application
10. Competitive Landscape
- 10.1. Competitive Scenario
- 10.2. Market Positioning/Share Analysis
- 10.3. Mergers and Acquisitions Analysis
11. Company Profiles
- 11.1. Arlanxero*
- 11.1.1. Company Overview
- 11.1.2. Manufacturing Process Portfolio and Description
- 11.1.3. Financial Overview
- 11.1.4. Key Developments
- 11.2. Carlisle Companies Incorporated
- 11.3. Dow Inc.
- 11.4. Exxon Mobil Corporation
- 11.5. PetroChina Company Limited
- 11.6. Versalis S.p.A.
- 11.7. SK Global Chemical Co. Ltd.
- 11.8. Mitsui Chemicals Inc.
- 11.9. Lion Elastomers LLC
- 11.10. SABIC
LIST NOT EXHAUSTIVE
12. Appendix
- 12.1. About Us and Services
- 12.2. Contact Us
