|
|
市場調査レポート
商品コード
1423443
スマート農業の世界市場:2023年~2030年Global Smart Farming Market - 2023-2030 |
||||||
|
|
|||||||
カスタマイズ可能
適宜更新あり
|
|||||||


| スマート農業の世界市場:2023年~2030年 |
|
出版日: 2024年02月09日
発行: DataM Intelligence
ページ情報: 英文 221 Pages
納期: 即日から翌営業日
|

- 全表示
- 概要
- 目次
概要
世界のスマート農業の市場規模は、2022年に111億2,000万米ドルに達し、2023年~2030年の予測期間中にCAGR9.1%で成長し、2030年には224億5,000万米ドルに達すると予測されています。
スマート農業は、作物全体の生産性を向上させ、電気、燃料、肥料、水の使用量を削減できるため、採用が進んでいます。これは農家の生産コスト削減に貢献します。スマート農業は、農家が作物を精密にモニタリングするのに役立つ高度なツールやシステムを幅広く提供しています。これらの要因は、世界のスマート農業市場の成長を後押ししています。
スマート農業市場は絶えず進化しており、新しいデザイン、技術、イノベーションが登場しています。農家は、スマート農業技術が精密農業に役立ち、水の浪費や使用量を削減できることから、スマート農業技術の採用に意欲を示しています。こうした要因は、予測期間中の市場成長を後押しします。
さらに、政府は農家がこれらの技術を採用するのを支援するための制度も打ち出しています。例えば、2021年9月、インド政府はドローンおよびドローン部品に対する生産連動奨励金(PLI)制度を提案しました。この制度は学界や業界の専門家から広く歓迎されています。このスキームには、業界を支援する複数の特徴があります。
力学
精密農業に対する需要の増加
農家は、作物の効率を高め、無駄を省き、作物の総生産量を増やすために最先端技術を適用することができ、スマート農業はますます普及しています。この技術は、農家に作物に関する正確な情報を提供し、作物の資源管理を支援することができます。
さらに、多くの主要企業は、農家を魅了し、高生産を達成するために役立つ高品質の製品を生産することに注力しています。例えば、2022年3月、Ambeeは、農家や農業関連企業にデータサイエンス技術を提供し、農場を健全化する新しい製品「SmartFarming Data」を発表しました。これにより、農家は自分の農場をよりよく理解し、気候変動が農業に与える影響を緩和し、土壌劣化を監視・緩和する対策を講じ、農業生産性を向上させることができます。
革新的技術
革新的なスマート農業技術の継続的な開発は、これらの技術の採用を増やすのに役立ちます。スマート農業技術は、モノのインターネット、ドローン、無人航空機など、幅広い先進技術を提供します。これらの技術は作物の精密なモニタリングを提供するため、農家による採用拡大を支えています。
さらに、主要企業は消費者基盤を拡大するため、革新的な製品を継続的に発表しています。例えば、2023年7月、XAG農業ドローンP100 Proがベトナムで発売されました。この製品は、ベトナムの農家に50キログラムの大きなペイロードを持つ完全自律型の簡単な操作ソリューションを提供します。これらの発売は市場成長を後押ししています。
高い製品コスト
スマート農業技術のコストは、使用される先端技術、材料の品質、ブランド、入手可能な地域によって異なります。高価格の技術は、特に小規模農家や未開発地域の農家など、より多くの消費者層にとって利用しにくくなる可能性があります。こうした要因は、市場規模の縮小を引き起こす可能性があります。
例えば、トラクター・ジャンクションによると、散布用ドローンの価格は35万インドルピーから125万インドルピーです。このような高コストは、スマート農業技術の採用を減少させ、世界のスマート農業市場の衰退を引き起こす可能性があります。
目次
第1章 調査手法と調査範囲
第2章 定義と概要
第3章 エグゼクティブサマリー
第4章 市場力学
- 影響要因
- 促進要因
- 精密農業に対する需要の増加
- 革新的技術
- 抑制要因
- 製品コストの高さ
- 機会
- 影響分析
- 促進要因
第5章 産業分析
- ポーターのファイブフォース分析
- サプライチェーン分析
- 価格分析
- 規制分析
第6章 COVID-19分析
第7章 農業タイプ別
- 精密農業
- 家畜モニタリング
- 魚類養殖
- スマート温室
- その他
第8章 製品別
- ハードウェア
- モニター
- コントローラー
- センサー
- その他
- ソフトウェア
- ウェブベース
- クラウドベース
- サービス
- システムインテグレーションとコンサルティング
- サポートとメンテナンス
- 接続サービス
- マネージドサービス
- プロフェッショナルサービス
第9章 ソリューション別
- ネットワーク管理
- 農業資産管理
- スマート水管理
- 物流・サプライチェーン管理
- その他
第10章 農場規模別
- 小規模農場
- 中規模農場
- 大規模農場
第11章 流通チャネル別
- 直営店
- Eコマース
- 専門店
- その他
第12章 用途別
- 収量モニタリング
- フィールドマッピング
- 作物スカウティング
- 天候追跡と予測
- 灌漑管理
- 給餌管理
- ミルク収穫
- 魚類追跡
- その他
第13章 エンドユーザー別
- 畜産
- 農業
- 水産養殖
第14章 地域別
- 北米
- 米国
- カナダ
- メキシコ
- 欧州
- ドイツ
- 英国
- フランス
- イタリア
- ロシア
- その他欧州
- 南米
- ブラジル
- アルゼンチン
- その他南米
- アジア太平洋
- 中国
- インド
- 日本
- オーストラリア
- その他アジア太平洋
- 中東・アフリカ
第15章 競合情勢
- 競合シナリオ
- 市況/シェア分析
- M&A分析
第16章 企業プロファイル
- XAG
- 会社概要
- 製品ポートフォリオと説明
- 財務概要
- 最近の開発
- Ag Leader Technology, Inc
- AgJunction Inc
- Deere & Company
- Afimilk Agricultural Cooperative Ltd.
- DeLaval
- AKVA Group
- Aquabyte Inc.
- BouMatic LLC
- InnovaSea Systems, Inc. LIST NOT EXHAUSTIVE
第17章 付録
Overview
Global Smart Farming Market reached US$ 11.12 billion in 2022 and is expected to reach US$ 22.45 billion by 2030, growing with a CAGR of 9.1% during the forecast period 2023-2030.
Smart farming is highly being adopted as it can help increase the overall productivity of the crop and reduces the usage of electricity, fuel, fertilizers, and water. Which helps the cost of production for farmers. Smart farming offers a wide range of advanced tools and systems that helps the farmers with precision monitoring of crops. These factors help in boosting the global smart farming market growth.
The smart farming market is continuously evolving, with new designs, techniques, and innovations emerging. Farmers show more willingness to adopt smart farming technologies as they help in precision farming and reduce wastage and usage of water. These factors help in boosting the market growth during the forecast period.
Furthermore, the government is also launching schemes to help the farmers to adopt these technologies. For instance, In September 2021, the government of India proposed a Production Linked Incentive (PLI) scheme for drones and drone components. This scheme has been widely welcomed by academia and industry experts. This scheme has multiple features to help the industry.
Dynamics
Increase in Demand for Precision Farming
Farmers are able to apply cutting-edge technologies to increase crop efficiency, cut waste, and boost total crop output, smart farming is becoming more and more popular. This technology can give farmers precise information on the crops, assisting them in managing the crop's resources., this can help in increasing the adoption of smart farming.
Furthermore, many key players are focusing to produce high-quality products to attract and help the farmers in order to achieve high production. For instance, In March 2022, Ambee launched SmartFarming Data', a new offering that brings data science techniques to farmers and agribusinesses to improve the health of their farms. This allows the farmers to understand their farms better, mitigate the impact of climate change on agriculture, take measures to monitor and mitigate soil degradation and increase agricultural productivity.
Innovative Technology
The continuous development of innovative smart farming technology helps increase the adoption of these technologies. Smart farming technologies offer a wide range of advanced technologies such as the Internet of things, drones, unmanned aerial vehicles, and some others. As these technologies offer precision monitoring of crops, they can help in increasing adoption by farmers.
Furthermore, key players are continuously launching innovative products in order to increase their consumer base. For instance, In July 2023, XAG agriculture drone P100 Pro has launched in Vietnam, it helps in increasing the efficiency and agility on farms to higher levels. This product provides Vietnamese farmers with a fully autonomous, easy-to-operate solution with a large payload of 50 kilograms. These launches help in boosting the market growth.
High Product Cost
The cost of smart farming technologies can vary depending on the advanced technologies used, quality of materials, brand, and area of availability. High-priced technologies can make them less accessible for a larger consumer base, especially for small-scale farmers, or undeveloped area farmers. These factors can cause declination in market size.
For instance, the high cost may vary on the type of product, for instance, According to Tractor Junction the Spraying drone costs between 3.5 lakh INR to 12.5 lakh INR. These high costs can reduce the adoption of the smart farming technologies which can cause declination in global smart farming market.
Segment Analysis
The global Smart Farming market is segmented based on agriculture type, offering, solution, farm size, distribution channel, application, end-user, and region.
Rising Demand For Effective Crop Productivity
The yield monitoring segment holds a major share of the global smart farming market. Smart farming provides sensor technology that helps in monitoring and collecting data regarding various factors such as soil moisture, temperature, humidity, and nutrient levels in crops. They help in providing the farmers to take decisions regarding irrigation, and fertilizers usage. These factors can help in increasing crop productivity.
Furthermore, many manufacturers are focusing to produce innovative products to attract large-scale farmers. For instance, In April 2023, Bosch BASF Smart Farming and Bosch and BASF Digital Farming started a joint venture, to make a global market and sell smart farming technology which is ONE SMART SPRAY. This offers customized agronomic recommendations, intelligent sensitivity levels, high-precision agronomic maps, automated documentation, and further features in ONE solution. This is truly smart weed control, which supports maximum input efficiency and more sustainable farming practices.
Geographical Penetration
North America's Growing Smart Farming Industry
The North American smart farming market has witnessed significant growth and popularity covering maximum share in 2022. The farmers in this region are more attracted to these technology as they help in precision farming, helps in providing accurate information regarding the usage of fertilizers, water, and others. These factors help in driving the market in this region.
Furthermore, major manufacturing companies are expanding their market in this by launching a wide range of products. For instance, In May 2023, Volatus Aerospace Corp has announces it has received a Transport Canada special authority to operate heavy crop spraying drones weighing over 25 kg anywhere in Canada. This provides an ability to offer compliant drone crop spraying services across Canada for our precision agriculture clients.
Source: DataM Intelligence Analysis (2023)
Competitive Landscape
The major global players include XAG, Ag Leader Technology, Inc., AgJunction Inc., Deere & Company, Afimilk Agricultural Cooperative Ltd., DeLaval, AKVA Group, Aquabyte Inc., BouMatic LLC, and InnovaSea Systems, Inc.
COVID-19 Impact Analysis
COVID Impact
The pandemic brought a disruption in the supply chain due to government lockdown restrictions, it affected agriculture practices. Many manufacturing countries are shut down due to inadequate supply of raw materials and low employment ratio. These factors showed a negative impact on the global smart farming market.
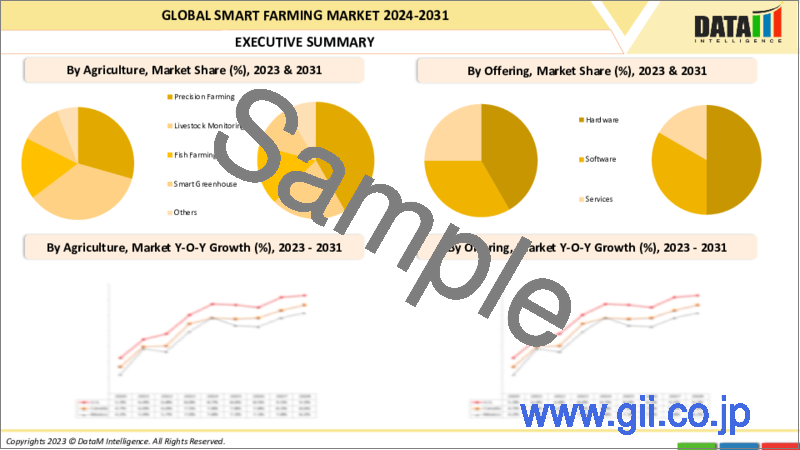
By Agriculture Type
- Precision Farming
- Livestock Monitoring
- Fish Farming
- Smart Greenhouse
- Others
By Offering
- Hardware
- Monitors
- Controllers
- Sensors
- Software
- Web Based
- Cloud Based
- Service
- System Intergration and Consulting
- Support and Maintenance
- Connectivity Services
- Managed Services
- Professional Services
By Solution
- Network Management
- Agriculture Asset Management
- Smart Water Management
- Logistics and Supply Chain Management
- Others
By Farm Size
- Small Farms
- Medium Farms
- Large Farms
By Distribution Channel
- Company Stores
- E-Commerce
- Specialty Stores
- Others
By Application
- Yield Monitoring
- Field Mapping
- Crop Scouting
- Weather Tracking and Forecasting
- Irrigation Management
- Feeding Management
- Milk Harvesting
- Fish Tracking
- Others
By End-User
- Livestock
- Agriculture
- Aquaculture
By Region
- North America
- U.S.
- Canada
- Mexico
- Europe
- Germany
- UK
- France
- Italy
- Russia
- Rest of Europe
- South America
- Brazil
- Argentina
- Rest of South America
- Asia-Pacific
- China
- India
- Japan
- Australia
- Rest of Asia-Pacific
- Middle East and Africa
Key Developments
- In March 2023, Pepsico and Cropin, a leading global agri-tech company collaborated. Pepsico India, through its brand "Lay's", announced a crop & plot-level predictive intelligence model to help farmers maximize potato yields coupled with quality via functional dashboards on user-friendly mobile apps for Precision Agriculture model for India and is being implemented as a pilot project in demo farms at Gujarat and Madhya Pradesh.
- In June 2023, Hyderabad-based company Magellanic Cloud introduced agricultural and logistics drones with various capacities and ranges. These drones, made in India, are capable of autonomous operation without the need for human guidance with operational ranges varying from 5 km to 60 km, and can carry cargo payloads ranging from 2 kg to 100 kg.
- In August 2023, Delaval launched a cutting-edge E-series rotary milking system with helps in increases milking efficiency, streamlines worker routines, automates the selecting and sorting of cows, and minimizes stress on dairy cattle.
Why Purchase the Report?
- To visualize the global Smart Farming market segmentation based on agriculture type, offering, solution, farm size, distribution channel, application, end-user, and region, as well as understand key commercial assets and players.
- Identify commercial opportunities by analyzing trends and co-development.
- Excel data sheet with numerous data points of Smart Farming market-level with all segments.
- PDF report consists of a comprehensive analysis after exhaustive qualitative interviews and an in-depth study.
- Product mapping available as Excel consisting of key products of all the major players.
The global smart farming market report would provide approximately 93 tables, 109 figures and 221 Pages.
Target Audience 2023
- Manufacturers/ Buyers
- Industry Investors/Investment Bankers
- Research Professionals
- Emerging Companies
Table of Contents
1. Methodology and Scope
- 1.1. Research Methodology
- 1.2. Research Objective and Scope of the Report
2. Definition and Overview
3. Executive Summary
- 3.1. Snippet by Agriculture Type
- 3.2. Snippet by Offering
- 3.3. Snippet by Solution
- 3.4. Snippet by Farm Size
- 3.5. Snippet by Distribution Channel
- 3.6. Snippet by Application
- 3.7. Snippet by End-User
- 3.8. Snippet by Region
4. Dynamics
- 4.1. Impacting Factors
- 4.1.1. Drivers
- 4.1.1.1. Increase in Demand for Precision Farming
- 4.1.1.2. Innovative Technology
- 4.1.2. Restraints
- 4.1.2.1. High Product Cost
- 4.1.3. Opportunity
- 4.1.4. Impact Analysis
- 4.1.1. Drivers
5. Industry Analysis
- 5.1. Porter's Five Force Analysis
- 5.2. Supply Chain Analysis
- 5.3. Pricing Analysis
- 5.4. Regulatory Analysis
6. COVID-19 Analysis
- 6.1. Analysis of COVID-19
- 6.1.1. Scenario Before COVID
- 6.1.2. Scenario During COVID
- 6.1.3. Scenario Post COVID
- 6.2. Pricing Dynamics Amid COVID-19
- 6.3. Demand-Supply Spectrum
- 6.4. Government Initiatives Related to the Market During Pandemic
- 6.5. Manufacturers Strategic Initiatives
- 6.6. Conclusion
7. By Agriculture Type
- 7.1. Introduction
- 7.1.1. Market Size Analysis and Y-o-Y Growth Analysis (%), By Agriculture Type
- 7.1.2. Market Attractiveness Index, By Agriculture Type
- 7.2. Precision Farming*
- 7.2.1. Introduction
- 7.2.2. Market Size Analysis and Y-o-Y Growth Analysis (%)
- 7.3. Livestock Monitoring
- 7.4. Fish Farming
- 7.5. Smart Greenhouse
- 7.6. Others
8. By Offering
- 8.1. Introduction
- 8.1.1. Market Size Analysis and Y-o-Y Growth Analysis (%), By Offering
- 8.1.2. Market Attractiveness Index, By Offering
- 8.2. Hardware*
- 8.2.1. Introduction
- 8.2.2. Market Size Analysis and Y-o-Y Growth Analysis (%)
- 8.2.3. Monitors
- 8.2.4. Controllers
- 8.2.5. Sensors
- 8.2.6. Others
- 8.3. Software
- 8.3.1. Web Based
- 8.3.2. Cloud Based
- 8.4. Services
- 8.4.1. System Intergation and Consulting
- 8.4.2. Support and Maintenance
- 8.4.3. Connectivity Services
- 8.4.4. Managed Services
- 8.4.5. Professional Services
9. By Solution
- 9.1. Introduction
- 9.1.1. Market Size Analysis and Y-o-Y Growth Analysis (%), By Solution
- 9.1.2. Market Attractiveness Index, By Solution
- 9.2. Network Mangement*
- 9.2.1. Introduction
- 9.2.2. Market Size Analysis and Y-o-Y Growth Analysis (%)
- 9.3. Agriculture Asset Management
- 9.4. Smart Water Management
- 9.5. Logistics and supply Chain Management
- 9.6. Others
10. By Farm Size
- 10.1. Introduction
- 10.1.1. Market Size Analysis and Y-o-Y Growth Analysis (%), By Farm Size
- 10.1.2. Market Attractiveness Index, By Farm Size
- 10.2. Small Farms*
- 10.2.1. Introduction
- 10.2.2. Market Size Analysis and Y-o-Y Growth Analysis (%)
- 10.3. Medium Farms
- 10.4. Large Farms
11. By Distribution Channel
- 11.1. Introduction
- 11.1.1. Market Size Analysis and Y-o-Y Growth Analysis (%), By Distribution Channel
- 11.1.2. Market Attractiveness Index, By Distribution Channel
- 11.2. Company Stores*
- 11.2.1. Introduction
- 11.2.2. Market Size Analysis and Y-o-Y Growth Analysis (%)
- 11.3. E-Commerce
- 11.4. Specialty Stores
- 11.5. Others
12. By Application
- 12.1. Introduction
- 12.1.1. Market Size Analysis and Y-o-Y Growth Analysis (%), By Application
- 12.1.2. Market Attractiveness Index, By Application
- 12.2. Yield Monitoring*
- 12.2.1. Introduction
- 12.2.2. Market Size Analysis and Y-o-Y Growth Analysis (%)
- 12.3. Field Mapping
- 12.4. Crop Scouting
- 12.5. Weather Tracking and Forecasting
- 12.6. Irrigation Management
- 12.7. Feeding Management
- 12.8. Milk Harvesting
- 12.9. Fish Tracking
- 12.10. Others
13. By End-User
- 13.1. Introduction
- 13.1.1. Market Size Analysis and Y-o-Y Growth Analysis (%), By End-User
- 13.1.2. Market Attractiveness Index, By End-User
- 13.2. Livestock*
- 13.2.1. Introduction
- 13.2.2. Market Size Analysis and Y-o-Y Growth Analysis (%)
- 13.3. Agriculture
- 13.4. Aquaculture
14. By Region
- 14.1. Introduction
- 14.1.1. Market Size Analysis and Y-o-Y Growth Analysis (%), By Region
- 14.1.2. Market Attractiveness Index, By Region
- 14.2. North America
- 14.2.1. Introduction
- 14.2.2. Key Region-Specific Dynamics
- 14.2.3. Market Size Analysis and Y-o-Y Growth Analysis (%), By Agriculture Type
- 14.2.4. Market Size Analysis and Y-o-Y Growth Analysis (%), By Offering
- 14.2.5. Market Size Analysis and Y-o-Y Growth Analysis (%), By Solution
- 14.2.6. Market Size Analysis and Y-o-Y Growth Analysis (%), By Farm size
- 14.2.7. Market Size Analysis and Y-o-Y Growth Analysis (%), By Distribution Channel
- 14.2.8. Market Size Analysis and Y-o-Y Growth Analysis (%), By Application
- 14.2.9. Market Size Analysis and Y-o-Y Growth Analysis (%), By End-User
- 14.2.10. Market Size Analysis and Y-o-Y Growth Analysis (%), By Country
- 14.2.10.1. U.S.
- 14.2.10.2. Canada
- 14.2.10.3. Mexico
- 14.3. Europe
- 14.3.1. Introduction
- 14.3.2. Key Region-Specific Dynamics
- 14.3.3. Market Size Analysis and Y-o-Y Growth Analysis (%), By Agriculture Type
- 14.3.4. Market Size Analysis and Y-o-Y Growth Analysis (%), By offering
- 14.3.5. Market Size Analysis and Y-o-Y Growth Analysis (%), By Solution
- 14.3.6. Market Size Analysis and Y-o-Y Growth Analysis (%), By Farm Size
- 14.3.7. Market Size Analysis and Y-o-Y Growth Analysis (%), By Distribution Channel
- 14.3.8. Market Size Analysis and Y-o-Y Growth Analysis (%), By Application
- 14.3.9. Market Size Analysis and Y-o-Y Growth Analysis (%), By End-User
- 14.3.10. Market Size Analysis and Y-o-Y Growth Analysis (%), By Country
- 14.3.10.1. Germany
- 14.3.10.2. UK
- 14.3.10.3. France
- 14.3.10.4. Italy
- 14.3.10.5. Russia
- 14.3.10.6. Rest of Europe
- 14.4. South America
- 14.4.1. Introduction
- 14.4.2. Key Region-Specific Dynamics
- 14.4.3. Market Size Analysis and Y-o-Y Growth Analysis (%), By Agriculture Type
- 14.4.4. Market Size Analysis and Y-o-Y Growth Analysis (%), By offering
- 14.4.5. Market Size Analysis and Y-o-Y Growth Analysis (%), By Solution
- 14.4.6. Market Size Analysis and Y-o-Y Growth Analysis (%), By Farm Size
- 14.4.7. Market Size Analysis and Y-o-Y Growth Analysis (%), By Distribution Channel
- 14.4.8. Market Size Analysis and Y-o-Y Growth Analysis (%), By Application
- 14.4.9. Market Size Analysis and Y-o-Y Growth Analysis (%), By End-User
- 14.4.10. Market Size Analysis and Y-o-Y Growth Analysis (%), By Country
- 14.4.10.1. Brazil
- 14.4.10.2. Argentina
- 14.4.10.3. Rest of South America
- 14.5. Asia-Pacific
- 14.5.1. Introduction
- 14.5.2. Key Region-Specific Dynamics
- 14.5.3. Market Size Analysis and Y-o-Y Growth Analysis (%), By Agriculture Type
- 14.5.4. Market Size Analysis and Y-o-Y Growth Analysis (%), By offering
- 14.5.5. Market Size Analysis and Y-o-Y Growth Analysis (%), By Solution
- 14.5.6. Market Size Analysis and Y-o-Y Growth Analysis (%), By Farm Size
- 14.5.7. Market Size Analysis and Y-o-Y Growth Analysis (%), By Distribution Channel
- 14.5.8. Market Size Analysis and Y-o-Y Growth Analysis (%), By Application
- 14.5.9. Market Size Analysis and Y-o-Y Growth Analysis (%), By End-User
- 14.5.10. Market Size Analysis and Y-o-Y Growth Analysis (%), By Country
- 14.5.10.1. China
- 14.5.10.2. India
- 14.5.10.3. Japan
- 14.5.10.4. Australia
- 14.5.10.5. Rest of Asia-Pacific
- 14.6. Middle East and Africa
- 14.6.1. Introduction
- 14.6.2. Key Region-Specific Dynamics
- 14.6.3. Market Size Analysis and Y-o-Y Growth Analysis (%), By Agriculture Type
- 14.6.4. Market Size Analysis and Y-o-Y Growth Analysis (%), By offering
- 14.6.5. Market Size Analysis and Y-o-Y Growth Analysis (%), By Solution
- 14.6.6. Market Size Analysis and Y-o-Y Growth Analysis (%), By Farm Size
- 14.6.7. Market Size Analysis and Y-o-Y Growth Analysis (%), By Distribution Channel
- 14.6.8. Market Size Analysis and Y-o-Y Growth Analysis (%), By Application
- 14.6.9. Market Size Analysis and Y-o-Y Growth Analysis (%), By End-User
15. Competitive Landscape
- 15.1. Competitive Scenario
- 15.2. Market Positioning/Share Analysis
- 15.3. Mergers and Acquisitions Analysis
16. Company Profiles
- 16.1. XAG*
- 16.1.1. Company Overview
- 16.1.2. Product Portfolio and Description
- 16.1.3. Financial Overview
- 16.1.4. Recent Developments
- 16.2. Ag Leader Technology, Inc
- 16.3. AgJunction Inc
- 16.4. Deere & Company
- 16.5. Afimilk Agricultural Cooperative Ltd.
- 16.6. DeLaval
- 16.7. AKVA Group
- 16.8. Aquabyte Inc.
- 16.9. BouMatic LLC
- 16.10. InnovaSea Systems, Inc. LIST NOT EXHAUSTIVE
17. Appendix
- 17.1. About Us and Services
- 17.2. Contact Us
